The primordial abundance of Deuterium The metal enrichment of the intergalactic medium - Valentina D'Odorico INAF - Osservatorio Astronomico di ...
←
→
Page content transcription
If your browser does not render page correctly, please read the page content below

The primordial abundance of
 Deuterium
The metal enrichment of the
 intergalactic medium
 Valentina D’Odorico
 INAF – Osservatorio Astronomico di Trieste
 Scuola Normale Superiore - Pisa

Deuterium as a baryometer
 Deuterium formation during BBN

 p+n 2D +γ

 Deuterium destruction

 2D +p 3He+γ
 2D + 3He 4He + p

 10 = 273.78 ± 0.18 x Ω 0 ℎ2
 (Steigman 2006)

 Observed abundances

 Planck CMB estimate of the baryon density

 BBN concordance range (from D/H)

Deuterium at high redshift
Adams (1976) The detectability of Deuterium Lyman alpha in QSOs
 Detection requirements
 n(D)/n(H) = 10-5 log N(HI)
 Average spectral resolution → the
 17.9
 velocity shift between D I and H I is
 -81.6 km/s
 b = 6 km/s
 High sensitivity → to obtain a high S/N
 n(D)/n(H) = 10-5 (need of 8-10m class telescopes)

 Wide wavelength coverage → to
 b = 10 km/s have many Lyman transitions and
 associated metal lines
 n(D)/n(H) = 10-5
 18.2 The absorber need to have:
 b ≤ 20 km s-1
 b = 15 km/s N(HI) > 3 x 1017 cm-2

 Tytler, Fan & Burles (Nature, 1996)
 b = 15 km/s First reliable detection with HIRES@Keck
 n(D)/n(H) = 10-4 D/H = (2.3 ± 0.3 ± 0.3) x 10-5
Deuterium at high redshift
weighted mean UVES measurement
value
D I/H I =
2.527 ± 0.030 × 10⁻⁵

 Planck
 CMB

 Cooke et al. (2018): for this sample of carefully chosen systems (only 7) the intrinsic scatter is
 less than 2σ. Statistically consistent with being drawn from a constant D/H value.
 No detected correlation with redshift, HI column density or metallicity.
 (See also Riemer-Sørensen et al. 2017)

 At present there are less than 20 absorption systems used to determine
 the D/H abundance → more systems would be needed to assess the
 possible dependence of the measurements on properties of the
 absorbers and the nature of the scatter.
Deuterium at high z: future improvements
Spectrograph requirements:
• Coverage and efficiency in the UV range (~300-400 nm)
• Good wavelength extension to cover also the associated metal
 transitions

 Science case for the CUBES spectrograph

 but need to be complemented with UVES (fiber link under evaluation)

 CUBES (R~20k)

 X-Shooter Suggested UVES improvements:
 (R~5k) o Increase of the efficiency in the
 X-Shooter
 (R~10k) blue, visual bands;
 o no or very small gaps in the
 wavelength coverage.
 UVES (R ≥ 40k)
IGM: the revolution of the 90s
Ø New interpretation of the nature of the Lyman-α forest due to semi-
 analytical (e.g. Bi et al. 1992; Bi 1993; Bi & Davidsen 1997) and hydro-
 dynamical (e.g. Cen et al. 1994; Miralda-Escudé et al. 1996; Theuns et al.
 1998; Zhang et al. 1995, 1998) simulations

 Lines are not due to a population of
 clouds but arise from the fluctuations
 present in the IGM, gravitationally
 grown from primordial fluctuations in
 the context of the scenario of
 hierarchical structure formation è
 The Lyman- forest is believed to be
 a signature of the cosmic web

 Simulations can reproduce
 observational properties of the
 Lyman- forest
Zhang et al. 1998
IGM: the revolution of the 90s
Ø Advent of high-resolution echelle spectrographs combined
 with 8-10m class telescopes

 Metal absorption lines associated with H I lines with log NHI ≥14.5 (Tytler et al.
 1995; Cowie et al. 1995).
 [C/H]=−2.5 at z~3 in slightly overdense regions with 1 order of mag. scatter
 (Rauch et al. 1997).
 Evidence of metals outside galaxies, implying the existence of
 feedback processes.
The Large Program
 “Cosmic evolution of the IGM”
 P.I. J. Bergeron - 334 hours of UVES observations with seeing ≤ 0.8 arcsec

19 QSOs at zem~2-3, with a uniform spectral
coverage, resolution and signal-to-noise ratio
suitable for studying the IGM in the redshift
range 1.7–3.2. Selected to have no DLAs.

Several science cases:
Variability of fundamental constants → Michael’s talk

Metal enrichment → this talk

Probing the matter distribution with the Lyman-
forest → Kim et al. (2004), Viel et al. (2004a,b), Zaroubi
et al. (2006)…

More than 100 papers based on these data
(source: ESO TelBib)

 A multipurpose homogeneous sample whose legacy
 value is still important after more than 15 years

 Bergeron et al. (2004)
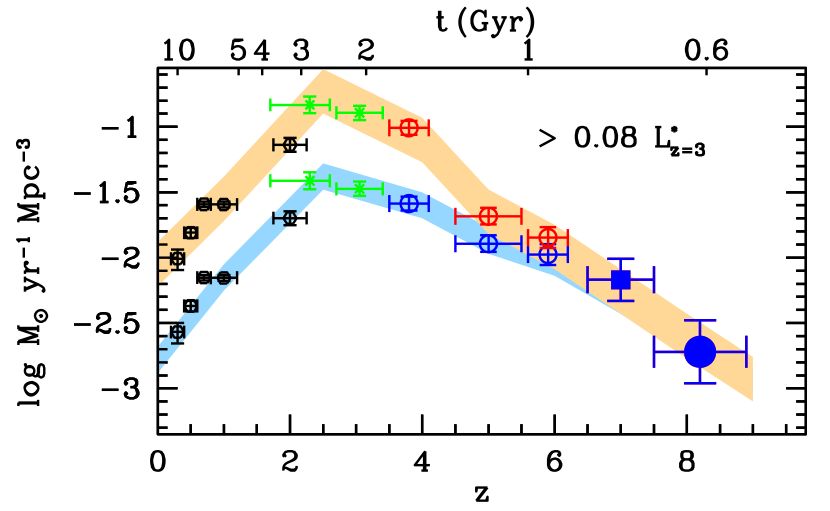
Enrichment scenarii and the nature of
 the first sources
 EARLY
 Many small galaxies
 ionize and enrich ENRICHMENT
 the IGM at z~10

 Metals are sprinkled
 in the IGM to low
 densities, creating a
 metallicity floor at
 Z~10 -3 Zo

 z~2-3
Credits: STScI
Statistical properties of metals in the IGM
Pichon et al. (2003), Scannapieco et al. (2006)
The large scale clustering of metal absorbers encodes information about the mass
of the objects that ejected them;
The small scale clustering of metal absorbers constrains the maximal extent of the
enriched region è the energetics of the sources.

Sample: 619 CIV (1548, 1551 Å) and 81 SiIV (1394, 1403 Å) absorption lines

 Two-point correlation function in redshift space

 ξ(v) for CIV and SiIV:
 • steep decline at large separations, roughly
 consistent with the slope of the ΛCDM
 matter correlation function and the spatial
 clustering of z ≈3 Lyman-break galaxies.

 • Flattening at separations below ≈150 km s−1
Statistical properties of metals in the IGM
 Pichon et al. (2003), Scannapieco et al. (2006)
 Comparison with hydro-simulations and semi-analytical models

Constant metallicity at Z = 10−2 Z⊙ 2nd approach: Paint bubbles of radius Rs on
and metallicity as a simple DM haloes of mass Ms enriched at constant
function of overdensity metallicity Zb ≈ 0.2 Z⊙ at z=3
 Z = Δ2/3 10−3 Z⊙
 do not explain
 the observed
 CIV ξ(v).
Statistical properties of metals in the IGM
Pichon et al. (2003), Scannapieco et al. (2006)
Comparison with hydro-simulations and semi-analytical models

Best fit: large metal bubbles, Rs ≈ 2 comoving Mpc, around highly biased sources,
with Ms ≈ 1012 M⊙. These are not necessarily the sources of the observed metals.
These polluted regions could be related to less massive, higher-redshift objects,
which exhibit similar clustering properties (Porciani & Madau 2005; Scannapieco
2005).
Statistical properties of metals in the IGM
D’Odorico et al. (2010)
Redshift evolution of the cosmic mass density of CIV

 Driven by metal enrichment and
 UVES ionisation state of metal-enriched
 D’Odorico+2010 gas.
 NB CIV is not tracing the same gas
 at the different redshift

 13.4 ≤ log ≤ 15.0
Pixel optical depth method
Aracil et al. 2004 (see also Schaye et al. 2003)
 !"# = − ln( ) for 0.2
The UVES deep spectrum
Investigate the metallicity of the IGM approaching the
mean density with very high signal-to-noise ratio spectra

 Ellison et al. (2000) : SNR~200 of B1422+231 at z~3.6
 HE0940-1050 at zem~3.0 with V=16.9 Texp=64 h SNR~300-600 per res. el.

 Ly-α forest HI Ly-α

 Metal lines
 NV

 Si IV CIV

 D’Odorico et al. 2016
The UVES deep spectrum
D’Odorico et al. 2016

Column density distribution functions Def. Number of lines per unit
 °10
 This work
 column density and per unit
 °11 Ellison et al. 2000 absorption path
 D’Odorico et al. 2010
 °12

 °13
 log dn/dNdX

 °14

 °15

 °16
 C IV
 °17
 N(CIV)=11.52
 11.0 11.5 12.0 12.5 13.0 13.5
 log N(CIV)
 14.0 14.5 15.0 15.5
 3σ detection
 1.0

 0.8

 0.6
 ¢z/¢ztot

 0.4

 CIV completeness limits LP spectrum
 0.2
 SNR per res. el. ~ 130
 0.0
 11.0 11.1 11.2 11.3 11.4
 log N(CIV)
The UVES deep spectrum
D’Odorico et al. 2016 50

 12
 14
 Z
 Z
 = °4.0
 = °3.0 Cloudy models
NCIV 13
 Z
 Z
 = °2.0
 = °1.0
 3
 HM background
 log NCIV

vs (1+δ)=1
 Solar relative abund.
NHI
 12 T=104 (1+δ)0.5
 11 z=2.8

 14
 Assumption: the
NOVI Jeans scale is the
vs
 13
 characteristic scale of
 log NOV I

 the IGM. Used to
NHI 12
 transform NHI into
 11
 (1+δ)
 13.0 13.5 14.0 14.5 15.0 15.5
 13.5 14.0 log NHI 14.8

 Enriched volume to log Z/Zo ≥ −3:
 14.0 ≤ log NHI
Metallicity of the IGM:
 future perspectives
Metallicity of the low density IGM A new deep spectrum would
cost a lot of observing time science case for HIRES@ELT

 BUT, note that

There is a new fantastic sample of bright QSOs at z ≥ 2.5 in the Southern
sky: the QUBRICS survey (Calderone et al. 2019; Boutsia et al. 2020).
 ✻ It could be time for a new QSO Large
 Programme with UVES to cover the redshift
 range 3 < z < 5 ✻

 Suggested UVES improvements:
 ✧ Increase of the efficiency in the blue, visual bands

 ✧ no or very small gaps in the wavelength coverage
Thank you
 and
long live UVES!!
You can also read