The Road Safety and Environmental Impact of LED Spectra in route lighting
←
→
Page content transcription
If your browser does not render page correctly, please read the page content below
The Road Safety and Environmental Impact of LED
Spectra in route lighting

                                                                         Contact Details

                                                                         Bill Frith WSP Research
                                                                         and Evaluation,

                                                                         33 The Esplanade, Petone,
                                                                         Lower Hutt, 5012

                                                                         +64 4 5870690

                                                                         +64 21 2446897

                                                                         William.frith@wsp.com
                                                                         Document Details:

                                                                         Date:   3/6/2021

                                                                         Reference:     5-20088.00

                                                                         Status:
                                                                         Petone Draft
                                                                         Prepared by:5012
                                                                         Lower Hutt   Bill Frith

                                                                         +64 4 587 0690

                                                                         +64 27 245 0513

                                                                         William.Frith@wsp.com

Disclaimers
This report has been prepared by WSP exclusively for Waka Kotahi NZTA. The findings in this
Report are based on and are subject to the assumptions specified in the Report. WSP accepts no
liability whatsoever for any reliance on or use of this Report, in whole or in part, for any use or
purpose other than the Purpose or any use or reliance on the Report by any third party.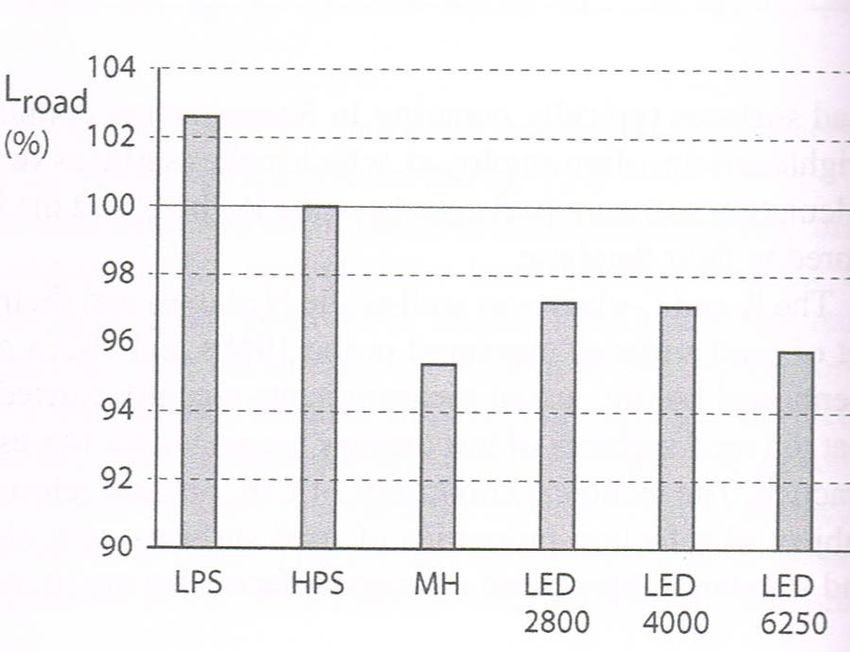
Table of Contents
Executive summary ..................................................................................................................................................................................................... 3

1            Introduction ........................................................................................................................................................................................................ 4

2            Safety issues......................................................................................................................................................................................................... 4
             2.1          Visibility of objects by drivers ................................................................................................................................................. 4
                          2.1.1         Visibility of off the road objects by drivers ................................................................................................... 4
                          2.1.2          Visibility of objects on the road by drivers ................................................................................................. 6
                          2.1.3          Conclusions .......................................................................................................................................................................... 8
             2.2          . Driver Fatigue ................................................................................................................................................................................... 8
                          2.2.1          Discussion .............................................................................................................................................................................. 8
                          2.2.2           Conclusion.......................................................................................................................................................................... 10
             2.3          The impact of driver age and pavement absorption ..................................................................................... 10
                          2.3.1          The performance of LEDs under mesopic conditions................................................................... 10
                          2.3.2           The wavelength related absorption properties of the human eye’s lens as it ages
                                          11
                          2.3.3           The wavelength related narrowing of the pupil with age ......................................................... 15
                          2.3.4           The wavelength related absorption properties of road surfaces. ........................................16
             2.4          Combined impact of pavement and lens absorption in mesopic conditions .........................18

3            Environmental issues ................................................................................................................................................................................19
             3.1          Wildlife ....................................................................................................................................................................................................19
                          3.1.1         Seabirds ................................................................................................................................................................................... 21
             3.2          Dimming, safety, and the environment ..................................................................................................................... 21
             3.3          Sky glow ................................................................................................................................................................................................ 22

4            Consequences of a switch from HPS to LED ....................................................................................................................... 23

5            Conclusions. ...................................................................................................................................................................................................... 24

References ........................................................................................................................................................................................................................25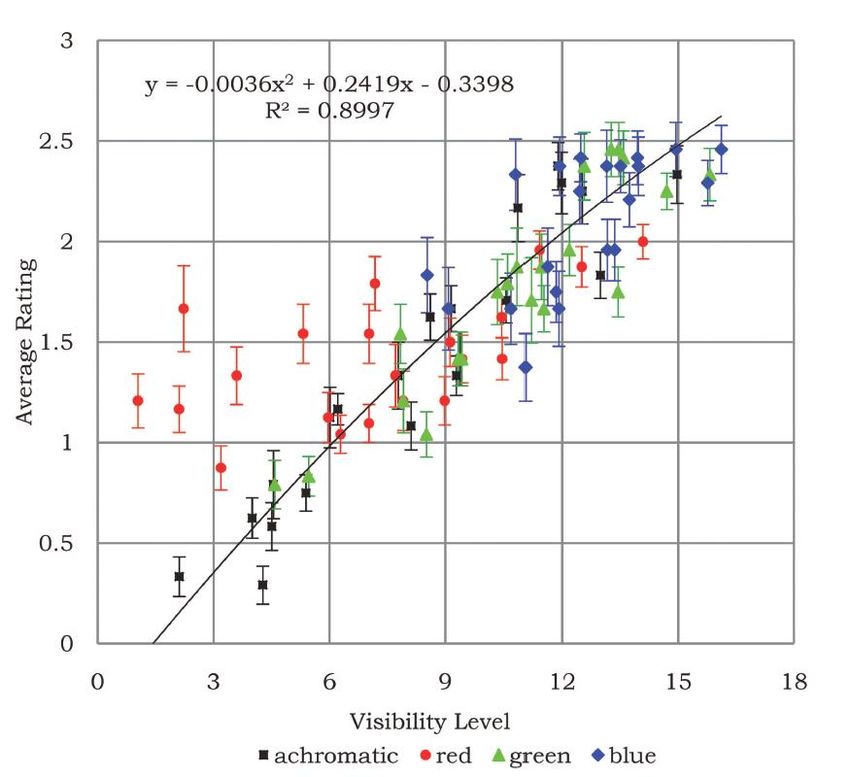
Executive summary
Route streetlighting’s main objective is to allow drivers to see obstacles on the road. A secondary
objective is to allow them to see objects on the roadside (like pedestrians and vehicles on
driveways) which have the potential to become obstacles on the road. If not carefully controlled
streetlighting also can generate unintended consequences. These can include impacts on
humans, animals, insects and the beauty of the night sky. It is also a duty of lighting designers to
provide the required lighting as efficiently as possible in terms of electricity usage, The has led to a
move over the last fifteen years or so to replace High Pressure Sodium (HPS) lights with Light
Emitting Diode (LED) lights which use far less energy than the HPS lights and can be relatively
easily dimmed or turned up leading to the possibility of lighting designs with more temporal
flexibility.
LED lights tend to have a greater proportion of their spectra in the lower wavelength blue region
than HPS lights and there is considerable spectra variation between various LED lights. It is not yet
clear what impact (if any) this spectral shift has on road safety or its other impacts. The lighting
engineer must balance these other impacts against the prime objective of improving safety. This
report looks at how the shift from HPS may impact on safety and other possible unintended
consequences of the change. A table (shown below) was produced which looked at the pros and
cons of moving from HPS lighting to LED with its generally larger proportion of blue light.

 Safety Impact of increased blue light       Environmental impact of increased blue light
 proportion                                  proportion
 Positive            Negative                Positive                 Negative
 Possible visibility Increased               Increased pavement       The light which is reflected
 improvement of      pavement                absorption of light.     from the pavement will still
 objects on the      absorption of light                              contain a larger blue
 road                                                                 component than HPS and
                                                                      will impact on skyglow and
                                                                      wildlife.
 Probable            Increased human         Less energy use
 visibility          lens absorption with
 improvement of      age
 peripheral
 objects (E.g.
 pedestrians near
 the curb.)
 Possible            Increased pupil         No uplight when LEDs
 increased           constriction with       are properly designed-
 vigilance of        age.                    reduces skyglow and
 drivers                                     wild life disturbance
                                             from pavement
                                             reflection.
                     More disability glare
                     Possible reduction
                     in driving accuracy
The safety negatives are all ameliorated by reducing the amount of blue light. The safety positives
all involve greater blue light. However, the evidence for the positives is weaker than that of the
negatives. At the worst the amelioration, by bringing the SPDs of LEDs in line with that of HPS is
unlikely to make the safety impact of LEDs any worse than HPS.
It was concluded that on the balance of probabilities there are safety benefits in reducing the
proportion of blue wavelengths in route lighting. Bringing the SPDs of LEDs in line with those
typical of HPS is unlikely to make the safety impact of LEDs less than that of HPS. There are also
environmental benefits, so this is a win-win policy.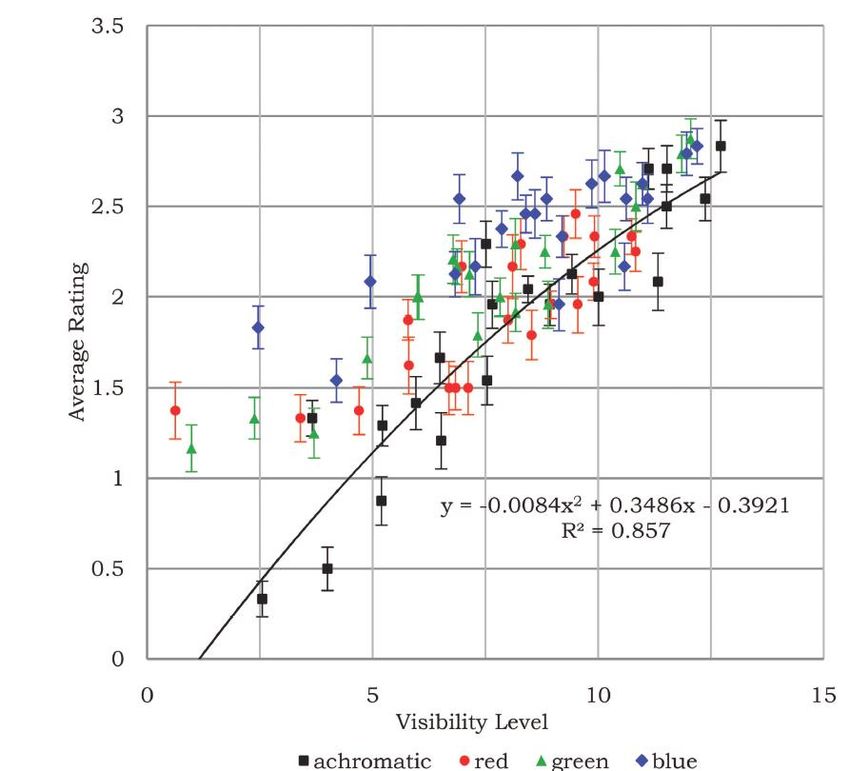
1       Introduction
Route streetlighting’s main objective is to allow drivers to see obstacles on the road. A secondary
objective is to allow them to see objects on the roadside (like pedestrians and vehicles on
driveways) which have the potential to become obstacles on the road. If not carefully controlled
streetlighting also can generate unintended consequences. These can include impacts on
humans, animals, insects and the beauty of the night sky.

It is also a duty of lighting designers to provide the required lighting as efficiently as possible in
terms of electricity usage, The has led to a move over the last fifteen years or so to replace High
Pressure Sodium (HPS) lights with Light Emitting Diode (LED) lights which use far less energy than
the HPS lights and can be relatively easily dimmed or turned up leading to the possibility of
lighting designs with more temporal flexibility.

LED lights tend to have a greater proportion of their spectra in the lower wavelength blue region
than HPS lights and there is considerable spectra variation between various LED lights. It is not yet
clear what impact (if any) this spectral shift has on road safety or its other impacts. The lighting
engineer must balance these other impacts against the prime objective of improving safety.

Correlated Colour Temperature (CCT) is widely used as a rough guide to the proportion of blue
light emitted by a luminaire. Generally, the higher the CCT the greater the proportion of blue light
and the more efficient the LED, although the gap in efficiency between higher CCT LEDs and
lower CCT LEDs is quickly reducing. Also, with modern LED technology it is possible to produce
higher CCT LEDs with relatively low proportions of blue light. A better indicator of the contribution
of various spectra to the light emitted by a- luminaire is the Spectral Power Distribution (SPD) of
the luminaire.

This report looks at how the shift from HPS may impact on safety and other possible unintended
consequences of the change.

2       Safety issues
2.1     Visibility of objects by drivers
As mentioned in the introduction a major objective of road lighting is to improve the visibility of
objects to drivers. Thus, visibility has some face validity as an intermediate outcome measure for
road safety lighting, notwithstanding the fact that directly relating visibility measurements to
safety has proved difficult for researchers (Schreuder et al, 1998, Wood et al, 2018). This paragraph
looks at visibility to drivers of objects both off the road (but near the road) and on the road.
2.1.1     Visibility of off the road objects by drivers

To detect off road objects like pedestrians preparing to cross the road typically requires drivers to
use peripheral vision which is principally provided by the rods. If an object of interest is detected
the driver may also seek greater clarity by central (foveal) vision through head/eye movement.
Therefore, in reality, Information in peripheral vision comes from both rods and cones and so is
influenced by the S/P ratio1 of the luminaire. However, the central foveal portion of the eye
contains only cones so foveal vision is influenced solely by the photopic sensitivity curve, so is not
influenced by the S/P ratio.

1
 The S/P ratio is the ratio of the Scotopic lumens emitted by the luminaire and the photopic
lumens emitted by the luminaire. This is discussed in more detail in section 2.31.
Younis (2012) looked at the impact of HPS, Metal Halide (MH) and LED streetlights on the night-
time visibility of pedestrians to drivers. The pedestrians were simulated by manikins and were in
stationary positions on the footpath at the left side of the road. The subjects were 27 male licensed
drivers between 18 and 28 who had good visual acuity and were not colour blind. The cars were
driven at between 35 and 40 km/hr and kept in the right lane. The drivers were told to focus at the
centre of the road directly ahead. This restriction meant that the experiment dealt purely with
peripheral vision as eye/ head movements were not allowed. The vehicle used was a Mitsubishi
Pajero with xenon-gas discharge (HID) headlamps. The specifications of the lights were given in
table 1.

Table 1: Specifications of lights used in Younis (2012)

The colour temperatures of the LEDs were not given but the supplier appears from its literature to
provide LEDs at a standard 4000K and 3000K, with, 5000K and 5700K as options. 2 The detection
distance was measured in the presence of on-coming car headlamps. Pedestrians wore three
different clothing colours: white, yellow and, black. The pedestrian stood on the left footpath. This
was done because in LHD countries headlights typically project less light to the left side compared
to the right side. The mean detection distances found for the different light sources for pedestrians
wearing different colours of clothing are shown in figure 1.

2

http://www.cooperindustries.com/content/dam/public/lighting/products/documents/mcgraw_edis
on/spec_sheets/mcgraw-vts-ventus-led-td500008en-sss.pdf Viewed 28/5/2017
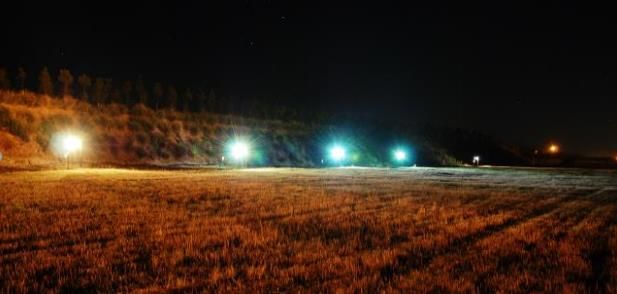
Figure 1: Mean pedestrian detection distances by light source and clothing colour.

Statistically the MH and LED streetlights did not differ in mean detection distance which for both
was significantly larger than for HPS. The white and yellow clothed pedestrians were also
significantly better detected than the black. This indicates that the white light sources assisted
peripheral vision more than the HPS.

2.1.2   Visibility of objects on the road by drivers
It is known that white light such as that from LED or Metal Halide sources is better for peripheral
vision purposes than the yellow light of HPS. The impact on central vision is not so clear. There
have been several attempts to look at this and compare the performance of LED and HPS. A
confounding factor is the presence of car headlights which tend to lessen the impact of the street
lighting regarding visibility of objects on the road. This impact extends up to some 80m from the
car depending on the type of headlamp (Van Bommel, 2015). Some studies are in the presence of
this confounder others have controlled for it or eliminated it by having car headlights off.
Over the years some researchers have used reaction time as a surrogate for visibility. Whiter light
results in improved reaction times using Metal Halide vis-a-vis HPS. (Lewin (2004)). More recent
work involved a team of Chinese researchers, Zhiyong et al, 2011. In a laboratory experiment they
found the following (Figure 2) curves of reaction time and luminance for HPS and LED under
mesopic conditions using simulated on road targets. The horizontal axis depicts the background
brightness in cd/m2 using the increments by which it was varied.

Figure 2: Curve relating reaction time to luminance using HPS and LED
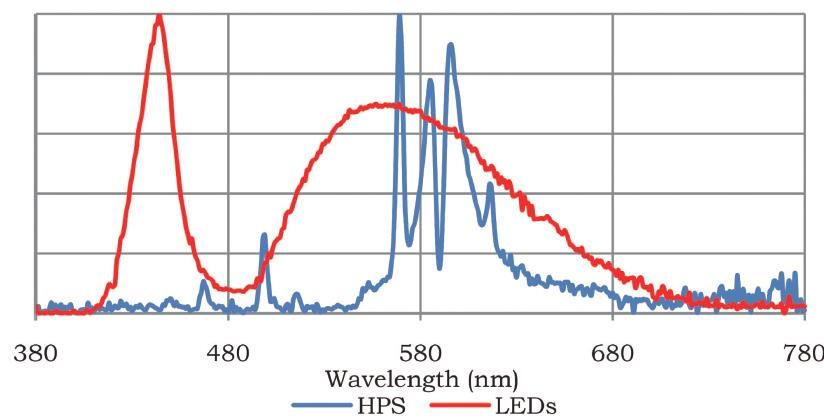
It is obvious from Figure 2 that the LED has lower reaction times throughout the mesopic region
and that the two sources’ reaction times converge as the photopic region is approached. The
colour temperatures of the HPS and LED were not discussed by the researchers.
Fisheng et al (2012) looked at average visibility ratings and small target visibility (STV) using LED
and HPS light sources the spectra of which are shown in figure 3.

Figure 3: Spectra of the HPS and LED light sources used by Fisheng et al.

The HPS Lamps were 2321K while the LEDs were 4810K. The average luminances of the road
surfaces were about 2 cd/m2, which is within the range of mesopic vision. The subjects were eight
university students in their 20s, two females, six males with normal or corrected to normal vision.
The targets were on the road rather than the roadside. They assessed the target’s visibility for each
position and target. Blue, green and red targets plus an achromatic target were used. The subjects’
assessments were plotted against calculated visibility level (VL) and good agreement was found
suggesting the assessments had an acceptable level of validity. The visibility levels were calculated
using the relationship:

from Adrian (1989), where Lt is the luminance of target, Lb is the background luminance and
∆Threshold is the luminance difference needed for minimum visibility between a target and its
background. Figures 4 and 5 illustrate the changes in observer ratings for the HPS and the LED
sources respectively at different calculated visibility levels.

Figure 4: Assessed visibility rating of LED against calculated visibility level
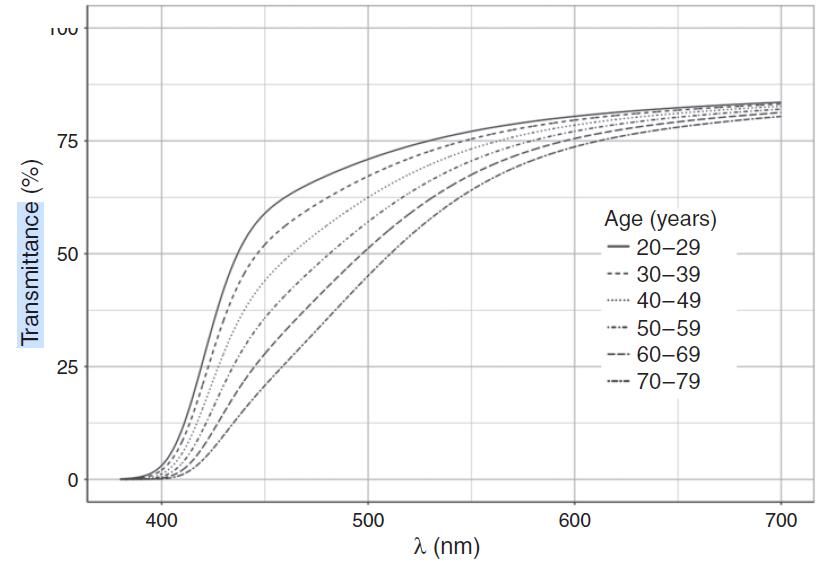
Figure 5: Assessed visibility rating of HPS against calculated visibility level

For both LED and HPS as the visibility level increases, the average rating of visibility also increases.
It is apparent from inspection of the two charts that for any given visibility, the 4810K LED obtains a
higher rating from the subjects than HPS.

   2.1.3    Conclusions

LEDs appear to be superior to HPS for both on road and off road visibility. There is little information
regarding the best colour temperature to use to optimise visibility and there is little direct
information linking visibility measures to crashes.

2.2   . Driver Fatigue

   2.2.1    Discussion
The main possible direct contributors to driver fatigue related to road lighting are disability glare
and discomfort glare. Disability glare is the reduction in visibility caused by intense light sources in
the field of view, while discomfort glare is the sensation of annoyance or even pain induced by
overly bright sources (Rea 2000). Disability glare impairs the vision of objects without necessarily
causing discomfort while discomfort glare causes discomfort without necessarily impairing the
vision of objects (CIE, 2011). However, discomfort glare may impair vision as it can decrease pupil
size and thus limit the amount of light able to reach the retina (Lin et al, 2015). The mechanism by
which glare may induce fatigue is by making the journey less comfortable and as a corollary more
tiring to the driver.
According to Van Bommel (2015), the spectrum of a light source has nil or very little impact on
disability glare. Thus, the SPD of an LED used to replace an HPS source should not be an issue.
However, this is not the case with discomfort glare where research has found that sources with
more blue light are associated with more discomfort glare than sources with less blue light (e.g.
Bullough (2009). Clear guidance as to the differences between lighting with different spectra were
yet to be produced at the 2015 publication date of Van Bommel (2015). However, research is
continuing and Huang et al(2018) conducted a laboratory experiment to investigate discomfort
glare from white LEDs with different SPDs. They found a significant difference in glare perception
between white lights having different CCTs with greater CCT meaning more glare. The CCTs of the
lamps used were 3000K, 400k, 5000K 6000K and 7000k. They also looked at a number of
7000K LEDs of different SPDs and found that the SPD differences between the 7000K LEDS did
not produce significant discomfort glare differences.
In addition, variation of glare along a route can exacerbate discomfort and is called “pulsating
glare”. There are possibilities of restricting this type of glare using LED luminaires which are not
available using HPS (Van Bommel, 2015). This is an ongoing area of research (e.g. Zhu et al, 2013).
There is also the possibility that LED luminaires with more blue light may assist in keeping drivers
awake by suppression of melatonin production. However, at the illuminance levels of street
lighting a driver would need to drive under these conditions for a considerable time (Rea e t al,
2012) to be impacted to any useful degree. Work on how often this would happen in practice has
not been carried out but unusual congestion conditions at the evening peak in mid-winter may
intuitively be the most likely scenario.
Very recently, Bhagavathula et al, 2021 l carried out experimental work aimed at determining the
impact of LEDs as an indicator of driver alertness and sleep health. Sleep health was measured
using saliva melatonin testing. Driver alertness was measured using driver detection and colour
recognition distances, the percentage of time a driver’s eyelids are closed over three minutes,
standard deviation in lane position and the Karolinska Sleepiness Scale (KSS). The study used 10
healthy participants between 18 and 30 years with steady sleep-wake cycles. The luminaire CCTs
and lighting conditions used are as laid out in table 2. The exposure time for saliva melatonin was
1 am to 3 am and five saliva samples were collected at 30-minute intervals.

 Luminaire CCT                                      Lighting conditions
 2100 K HPS                                          High (1.5 cd/m2)
 4000 K LED                                           High (1.5 cd/m2)
 4000 K LED                                           Medium (1.0 cd/m2)
 4000 K LED                                          Low (0.7 cd/m2)
 No luminaire                                        (less than 0.05 cd/m2)

Table 2: Luminaire CCT and lighting conditions

The study results indicated that:

   •   LED roadway lighting at light levels up to a luminance of 1.5cd/m2 does not significantly
       suppress saliva melatonin between 1:00 am to 3:00 am in healthy drivers.

   •   The impact of LED lighting on salivary melatonin suppression was not significantly
       different from HPS at similar lighting levels (1.5 cd/m2) or from no lighting.

   •   No statistically significant differences between any of the roadway lighting conditions for
       detection distance and colour recognition distance.

   •   An increase in exposure time to HPS lighting resulted in a statistically significant
       decrease in detection and colour recognition distances. No such differences ensued for
       LED or the no roadway lighting conditions.

   •   No significant differences between the HPS, LED, and no lighting
       conditions as measured by the KSS.

These findings indicate that up to 1.5 cd/m2 neither LED lighting nor its spectral content or
intensity impacts drivers’ saliva melatonin or alertness between 1:00 am to 3:00 am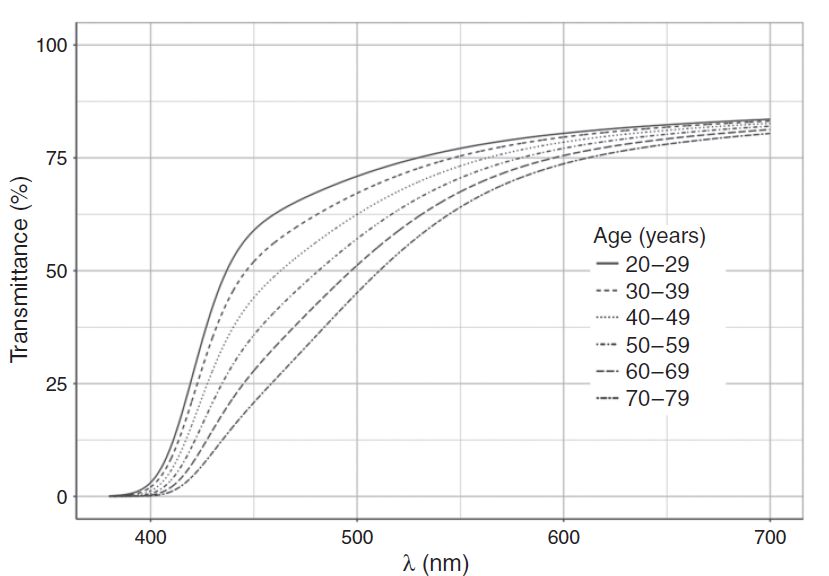
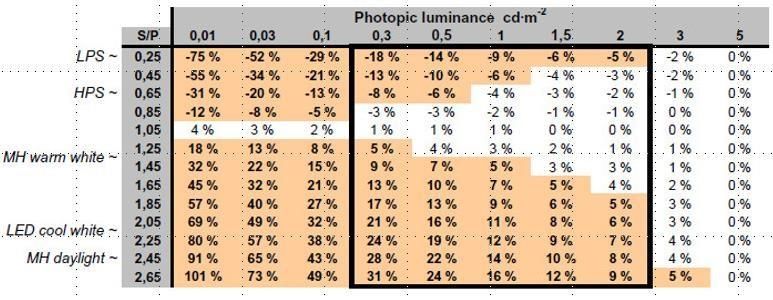
There have been moves to decrease driver fatigue by providing in vehicle cabin blue light.
However, this has been provided at much higher intensities than streetlighting and has had mixed
results when looked at scientifically. Rodriguez-Morilla et al (2018) looked at the impact of extra
blue light (467 lux) on morning drivers who have trouble staying alert in the morning. They found
that the extra blue light improved alertness as measured by reaction time but also decreased
simulated lane keeping performance and had no impact on results of a sleepiness assessment.

   2.2.2    Conclusion
Other things being equal driver fatigue would be lower where there is less blue light by reason of
generally lower glare. In the opposite direction is equivocal evidence of a possible small positive
impact of blue light on driver alertness due to suppression of melatonin production but this may
also be associated with unwanted results in the area of driving accuracy.

2.3   The impact of driver age and pavement absorption

   2.3.1    The performance of LEDs under mesopic conditions
Road lights operate under mesopic conditions. According to Lewin et al, 2003 at around 3
cd/m2 the dominant light receptors in the retina are the "cones" which are most sensitive to
yellow light. These levels are referred to as "photopic." As lighting levels reduce below 3 cd/m2
the cones progressively lose their dominance and the rods become more important. At
extremely low light levels like starlight only the rods are active, and the levels are called
"scotopic." Road lighting is almost always in the range 0.1 to 2 cd/m2, and in that range both
rods and cones are active. This middle range is called “mesopic” Traditionally, the lumen value
of lighting has been calculated only under photopic conditions. This is obviously going to be
inaccurate to some degree under mesopic conditions. The CIE traditionally has used the
sensitivity of the retinal cones by wavelength (V (λ) curve to define the lumen value of lighting
required, ignoring the sensitivity of the retinal rods by wavelength (V’ (λ) Curve). This has recently
changed with the CIE now recommending a linear combination of the two (CIE, 2010).
 The ratio of the luminous output evaluated according to the scotopic V’ (λ) to the luminous
output evaluated according to the photopic V (λ) is required to make mesopic photometry
possible. This ratio is called the S/P ratio. It is a scaling factor to reduce or boost photometry made
under photopic assumptions to align with the mesopic conditions that apply in the case of road
lighting. The CIE has published a table which relates the differences in effective luminance at
various lighting levels between using photopic photometry and mesopic photometry. This, as
reported in Puolakka and Halonen, 2010 is shown in table 3

Table 3: percentage differences between mesopic and photopic luminances calculated
according to CIE system for a range of S/P ratios
The range of normal road lighting levels are shown within the rectangle with a black border
and the background coloured for differences 5% or greater. For our purposes it is worthwhile to
concentrate only on HPS and LED. It can be seen that using mesopic photometry changes little
for HPS in the road lighting range. LED white light is well suited to Category P level lighting (0.1
and 0.3 cd/m2) and as can be seen in Table 3, provides boosts of around 30% above the
calculated photopic values .This might imply reduced lumens may be considered for
pedestrian lighting. Note that the British standard does not extend the use of S/P ratios into
traffic route lighting (Category V lighting in NZ). As the British Road lighting standard remarks
(BSI, 2013 page 53) for traffic route lighting there is insufficient evidence to specify the
situations in which the trade-off between light level and S/P can safely be applied. These
impacts can be counterbalanced by other factors; in particular:
      •   The wavelength related absorption properties of the human eye’s lens as it ages
      •   The wavelength related narrowing of the pupil with age
      •   The wavelength related absorption properties of road surfaces.

 In all three cases the absorption is biased towards lower wavelength blue light, which provide
more of the lumen output of LEDs than HPS. This means that the light which reaches the retina
will have a different S/P ratio from that leaving the luminaire and will also contain fewer lumens
than the light leaving the luminaire as some of the lumens will have been absorbed by the
pavement and the eye’s lens. This impact will be greater for LED than HPS lighting and will
increase the percentage of blue light in an LED luminaire’s spectrum as it reaches the retina.

     2.3.2    The wavelength related absorption properties of the human eye’s lens as it ages

 The studies leading to the CIE adjustment factors in table 3 mainly used subjects in the 20-35
age range (Van Bommel, 2015). Preciado and Manzano (2018) provide more detail on the
subjects used. The lens of the human eye yellows with age meaning that blue light is absorbed
in the lens. This lessens the mesopic impact of blue-rich light for older drivers compared to that
shown in table 3. The process is underway by the time an individual reaches age 20. This
phenomenon is well documented in the medical literature from study of the lenses of live
people in situ, lenses removed by medical procedures and lenses removed post-mortem. Said
and Weale, 1959 studied the lenses in situ of British subjects from 4 to 63 years of age. Figure 6
showing a family of curves of optical density against wavelength for various ages3.

3
    The crosses represent earlier data collected by Weale (1954)
Figure 6: Lens optical density of people of various ages by wavelength of light This shows a well-defined increase in optical density with age at lower wavelengths. There is very little age related change at higher wave lengths. Brainard et al. (1997) looked at post-mortem lenses of 5 new borns, 36 20 to 29 year olds and 40 60-69 year olds. They found that at 450 nm the transmittance of the lens of 60-69 year olds is half that of 20-29 year old adults; at 425 nm it is one third. At 555 nm only a few percentage points are lost while it is equal at 600 nm and above. In all cases the new born lens transmittance is greater than the others. This was shown in figure 7. Figure 7: Light transmittance of post-mortem lenses by wavelength for new borns, and people aged 20-29 and 60-69 After a literature review of studies broadly similar to the above Van de Kraats and Van Norren (2007) found that after the age of 20 lenses increasingly absorb light with the absorption increasing with the square of the person’s age. They suggest that studies on vision should use a variety of subjects of different ages, to allow for the increasing population of older drivers. This literature has been augmented by several studies since then. After a literature review the CIE (CIE 203:2012) published values for transmittance of the human lens by wavelengths from 380nm to 780nm for various age brackets. These values have been processed into a set of curves by
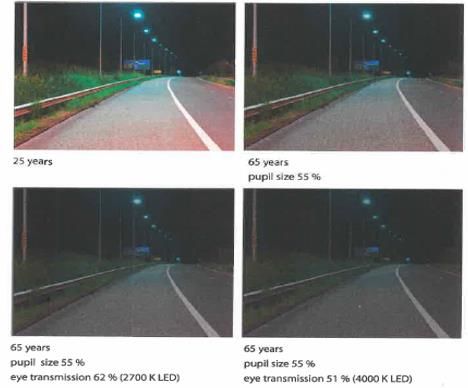
Preciado and Manzano (2018) as shown in figure 8. The curves represent the spectral transmission
of people aged in the middle of the decade depicted. Preciado and Manzano (2018) point out that
these curves indicate that at 500nm the transmittance of a human eye at 60–69 years is 25% less
than the transmittance of an eye at 20–29 years and 48% less at 450nm. These results are similar
to those of Brainard et al (1997).

Figure 8: Spectral transmittance of human lens at different ages.
It is apparent, as Preciado and Manzano (2018) point out, that:
transmittance decreases considerably with ageing, especially between 400nm and 550nm
This means that a migration toward bluer lamps, such as LEDs with a more blue -biased spectral
power distribution (SPD), will exacerbate the difference in vision performance between younger
and older drivers. Figure 3 from Van Bommel (2015) illustrates the changes in the lens as it ages.

Figure 9: Illustration of changes in the human eye lens through ageing (Van Bommel (2015)
Figure 10, also from Van Bommel, 2015 goes a step further to illustrate the impact of age under
2700K LED and 4000K LED lights. The top left photograph simulates what a 25 year old would see
under LED lighting. The top right simulates what a 65 year old with pupil size reduced to 55% of
the 25 year old’s pupil would see. The bottom left shows what that 65 year old would see under
2700K LEDs and the bottom right what the 65 year old would see under 4000K LEDs.
Figure 10: The impact of observer age under 2700K and 4000K road lights

Table 4 also from Van Bommel (2015) quantifies the above for a 2700 LED and a 4000K LED
comparing light transmission of a 25 year old with that of 50 and 60 year olds.

               Transmission relative to 25 year old (%)

    Age        Warm-white LED 2700 K S/P ratio: 1.28          Cool-white LED 4000 K S/P ratio: 1.47

 50          66                                         55
 65          62                                         51
Table 4: Transmission of warm-white and cool-white LED light through the eye lenses of 50 and
65 year old people relative to that of a 25 year old.

Table 4 shows that on average older people will receive more benefit per lumen from a typical 4
2700K LED than from a typical 4000K LED. This is related to the bluer spectrum of the 4000K
LED. To illustrate, from table 3 a 50 year old will receive 45% less light to the retina per lumen from
a 4000K LED than a 25 year old and for a 2700K led the loss will be 34%. Preciado and Manzano
(2018) went further by plotting the lens transmittance of various age groups against a baseline of
20 -29 year olds (figure 11). This shows the relatively low transmission of the lower wavelengths of
the blue light by all age groups particularly those who are older.

4
    At the time of writing of Van Bommel (2015)
Figure 11: Human lens transmittance by age-group and wave-length According to Preciado and Manzano (2018) the CIE derived its V (λ) curve used data from 52 subjects mostly younger people numbering 20 (20–29 years), 21 (30–39 years), 9 (40–49 years) and 2 (50–59 years). Sixty plus were absent. Between 2011 and 2014 inclusive, 60+ contributed 18% of New Zealand’s vehicle kilometres of travel. The reference range in figure 11 was 20-29 (mid-point 25) because Sagawa and Takahashi after measuring spectral luminous efficiency functions for 91 subjects of aged from 11 to 78 years, found that the function for age 25 years fitted best to the CIE V (λ) curve. Thus, the V (λ). curve may have differed if it had used a wider age range of subjects. 2.3.3 The wavelength related narrowing of the pupil with age The pupil of the eye narrows with age owing to weakening of the small muscles which serve to keep it open. Its changes with age are illustrated in figure 12 from Birren et al (1950). Figure 12: Mean pupil diameter (mm.) by decades of age. The upper curve relates to pupil size in the dark with the lower relating to pupil size in one lumen of brightness. The lines are least squares regressions and the vertical lines represent ± one standard deviation. This narrowing reduces the amount of light reaching the lens and thus the amount reaching the retina. The pupil size varies with the wavelength of incident light. . Daneault et al, 2012 looked at pupil constriction in 16 young (22.8 ± 4 years) and 14 older (61 ± 4.4 years) subjects with 45s exposures to blue (480 nm) and green (550 nm) monochromatic lights at low, medium, and high irradiance levels. Steady-state pupil constriction was greater under blue than green light in both age groups and increased with increasing irradiance.
2.3.4   The wavelength related absorption properties of road surfaces.
Blue light is absorbed preferentially by road surfaces both asphalt, chip seal and concrete and this
will result in less luminance for a given amount of illuminance. In pedestrian lighting the main
objective is to illuminate objects directly so loss during reflectance from the surface is not of
importance. However, for route lighting this loss will be more important as the prime purpose of
route lighting is to provide guidance to drivers through light reflected off the road surface. Falchi et
al, 2011, estimated that depending on the surface and for an equal lumen package, white LEDs will
produce 6-11% less luminance than HPS. Figure 13 from Falchi et al shows the variation in
absorption by wavelength of four surfaces, three asphalt and one concrete.

Figure 13: Spectral reflectance of four surfaces from Falchi et al, 2016 5.
Figure 14 (Van Bommel, 2015) shows the relative surface luminance for one of the asphalts in figure
13 under various light sources relative to HPS. it is apparent that 2800K LED and 4000k LED differ
little from each other and are only about 5% lower than HPS, so the difference from HPS is
relatively small for that particular surface.

Figure 14: Surface luminance for an asphalt surface and various light sources relative to HPS.

5
 Data from NASA/Jet Propulsion Laboratory ASTER Library (Baldridge et al., 2009) and Portland
Cement Association (Adrian and Jobanputra, 2005).
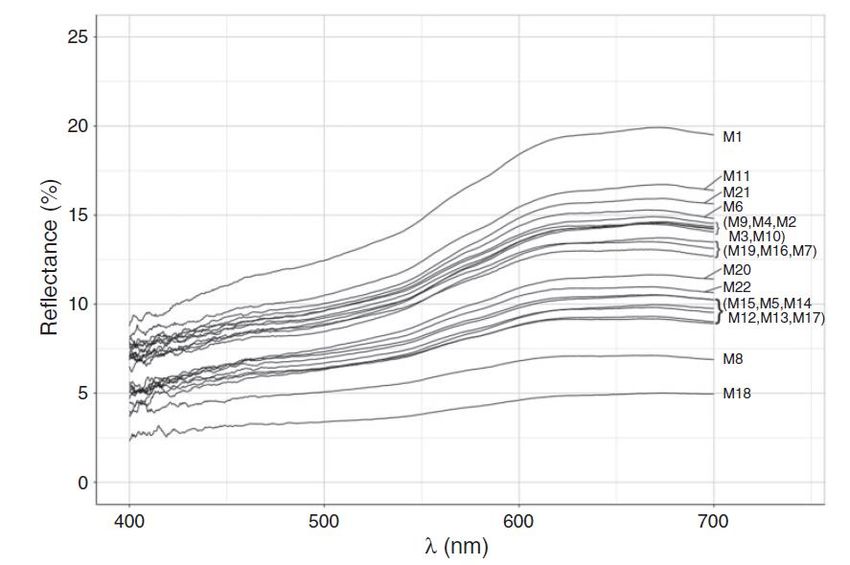
Preciado and Manzano (2018) looked at 22 surfaces compared to the 4 of Falchi et al, 2016. Their
reflectances are plotted against wavelength in figure 15.

Figure 15: Spectral reflectances of 22 road surface samples from Preciado and Manzano (2018)

It is apparent that all samples reflect more light as wavelength increases. The samples were all
asphaltic concrete. Chip seal, a more common pavement in New Zealand, is more reflective than
asphaltic concrete as indicated in figure 16 from Herold (2004)6. However, at the blue end of the
spectrum it is still only around 15% reflective compared to around 20% at 700nm.

Figure 16: Spectral effects of different road surface treatments from the ASD ground spectral
measurements

Spectrum D is a road surface described in the paper as a “normal road surface”.

6
 Ground spectra were acquired with an Analytical Spectral Devices (ASD) Full Range (FR)
spectrometer.
Herold (2004) also looked at the reflectivity of white and yellow road marking paint compared
with a “normal” road surface (figure 17).

Figure 17: Spectral characteristics of street paint in different colours versus asphalt pavement
from the ASD ground spectral measurements
This indicates that yellow paint is less reflective than a normal pavement in the blue wavelengths.
This means that drivers on highways with blue rich LED lighting may find no overtaking lines
harder to see than with the previous HPS.

2.4   Combined impact of pavement and lens absorption in mesopic conditions
Roads are lit under mesopic conditions, so it is appropriate to look at mesopic impacts rather than
photopic or Scotopic impacts. Table 5 from Preciado and Manzano (2018) illustrates the
percentage differences between photopic and mesopic illuminance between Metal Halide (MH),
LED and HPS with HPS as the reference point.

Table 5: Percentage differences of photopic illuminance between white light sources and HPS,
having HPS as a reference
The table is structured cumulatively downward with part b illustrating the impact on mesopic
vision of the road surface and part c including the road surface impact and the eye transmittance
impact of 4o year old eyes. Similarly, part d shows the combined impact of the road surface and
60 year old eyes compared with the sample of people used by CIE to derive part a of the table.
This shows that at higher values of mesopic luminance around 0.9 CD/m2 more light is necessary
from the LED in order to gain the same impact on the retina as an HPS source, for both 40 year
olds and 60 year olds7. This will be more so for older people such as 70+ people. According to
Ministry of Transport Travel Survey results8 drivers 70+ travelled on average 1.7 billion kilometres per
year in the 4 year period 2011-.2014 out of a total of 30.4 billion.

3 Environmental issues
These relate to the greater presence of blue light in LEDs than in HPS.

3.1   Wildlife
Wildlife is sensitive to light. As an example, birds may have their flight paths disturbed by light. This
can have fatal consequences. For instance, they may be misled into landing at places from which
they are unable to take off. Broadly similar problems occur to flying insects and bats.
The major impact on wildlife is in the total quantity of light to which they are exposed. Birds, and
other wildlife, also vary in their sensitivity to the wavelength of light. However, overall, their
sensitivity is predominantly towards the blue end of the spectrum. This is a secondary impact
compared to the impact of the total quantum of light on them and it is generally recommended
that the total quantum be minimised before the spectrum of the light is adjusted. This sensitivity
also varies with the species and type of wildlife. Therefore, spectral adjustment may be more
effective in some cases than in others. Streetlights contribute to artificial light at night (ALAN) and
thus contribute to any disruption. These considerations feed into the choice of the spectra and
light output of streetlighting LEDs where deployed in areas where their impact on wildlife may be
important.

Figure18: Ability to perceive different wavelengths of light in humans and wildlife. © Pendoley
Environmental, adapted from Campos (2017).

7
  These figures may require some discounting when applied to present day LEDS, which may have
lower S/P ratios than the 2.41 quoted in the table, implying lower proportions of blue light.
8
  https://www.transport.govt.nz//assets/Uploads/Report/Drivers-Travel-Survey-2015.pdf
Figure18 compares the ability to perceive different wavelengths of light in humans and wildlife.
The common sensitivity to ultraviolet, violet, and blue light across all wildlife Is notable. Streetlights
potentially have their main impact on birds, insects and bats. Examples are interference with
moths’ ability to avoid predatory bats (LEDs) and the UV radiation from HPS which causes ‘flight-
to-light’ and high mortality (Wakefield et al, 2015). Rowse et al, 2016 found that a switch from low-
pressure sodium (LPS) to LED streetlights in southern England did not affect the activity of bat
species typically found near streetlights. Eisenbeis and Eick, 2011 also found that HPS was more
attractive to insects than LED, but with many caveats. Pawson and Bader (2014) found in rural
Hawkes Bay LED lamps at the forest’s edge attracted 48% more flying insects on average than HPS
lamps. They found little difference in insect attraction between “off-the-shelf” LEDs with colour
temperatures between2700 K and 6500 K. The lights used were described as “industrial scale”
lights, not streetlights and their lumen output was not mentioned in the article. Figure 19 depicts
some of the industrial LED lights used in their forest edge context.

Figure 19:Industrial Scale Lights used by Pawson and Bader (2014)

One concern is urban impacts. In an urban study (MacNaughton et al, 2021). the authors
monitored the timing of dawn and dusk bird song; frequency of owl vocalisations; avian diversity,
relative abundance and community composition; small invasive mammal and ground insect
activity; and invertebrate relative abundance at 26 residential properties on low volume roads in
Auckland. The monitoring happened both in backyards and on the street. These roads were
presumably lit with pedestrian standard lighting. The monitoring was done over an 18 months
period coinciding with a change from HPS to 4000k LED streetlights. The study observed the
following changes over the period:
   •   Initiation time of dawn song was advanced or delayed for two bird species and backyard
       avian community composition was altered.
   •   Avian species richness, relative abundances of three bird species and ground insect activity
       increased.
No other effects were detected. The authors concluded that direct consequences in the study
setting were small and might be mitigated by changes such as dimming.
3.1.1 Seabirds
A specific concern in New Zealand is rural impacts particularly those of rural settlements close to
the sea, where the fledging behaviour of seabirds, like petrels may be affected. According to Lukies
et al(2019) petrels and shearwaters are disproportionately attracted to ALAN.
Fledgling petrels and shearwaters are particularly vulnerable to land-based artificial lighting on
their maiden flight.
The impact of the lighting may make them land prematurely on roads etc and not be able to take
off. Unless rescued by human intervention they are vulnerable to traffic, predators etc. As a general
rule adult birds differ from fledglings in that they are not attracted to light from a distance, with
adult birds only becoming disorientated if flying directly past the source (Imber, 1975). However, for
storm petrels the adults are the most vulnerable to light induced groundings.
Seabirds see within the violet-blue spectrum (380nm – 440nm) Nocturnal seabirds have special
adaptations that allow them to see in low light levels. This adaption to low light levels makes
seabirds sensitive to short wavelength blue light. Therefore, the shift from HPS streetlighting from
HPS to LED may adversely affect some seabirds, if the impact of the LED lighting is enough to
make an appreciable difference to the total lighting including other forms of lighting.
Two New Zealand sites where there have been concerns have been state highways at Kaikōura
and Punakaiki. In a trial at Punakaiki Waka Kotahi NZ Transport Agency turned off streetlights on
Sunday, 8 November 2020 and turned them back on in the New Year, RNZ reports9 indicated that
DOC had counted 10 crash landed birds over that period this year compared with 15 -25, which
was considered the “usual” number.
Given their sensitivity to blue light , an obvious way to reduce the harm from grounding is to
reduce the amount of blue light emitted from the lighting.
This can be done in three ways:
• Reduce the total lumens from the lights (i.e. dimming )
• Reduce the blue light content
• A combination of both
How this squares with safety concerns will depend on the optimal amount of lighting for safety
and the impact of blue light on safety.
3.2 Dimming, safety, and the environment
It is obvious that one method of reducing environmental impact of lighting, either on wildlife,
particularly birdlife , is to reduce the amount of light emitted. This should be considered along
with its possible safety impact. An example of its impact on safety is in Jackett and Frith (2013}
where for urban areas, a dose response curve of luminance vis safety was derived (figure 20).
9
https://www.rnz.co.nz/news/national/433509/crashing-petrels-moving-south-as-lights-dimmed-
in-punakaikiFigure 20: Relationship between urban luminance and safety (Jackett & Frith 2015) Frith et al (2015) used this curve to study the benefits and costs of adaptive lighting. In the same urban context of Jackett and Frith (2013), Wood et al (2018) investigated the effect of streetlight dimming on night-time driving performance of 14 licensed drivers ages 27-40yrs. They drove an instrumented vehicle around a closed circuit at night. Six 4000K LED streetlights were positioned along a 250 m, straight section and their light output varied between laps. The dimming levels used were 25%, 50%, 75% and 100% of maximum output. At 100% the average road surface luminance was 1.14 cd/m2. The participants were given tasks involving recognition distances and reaction times to a low contrast, moving target and a pedestrian walking at the roadside. Participants drove at an average speed of 55km/hr. The dimming delayed reaction times to the moving target significantly and resulted in significantly shorter pedestrian recognition distances. The changes increased with increased dimming. The authors concluded that the data suggests that streetlight dimming impacts on driver visibility, but it was unclear how these differences impacted on safety. Lighting mainly impacts multi-vehicle crashes and pedestrian crashes. There is little point in lighting where there are no pedestrians and traffic volumes are such that the probability of vehicles coming into contact with each other is very low (Frith & Lester, 2021). In these cases environmental gains are possible without reducing safety by dimming or turning off road lighting. 3.3 Sky glow Light, particularly bluer light is not conducive to astronomy or indeed simple enjoyment of the night sky (Van Bommel 2015). Street lighting undoubtedly contributes to this impact but its contribution to total sky glow is not well established and will differ from locality to locality as will the totality of the sky glow to which it contributes. Street lighting is only one of many sources of exterior light at night. Other sources include interior light escaping through exterior windows, architectural and landscape lighting, signage, parking lots and garages, recreational lighting and vehicle lighting4. The 3 main luminaire characteristics influencing sky glow are spectral power distribution (SPD), total lumen output, and the amount of uplight (Kinsey et al, 2017). In particular, properly designed LED street lighting should produce no direct uplight meaning that the uplight will all come from reflection from the road’s surface. The amount of reflection is discussed in section 2.3.4 but is a relatively small fraction of the light emitted from the luminaire, depending on the particular surface being discussed. Jackett and Frith 2021) found the relation between S/P ratio and skyglow from route lighting streetlights shown in figure 21.
Figure 21: Relationship between skyglow and S/P ratio

This shows that within the range of the sample used mesopic skyglow increases linearly with S/P
ratio. As shown earlier, increased S/P ratio is also related to more absorption by pavements and
within the eye prior to reaching the retina. Thus, there are synergies between the S/P ratios
favourable to skyglow and the S/P ratios favourable to letting more reflected light reach the retinas
of older people.
There is a broadly similar synergy between pavement absorption and disturbance to birds. With
well set up LEDs the only uplight is that reflected from the pavement. However, some light will be
absorbed by the pavement rather than reflected and this absorption will be greater where the
blue light proportion of the light emitted is lower.

4 Consequences of a switch from HPS to LED
Table 6 refers to lighting which is installed according to prescribed procedures. It looks at the pros
and cons of moving from HPS lighting to LED with its generally larger proportion of blue light.

 Safety Impact of increased blue light           Environmental impact of increased blue light
 proportion                                      proportion
 Positive               Negative                 Positive                  Negative
 Possible visibility    Increased pavement       Increased pavement        The light which is
 improvement of         absorption of light      absorption of light-      reflected from the
 objects on the road                             reduces skyglow and       pavement will still
                                                 wildlife disturbance from contain a larger blue
                                                 pavement reflection.      component than HPS
                                                                           and will impact on
                                                                           skyglow and wildlife.
 Probable visibility     Increased human         Less energy use
 improvement of          lens absorption with
 peripheral objects      age
 (E.g. pedestrians
 near the curb.)
 Possible increased      Increased pupil         No uplight when LEDs
 vigilance of drivers    constriction with       are properly designed-
                         age.                    reduces skyglow and
                                                 wildlife disturbance from
                                                 pavement reflection.
                        More disability glare
                        Possible driving
                        accuracy reduction
Table 6: The pros and cons of moving from HPS route lighting to LED
The safety negatives are all ameliorated by reducing the amount of blue light. The safety positives
all involve greater blue light, however, the evidence for the positives is weaker than that of the
negatives. At the worst the amelioration, by bringing the CCT of LEDS in line with that of HPS is
unlikely to make the safety impact of LEDs any worse than HPS.
Recent work related to the installation of 4000K LED lighting on SH22 (Frith and Lester, 2021)
suggests that the lighting has been associated with improved safety. This, however, does not
answer the question as to whether, and in what circumstances there is a safety increment over
HPS.
5 Conclusions.
• It would appear that on the balance of probabilities there are safety benefits in reducing
the proportion of blue wavelengths in route lighting.
• Bringing the SPDs of LEDs in line with those typical of HPS is unlikely to make the safety
impact of LEDs less than that of HPS.
• There are also environmental benefits, so this is a win-win policy.References Adrian W. K. (1989). Visibility of targets: model for calculation. Light Res Technol. 21(4):181–188. Baldridge, A.M., Hook, S.J., Grove, C.I., Rivera G. (2009) The ASTER Spectral Library Version 2.0. Remote Sensing of Environment, Vol 113, pp. 711-715. Birren, James E . Casperson, Roland C and Botwinick, Jack (1950) Age Changes In Pupil Size Journal of Gerontology, Volume 5, Issue 3, July 1950, Pages 216– 221, https://doi.org/10.1093/geronj/5.3.216 Bhagavathula, R., R. Gibbons, J. Hanifin, and G. Brainard. 2021. LED Roadway Lighting: Impact on Driver Sleep Health and Alertness. Pre-publication draft of NCHRP Research Report 968. Transportation Research Board, Washington, D.C. Bullough JD. 2009. Spectral sensitivity for extrafoveal discomfort glare. Journal of Modern Optics 56(13): 1518-1522 Rukmini, A. V. Milea, Da, Aung, Tin &.Gooley, Joshua J Pupillary responses to short wavelength light are preserved in aging A Nature,ScieNtific Reports | 7:43832 | DOI: 10.1038/srep43832 CIE 115:2010 (2010) Lighting of Roads for Motor and Pedestrian CIE CIE (2011) International Lighting Vocabulary. Vienna, Austria: International Commission on Illumination; 2011:203. CIE (2014) Publication 206:2014 The effect of spectral power distribution on lighting for urban and pedestrian areas. Eisenbeis, Gerhard und Eick, Klaus (2011) Studie zur Anziehung nachtaktiver Insekten an die Straßenbeleuchtung unter Einbeziehung von LEDs Natur und Landschaft 86 (2011): 07 In German https://www.kohlhammer.de/wms/instances/KOB/appDE/Natur-und-Landschaft-fuer-freies- Einkaufen/Studie-zur-Anziehung-nachtaktiver-Insekten-an-die-Strassenbeleuchtung-unter- Einbeziehung-von-LEDs/ Viewed 11/6/2017 Ekrias, Aleksanteri, Eloholma, Marjukka and Halonen, Liisa (2009) The effects of colour contrast and pavement Aggregate type on road lighting performance Light & Engineering Vol. 17, No. 3, pp. 76- 91, 2009 No. 3, 2009, pp. 42-53 Frith, W, M Jackett and J Chisnall (2015) The benefits and costs associated with urban road lighting in New Zealand. Presented at IPENZ Transportation Group Conference. Christchurch, 22–24 March 2015. Frith, Bill and Lester, Tiffany (2021) The safety impact of lighting a previously unlit section of SH22 with LED Luminaires Paper Presented at the NZTA/NZIHT Conference May 2021 Napier Fusheng, Li, Yuming, Chen, Yang, Liu & Dahua, Chen (2012) Comparative in Situ Study of LEDs and HPS in Road Lighting LEUKOS Vol. 8, Issue 3, 2012
Herold, Martin (2004) Understanding spectral characteristics of asphalt roads http://www.geo-
informatie.nl/Projects/Santa_Barbara_Urban_Spectral_Library/urbanspec/understanding_asphaltsp
ectra_web.pdf

Jackett, M. and Frith, W. (2013) Quantifying the impact of road lighting on road safety – A New
Zealand study. IATSS Research (International Association of Traffic and Safety Sciences), 36, 139–
145. 2.

.Jackett, M. and Frith, B. (2021) An investigation of the quality of indexes used to estimate the sky
glow from LED road lighting luminaires Report prepared for Waka Kotahi NZTA

Jin, Huaizhou, Jin, Shangzhong, Chen, Liang, Cen, Songyuan and Yuan, Kun (2015) Research on
the Lighting Performance of LED Street Lights With Different Color Temperatures IEEE Photonics
Journal Volume 7, Number 6

Lewin, Ian, Box, Paul and Stark, Richard E (2003) Roadway Lighting: An Investigation and
Evaluation of Three Different Light Sources Final Report 522 Prepared for Arizona Department of
Transportation

:Lin Y, Fotios S, Wei M, Liu Y, Guo W, Sun Y .(2015) Eye movement and pupil size constriction under
discomfort glare. Invest Ophthalmol Vis Sci. 2015;56:1649–1656. DOI:10.1167/ iovs.14-15963
.
Rea MS (editor). 2000. IESNA Lighting Handbook Reference and Application 9th edition New York
illuminating Engineering Society

Rodríguez-Morilla, Beatriz, Madrid, Juan A. Molina, Enrique, Pérez-Navarro, José and Correa1,
Ángel (2018) Blue-Enriched Light Enhances Alertness but Impairs Accurate Performance in
Evening Chronotypes Driving in the Morning Front.
Psychol., https://doi.org/10.3389/fpsyg.2018.00688

Schreuder, DA, J Kosterman and A Morris (1998) Road lighting for safety. London: Thomas Telford.
.
Van de Kraats, Jan and Van Norren, Dirk (2007), Dirk Optical density of the aging human ocular
media in the visible and the UV Journal of the Optical Society of America A 24 1842-1857

Wood, Joanne M. Isoard, Gillian, Black, Alex Cowling, Ian (2018) Night-time driving visibility
associated with LED streetlight dimming Accident Analysis and Prevention 121 (2018) 295–300

Younis, Dana (2013), "Comparative Pedestrian Visibility under Solid State Led Sources" (2013).Theses.
Paper 297United Arab Emirates University
http://scholarworks.uaeu.ac.ae/cgi/viewcontent.cgi?article=1299&context=all_theses

Zhiyong , Zhang, Yong, Yang and Lei, Wang (2011) A novel reaction time measurement under
road artificial illumination Proceedings of the Third International Conference on Transportation
Engineering, Chengdu, China, http://ascelibrary.org/doi/pdf/10.1061/41184%28419%29541 Accessed
17/5/2017

Zhu, X., Deng, S., Zhang, M., Cheng, W., & Heynderickx, I. E. J. (2013). Perception study of discomfort
glare from LED road lighting. Light and Engineering, 21(2), 61-68.
You can also read