The same chemical state of carbon gives rise to two peaks in X ray photoelectron spectroscopy
←
→
Page content transcription
If your browser does not render page correctly, please read the page content below
www.nature.com/scientificreports
OPEN The same chemical state of carbon
gives rise to two peaks in X‑ray
photoelectron spectroscopy
G. Greczynski* & L. Hultman
Chemical state analysis in X-ray photoelectron spectroscopy (XPS) relies on assigning well-
defined binding energy values to core level electrons originating from atoms in particular bonding
configurations. Here, we present direct evidence for the violation of this paradigm. It is shown that
the C 1s peak due to C–C/C–H bonded atoms from adventitious carbon (AdC) layers accumulating on
Al and Au foils splits into two distinctly different contributions, as a result of vacuum level alignment
at the AdC/foil interface. The phenomenon is observed while simultaneously recording the spectrum
from two metal foils in electric contact with each other. This finding exposes fundamental problems
with the reliability of reported XPS data as C 1s peak of AdC is routinely used for binding energy scale
referencing. The use of adventitious carbon in XPS should thus be discontinued as it leads to nonsense
results. Consequently, ISO and ASTM charge referencing guides need to be rewritten.
With more than 12,000 papers published annually, the value of XPS in materials science can hardly be
overestimated1. The tremendous growth of the XPS technique is driven by the possibility of chemical state
identification2,3, enabled nearly 60 years ago by the first observation of S 2p peak splitting in the XPS spectrum
of sodium thiosulfate4, caused by the fact that S atoms in Na2S2O3 are present in two distinctly different chemical
environments. However, significant fraction of these numerous XPS papers contains data that have been wrongly
interpreted due to the lack of skills, experience, or knowledge5, but also because an improper referencing method
was employed6.
The chemical state identification is conventionally done by comparing the extracted binding energy (BE)
values to compound reference data bases such as the NIST X PS7. For the latter to be reliable, the spectrometer has
8
to be correctly calibrated . This does not, however, guarantee that the BE of energy level of the sample of interest
for study (different from the calibration set) is correctly reproduced. The primary reason for this is the possibility
of positive charge accumulation in the sample surface region (surface charging)9. The charge neutrality condition
requires that the loss of negative charge from the surface region (the consequence of the photoelectric effect)
is compensated with sufficiently high rate by electrons from the sample bulk, the substrate, or the surrounding
environment. If that does not take place, the surface charges positively, which effectively lowers kinetic energy
of emitted photoelectrons due to the Coulomb interaction and, in consequence, results in an uncontrolled shift
of spectral peaks towards higher BE values.
To neutralize the negative charge loss and to enable spectra acquisition from poorly-conducting samples,
low-energy electrons10 or a combination of electrons and ions (supplied by the so-called flood gun) are used.
This, however, does not solve the referencing problem as one can never a priori assume that the surface is neutral
during an XPS measurement. In order to distinguish peak shifts caused by charging from those due to chemistry,
an internal reference level is necessary to establish.
The availability of an internal energy reference, in general, does not present a big challenge for conducting
materials in electrical contact to the spectrometer. Such samples typically exhibit a clear cut-off in the density of
states at the Fermi level (so-called Fermi edge, FE), which serves as a natural zero on the BE scale11.
The situation is, however, cumbersome for insulators, which dominate in XPS analyses. Here, by far the most
common charge referencing method is the one that relies on the adventitious carbon (AdC) contamination
that occurs on essentially all samples analyzed by X PS3,12,13—which accounts for the extreme popularity of this
referencing technique. The method is temptingly simple and requires no other effort than recording the C 1s
peak of AdC and setting the C–C/C–H component at the BE arbitrary chosen from the range 284.6 to 285.2 eV,
as recommended by the ISO charge referencing guide13. The same rigid BE shift is then applied to all sample
signals, hence assuming that the correction is independent of the electron kinetic energy.
Thin Film Physics Division, Department of Physics, Chemistry, and Biology (IFM), Linköping University, 581
83 Linköping, Sweden. *email: grzegorz.greczynski@liu.se
Scientific Reports | (2021) 11:11195 | https://doi.org/10.1038/s41598-021-90780-9 1
Vol.:(0123456789)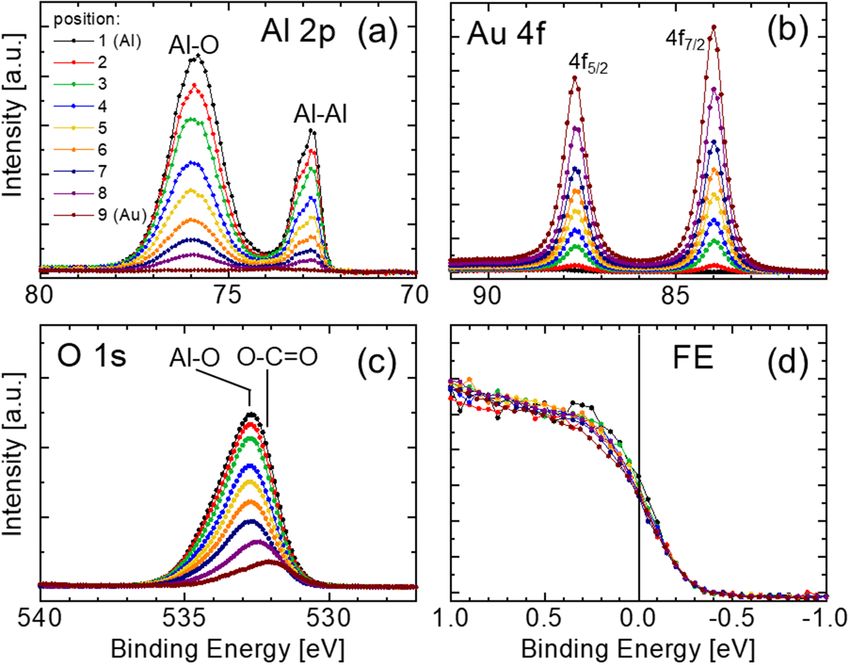
www.nature.com/scientificreports/
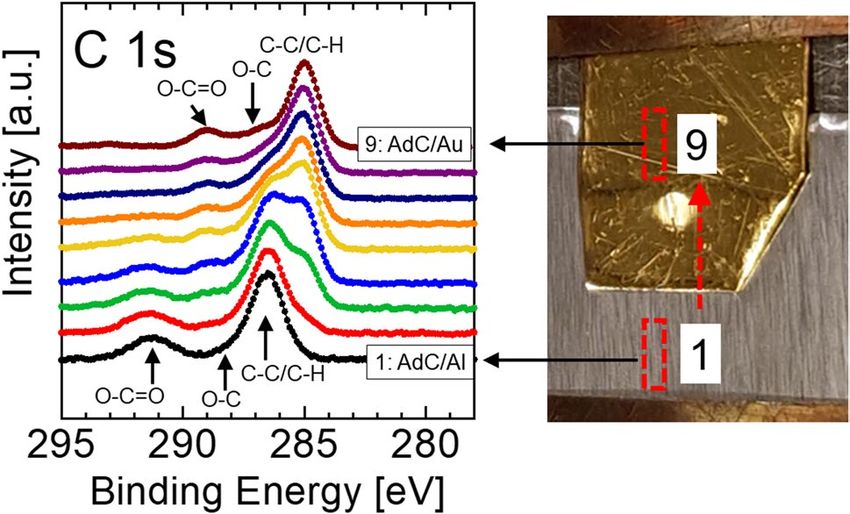
Figure 1. C 1s spectra of adventitious carbon recorded from Al and Au foil samples (showed to the right) as a
function of lateral position, which varies from Al foil (1) to Au foil (9) in steps of 0.1 mm. The size of the area
probed in each measurement is 0.3 × 0.7 mm2 (indicated with red rectangles).
Here, we present direct evidence, which should terminally disqualify the charge referencing method based
on the C 1s peak of AdC, and refute the deep-rooted notion that the same chemical state gives rise to peaks at
well-defined BE values.
Results
Commonly available Al and Au foils with AdC layers resulting from prolonged air exposure are set in contact
and mounted together on the sample holder. The AdC layer thickness estimated from the attenuation of the
substrate signal using the electron mean free path values reported in Ref.14 are 2.1 and 3.2 nm for Al and Au
substrates, respectively. The spectra are recorded from the area 0.3 × 0.7 m m2 that is sequentially moved from
the Al part (position 1) to the Au part (position 9) with the step of 0.1 mm. As illustrated in Fig. 1, the bind-
ing energy of the C–C/C–H peak that dominates the C 1s spectra of AdC, with the envelope characteristic of
adsorbed AdC, depends strongly on which sample area is probed and varies from 286.6 eV for the data recorded
from the Al foil (bottom spectrum) to 285.0 eV for AdC/Au (top). Moreover, for the intermediate probe place-
ments a double C–C/C–H peak is observed. Noteworthy, peaks due to two other chemical states of C atoms in
AdC, O=C–O and C–O, shift in the same manner from higher to lower BE, as the probe is moved from Al to
Au foil. This result contradicts the XPS paradigm, in which BE of core level peaks is defined by the type and the
nature of chemical bonds.
To exclude possible influence of surface charging phenomena, Al 2p, Au 4f, and O 1s core level spectra are
also recorded and shown in Fig. 2 together with the portions of the VB spectra in the vicinity of the Fermi level.
Al 2p spectra consist of two contributions: metallic Al peak centered at 72.98 eV (with apparent asymmetry due
to the unresolved 2 p3/2-2p1/2 spin-splitting)15 and a broad Al–O peak at ~ 76 eV. The identity of the latter peak
was verified in a separate experiment, in which evolution of Al 2p spectra was studied as a function of A r+ sput-
ter etch time (not shown). This test confirmed that after removal of surface oxides (evidenced by the loss of O
1s intensity) the higher BE peak disappeared, while the lower BE peak due to metallic Al increased in intensity
and remained at the same binding energy. With moving from position 1 (Al foil) to position 9 (Au foil) the Al
2p signal intensity gradually decreases (with no change in the peak positions), while the intensity of Au 4f peaks
(see Fig. 2b) increases. The Au 4 f7/2 component is present at 84.0 eV, independent of probe placement. Thus,
substrate signals are recorded at BE values typical for metallic Al and Au, which proves good electrical contact
between specimens and spectrometer. The latter is further verified by recording portions of valence band spec-
tra in the close vicinity of the Fermi level/edge. As depicted in Fig. 2d), the clear cut-off in the density of states
coincides with the 0 eV on the BE scale, irrespective of which sample area is probed. These observations indicate
that surface charging phenomena are not present.
Corresponding O 1s spectra in Fig. 2c are fully consistent with the evolution of Al 2p, Au 4f, and C 1s signals.
A broad peak centered at 532.7 eV is observed in data obtained from Al foil, with unresolved contributions due
to Al–O, C–O, and O–C=O (all contributions need to be present based on the corresponding Al 2p and C 1s
spectra). By moving from Al to Au foil, the intensity of that broad peak decreases (predominantly due to the
loss of the Al–O component) and eventually for the spectrum recorded at position 9 the entire signal originates
from C–O and O–C=O bonds in the AdC layer present on the Au foil.
Discussion
The all-important question is: -why does the binding energy of C 1s electrons originating from the C–C/C–H
bonded carbon vary between Al and Au foils? This observation is highly disturbing as it speaks against the
common belief that the chemical state determines BE of photoelectron peaks. Moreover, BE of the C 1s of AdC
varying in such wide range presents serious problem for the validity of XPS reports that use this signal for ref-
erencing XPS spectra.
Such disturbing result is a direct consequence of the fact the AdC layer does not remain in proper electrical
contact to the underlying substrate (likely due to fact that these carbonous species are physisorbed and can be
Scientific Reports | (2021) 11:11195 | https://doi.org/10.1038/s41598-021-90780-9 2
Vol:.(1234567890)www.nature.com/scientificreports/
Figure 2. (a) Al 2p, (b) Au 4f, (c) O 1s, and (d) valence band spectra in the vicinity of the Fermi level recorded
from Al and Au foil samples as a function of lateral position, which varies from Al foil (1) to Au foil (9) in steps
of 0.1 mm. The size of the area probed in each measurement is 0.3 × 0.7 mm2.
easily removed by gentle heating)16 resulting in vacuum-level alignment at the AdC/sample interface17. Under
these conditions, the measured BE values of all core level peaks from AdC layer (including of course C 1s) are
decoupled from the spectrometer Fermi level and become a sensitive function of the sample work function φSA. In
an earlier paper, we established experimentally that the following relation holds: EBF + φSA = 289.58 ± 0.14 eV18, in
which EBF stands for the measured BE of the C 1s peak. The work function values for Al and Au foils, determined
here from the secondary electron cut-off using the standard UPS procedure, are 3.0 and 4.5 eV, respectively, which
accounts for the 1.5 eV difference in the BE of corresponding C 1s peaks of AdC (cf. Figure 1). Hence, independ-
ent of the substrate type, the BE of the C–C/C–H signal is essentially constant with respect to the vacuum level
and amounts to 289.6 and 289.5 eV, for AdC layers on Al and Au foils, respectively.
The consequences of the above are disastrous for the use of the C 1s peak of AdC in referencing XPS spectra.
First, the BE of this signal is determined by the specimen work function, which is a very sensitive property
influenced by many variables like surface cleanness, roughness, crystalline phase, or crystal orientation. This
practically disqualifies C 1s peak as reliable reference. Secondly, referencing the spectra to C 1s peak leads to
unphysical results for specimens with relatively low work function (that is high BE of the C 1s line). For exam-
ple, if the XPS spectra obtained from the Al foil were referenced by setting the C–C/C–H C 1s peak at the ISO/
ASTM-recommended value of 284.8 eV, the metallic Al 2p would appear at 71.2 eV, which is ca. 1.8 eV lower BE
than commonly accepted value for metallic Al. Moreover, the density of states would extend up to 1.8 eV above
the Fermi level, which is obviously false.
Corresponding problems occur for any other arbitrary choice of the C 1s peak position within the ISO/ASTM
recommended range (284.6–285.2 eV)12,13. An additional complication is that AdC is an ill-defined compound
in itself and may be changeable between e xperiments19.
The C 1s method has a history dating back to the early days of XPS, marked with rather extensive criticism
expressed in the time period following the introduction in 1967 and stretching to 1982, when the critical review
on the topic was published by Swift under the rhetoric title “Adventitious Carbon-The Panacea for Energy Referenc-
ing?”20. The objections concerned the unknown chemical composition of the AdC l ayer21 its unknown origin22,
and the uncertain position of the C 1s peak23,24. Over time, sporadic critical voices25–28 became overrun by an
avalanche of XPS papers that rely simply on the AdC referencing. Systematic studies on the use of AdC layers for
BE referencing undertaken in our laboratory in the recent years fully confirm early objections to this technique
and identified additional p roblems17–19.
Doubts over the C 1s method are to some extent reflected in the ISO 19,318:2004 document: “Surface chemical
analysis—Reporting of methods used for charge control and charge correction” as well as in the ASTM E1523-15
standard “Charge Control and Charge Referencing Techniques in X-Ray Photoelectron Spectroscopy”. Although
the method is recommended, careful reading reveals a certain reservation: “A significant disadvantage of this
method lies in the uncertainty of the true nature of the carbon and the appropriate reference values which, as reported
in the literature, have a wide range from 284.6 eV to 285.2 eV for the C 1s electrons from hydrocarbon and graphitic
Scientific Reports | (2021) 11:11195 | https://doi.org/10.1038/s41598-021-90780-9 3
Vol.:(0123456789)www.nature.com/scientificreports/
carbon.” Strikingly, in the same document it is stated that “These contamination layers can be used for correction
purposes if it is assumed that they truly reflect the steady-state static charge exhibited by the specimen surface and
that they contain an element with a peak of known binding energy. [our underlining]” That disclaimer basically
leaves all the responsibility for using the C 1s method up to the investigator by putting him/her in a Catch-22
situation: the use of the referencing method is granted provided that it is possible to assess the sample charging
state, for which one needs the concerned referencing method.
Conclusions
In summary, we show that the C 1s signal from C–C/C–H bonded atoms present in adventitious carbon layers
accumulating on Al and Au foils appears at two distinctly different binding energy values, thus violating the XPS
paradigm of chemical state identification. As this signal is commonly used for referencing XPS spectra we argue
that the ISO and ASTM charge referencing guides should be revoked. The here presented evidence for the failure
of the conventional charge referencing procedure is based on readily available materials and methods and, as
such, can be easily verified in any XPS laboratory. Since other alternatives such as noble metal decoration29, noble
gas atom i mplantation30, deposition of organic l ayers31, “biased” r eferencing32, or the use of Auger p
arameter33
are not free from serious limitations, the lack of a reliable energy reference remains a fundamental problem in
XPS analyses of insulating materials with far reaching consequences for many fields of modern materials science.
Methods
Commonly available Al and Au foils are used in these experiments. Samples have been stored in the same
laboratory air for the time period of at least one year before loading in the load lock chamber of an Axis Ultra
DLD spectrometer from Kratos Analytical (UK) used for all XPS experiments here. The base pressure during
spectra acquisition is lower than 1.1 × 10⁻⁹ Torr (1.5 × 10⁻⁷ Pa). The excitation source is monochromatic Al Kα
radiation (hυ = 1486.6 eV) and the anode power is 150 W. All spectra are collected at normal emission angle.
The analyzer pass energy is set to 20 eV, which results in that the spectrometer energy resolution determined
from the FE cut-off of Au and Ag samples is 0.38 eV. The calibration of the binding energy scale was confirmed
by examining sputter-cleaned Au, Ag, and Cu samples (all in the form of polycrystalline thin films) according
to the recommended ISO standards for monochromatic Al Kα sources that place Au 4 f7/2, Ag 3d5/2, and Cu 2 p3/2
peaks at 83.96, 368.21, and 932.62 eV, respectively. For all measurements on sapphire, the charge neutralizer
is used. Work function φSA measurements by ultraviolet photoelectron spectroscopy (UPS) are performed in
the same instrument for films on Si(001) substrates with unmonochromatized He I radiation (hυ = 21.22 eV),
immediately after XPS analyses, employing the standard procedure in which φSA is assessed from the secondary-
electron cutoff energy in the He I UPS spectra34, with an accuracy of ± 0.05 eV.
Received: 24 March 2021; Accepted: 11 May 2021
References
1. Source: Scopus and Web of Science search for term "XPS" returns 11876 and 11857 hits, respectively, for 2020 only (as of
2021-02-10).
2. Sokolowski, E., Nordling, C. & Siegbahn, K. Chemical shift effect in inner electronic levels of Cu due to oxidation. Phys. Rev. 110,
776 (1958).
3. Siegbahn, K. & Nordling, C. ESCA, Atomic, Molecular and Solid State Structure Studied by Means of Electron Spectroscopy (Nov.
Act. Uppsaliensis, 1967).
4. Hagström, S., Nordling, C. & Siegbahn, K. Electron spectroscopic determination of the chemical valence state. Z. Phys. 178, 439–444
(1964).
5. Major, G. H. et al. Assessment of the frequency and nature of erroneous X-ray photoelectron spectroscopy analyses in the scientific
literature. J. Vac. Sci. Technol. A 38, 061204 (2020).
6. Greczynski, G. & Hultman, L. Compromising science by ignorant instrument calibration—Need to revisit half a century of pub-
lished XPS data. Angew. Chem. Int. Ed. 59, 5002 (2020).
7. National Institute of Standards and Technology (NIST). X-ray Photoelectron Spectroscopy Database, Version 4.1 compiled by
Naumkin, A. V., Kraut-Vass, A., Gaarenstroom, S. W., & Powell, C. J. http://srdata.nist.gov/xps/. Accessed on 2021-03-02.
8. ISO 15472:2010. Surface Chemical Analysis—X-ray Photoelectron Spectrometers—Calibration of Energy Scales (ISO, Geneva, 2010).
9. Cazaux, J. Mechanisms of charging in electron spectroscopy. J. Electron Spectrosc. Relat. Phenom. 105, 155 (1999).
10. Huchital, D. A. & McKeon, R. T. Appl. Phys. Lett. 20, 158 (1972).
11. Schön, G. High resolution Auger electron spectroscopy of metallic copper. J. Electron Spectrosc. 1, 377 (1973).
12. ASTM E1523-15. Standard Guide to Charge Control and Charge Referencing Techniques in X-Ray Photoelectron Spectroscopy (ASTM
International, West Conshohocken, PA, 2015) www.astm.org.
13. ISO 19318:2004. Surface Chemical Analysis—Reporting of Methods Used for Charge Control and Charge Correction.
14. Tanuma, S., Powell, C. J. & Penn, D. R. Calculations of electron inelastic mean free paths. IX. Data for 41 elemental solids over the
50 eV to 30 keV range. Surf. Interface Anal. 43, 689–713 (2011).
15. Moulder, J. F., Stickle, W. F., Sobol, P. E. & Bomben, K. D. Handbook of X-ray photoelectron spectroscopy (Perkin-Elmer Corpora-
tion, Eden Prairie, 1992).
16. Greczynski, G. & Hultman, L. In-situ observation of self-cleansing phenomena during ultra-high vacuum anneal of transition
metal nitride thin films: Prospects for non-destructive photoelectron spectroscopy. Appl. Phys. Lett. 109, 211602 (2016).
17. Greczynski, G. & Hultman, L. C 1s peak of adventitious carbon aligns to the vacuum level: dire consequences for material’s bonding
assignment by photoelectron spectroscopy. ChemPhysChem 18, 1507 (2017).
18. Greczynski, G. & Hultman, L. Reliable determination of chemical state in X-ray photoelectron spectroscopy based on sample-
work-function referencing to adventitious carbon: resolving the myth of apparent constant binding energy of the C 1s peak. Appl.
Surf. Sci. 451, 99 (2018).
19. Greczynski, G. & Hultman, L. X-ray photoelectron spectroscopy: towards reliable binding energy referencing. Prog. Mater Sci.
107, 100591 (2020).
20. Swift, P. Adventitious carbon—The panacea for energy referencing?. Surf. Interface Anal. 4, 47–51 (1982).
Scientific Reports | (2021) 11:11195 | https://doi.org/10.1038/s41598-021-90780-9 4
Vol:.(1234567890)www.nature.com/scientificreports/
21. Nordberg, R., Brecht, H., Albridge, R.G., Fahlman, A., & Van Wazer, J.R. Binding energy of the" 2p" electrons of silicon in various
compounds. Inorganic Chemistry. 9, 2469–2474 (1970).
22. Johansson, G., Hedman, J., Berndtsson, A., Klasson, M. & Nilsson, R. Calibration of electron spectra. J. Electron Spectrosc. Relat.
Phenom. 2, 295 (1973).
23. Kinoshita, S., Ohta, T. & Kuroda, H. Comments on the energy calibration in X-ray photoelectron spectroscopy. Bull. Chem. Soc.
Jpn. 49, 1149–1150 (1976).
24. Dianis, W. P. & Lester, J. E. External standards in X-ray photoelectron spectroscopys. Comparison of gold, carbon, and molybdenum
trioxide. Anal. Chem. 45, 1416–1420 (1973).
25. Böse, O., Kemnitz, E., Lippitz, A. & Unger, W. E. S. C. Remigius Fresenius, 1818–1897, founder of Institut Fresenius and “Fresenius’
Zeitschrift für analytische Chemie” (now Fresenius’ Journal of Analytical Chemistry). Fresenius J. Anal. Chem. 358, 175 (1997).
26. Werrett, C. R., Bhattacharya, A. K. & Pyke, D. R. The validity of Cls charge referencing in the XPS of oxidised Al-Si alloys. Appl.
Surf. Sci. 103, 403–407 (1996).
27. Peplinski, B., Unger, W. E. & Grohmann, I. Characterization of Cu-Zn-Al oxide catalysts in the precipitaed, calcined and reduced
state by means of XPS with the help of a finger-print data base. Appl. Surf. Sci. 62, 115–129 (1992).
28. Gross, T. et al. An XPS analysis of different SiO2 modifications employing a C 1s as well as an Au 4f7/2 static charge reference. Surf.
Interface Anal. 18, 59–64 (1992).
29. Hnatowich, D. J., Hudis, J., Perlman, M. L. & Ragaini, R. C. Determination of charging effect in photoelectron spectroscopy of
nonconducting solids. J. Appl. Phys. 42, 4883–4886 (1971).
30. Citrin, P. H. & Hamann, D. R. Measurement and calculation of polarization and potential-energy effects on core-electron binding
energies in solids: X-ray photoemission of rare gases implanted in noble metals. Phys. Rev. B 10, 4948 (1974).
31. Vesely, C. J. & Langer, D. W. Electronic core levels of the II B−VI A compounds. Phys. Rev. B 4, 451 (1971).
32. Stephenson, D. A. & Binkowski, N. J. X-ray photoelectron spectroscopy of silica in theory and experiment. J. Non-Cryst. Solids 22,
399–421 (1976).
33. Wagner, C. D. Chemical shifts of Auger lines, and the Auger parameter. Faraday Discuss. Chem. Soc. 60, 291–300 (1975).
34. Evans, S. Work function measurements by X-Pe spectroscopy, and their relevance to the calibration of X-Pe spectra. Chem. Phys.
Lett. 23, 134–138 (1973).
Acknowledgements
The authors gratefully acknowledge the financial support of the Knut and Alice Wallenberg Foundation Scholar
Grant KAW2016.0358, the Swedish Research Council VR Grant 2018-03957, the Swedish Energy Agency under
project 51201-1, the VINNOVA Grant 2019-04882, the Carl Tryggers Stiftelse contracts CTS 17:166, CTS 15:219
and CTS 14:431, as well as the Swedish Government Strategic Research Area in Materials Science on Functional
Materials at Linköping University (Faculty Grant SFO-Mat-LiU No. 2009-00971).
Author contributions
G.G: writing, conceptualization, measurements, interpretation, funding L.H. writing, conceptualization, funding.
Funding
Open access funding provided by Linköping University.
Competing interests
The authors declare no competing interests.
Additional information
Correspondence and requests for materials should be addressed to G.G.
Reprints and permissions information is available at www.nature.com/reprints.
Publisher’s note Springer Nature remains neutral with regard to jurisdictional claims in published maps and
institutional affiliations.
Open Access This article is licensed under a Creative Commons Attribution 4.0 International
License, which permits use, sharing, adaptation, distribution and reproduction in any medium or
format, as long as you give appropriate credit to the original author(s) and the source, provide a link to the
Creative Commons licence, and indicate if changes were made. The images or other third party material in this
article are included in the article’s Creative Commons licence, unless indicated otherwise in a credit line to the
material. If material is not included in the article’s Creative Commons licence and your intended use is not
permitted by statutory regulation or exceeds the permitted use, you will need to obtain permission directly from
the copyright holder. To view a copy of this licence, visit http://creativecommons.org/licenses/by/4.0/.
© The Author(s) 2021
Scientific Reports | (2021) 11:11195 | https://doi.org/10.1038/s41598-021-90780-9 5
Vol.:(0123456789)You can also read