The "Sitka Hurricane" in South-Eastern Alaska in the Year 1880 - boris
←
→
Page content transcription
If your browser does not render page correctly, please read the page content below
Franke J., L. Di Marco, M. Pickl, C. Mock, K. Wood, and S. Brönnimann (2017) The “Sitka
                                                                        Hurricane” in South-Eastern Alaska in the Year 1880. In: Brönnimann, S. (Ed.) Historical Weather
                                                                        Extremes in Reanalyses. Geographica Bernensia G92, p. 59-67, DOI: 10.4480/GB2017.G92.05.

                                                                        The “Sitka Hurricane” in South-Eastern Alaska in the Year 1880

                                                                        Jörg Franke1*, Lorenzo Di Marco1, Moritz Pickl1, Cary Mock2, Kevin Wood3, and Stefan
                                                                        Brönnimann1
                                                                        1
                                                                         Oeschger Centre for Climate Change Research and Institute of Geography, University of
                                                                        Bern, Switzerland
                                                                        2
                                                                         Department of Geography, University of South Carolina, Columbia, United States of
                                                                        America
                                                                        3
                                                                         National Oceanic and Atmospheric Administration, Pacific Marine Environmental
                                                                        Laboratory, United States of America
source: https://doi.org/10.7892/boris.111287 | downloaded: 16.11.2019

                                                                        Abstract
                                                                        The extra-tropical cyclone called “Sitka hurricane” of October 1880 was one of the strongest
                                                                        storms ever to be recorded in the Gulf of Alaska. The USS Jamestown, a military ship moored
                                                                        off the Sitka harbour when the storm made landfall, observed an extremely low pressure of
                                                                        958 hPa at sea-level and winds of 12 Beaufort. The aim of this study was to analyse this storm
                                                                        in version 2c of the Twentieth Century Reanalysis (20CRv2c), in which the USS Jamestown
                                                                        observations were not assimilated. Because the next assimilated pressure measurements are
                                                                        located more the 1000 km south of Sitka, the storm cannot be found in the 20CRv2c ensemble
                                                                        mean; but multiple ensemble members simulate wind speeds close to the observations. In
                                                                        particular, two ensemble members show a similar pressure and wind-speed evolution at the
                                                                        right time and location. However, they deviate in the observed passage of a cold front and in
                                                                        the location the cyclone deepening. Thus, none of the ensemble members reflects exactly the
                                                                        atmospheric state during the evolution and land-fall of the “Sitka hurricane”. Digitizing and
                                                                        assimilating additional early instrumental data, such as the log books from ships is crucial for
                                                                        future improvements of reanalysis products that reach into the 19th century.

                                                                        *
                                                                         Corresponding author: Joerg Franke, University of Bern, Institute of Geography, Hallerstr. 12, CH-3012 Bern,
                                                                        Switzerland. E-mail: joerg.franke@giub.unibe.ch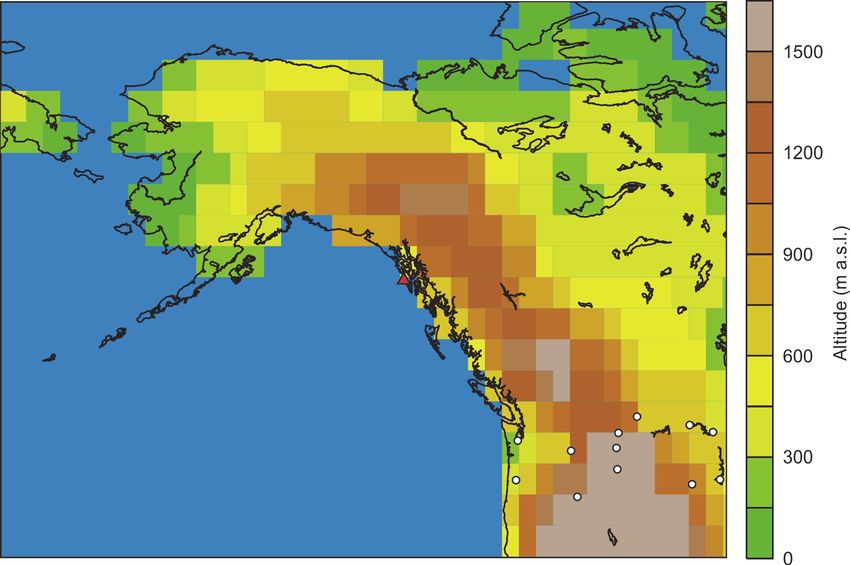
1. Introduction
The south-east of Alaska lies within the zone of mid-latitude westerly winds. Winter storms
are common phenomena, but cyclones are usually in their spin-down phase (cyclolysis) in this
region and hence not severe (Martin et al., 2001). If devastating storms occur, they are mostly
remnants of tropical cyclones that undergo extra-tropical transition and become strong non-
tropical systems. This was the case, for instance, in October 2015 when remnants of Pacific
Typhoon Oho hit the region of Ketchikan with wind gusts of more than 120 km h-1 and 180
mm of precipitation in a single day.
The lowest sea-level pressure in the region (958 hPa) was recorded on 26 October 1880
by the USS Jamestown in the harbour of Sitka (57°3’ N, 135°20’ W, UTC -8 h), before a
permanent weather station had been installed. This cyclone created the so-called “Sitka
hurricane”, which was one of the strongest storms ever to be recorded on the north-western
coast of North America. The analysis of the event by means of historical data, ship logbooks,
newspapers and written weather reports (Mock and Dodds, 2009) revealed that this storm did
not originate from a tropical cyclone. Mock and Dodds (2009) tracked the origin of the
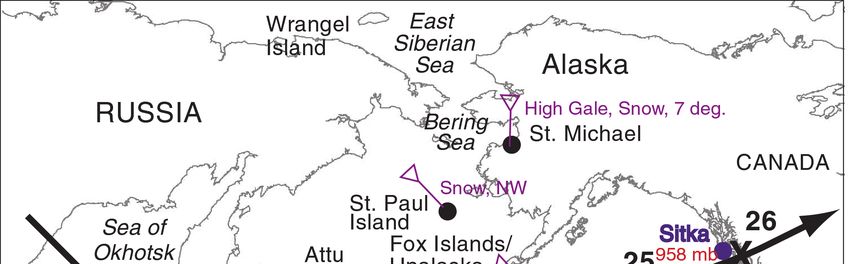
cyclone back to the Sea of Okhotsk, Western Siberia (Fig. 1). The passage of the cyclone
induced a sharp drop in pressure on the morning of 26 October 1880 in Sitka. At the same
time, the wind reached its maximum speed of up to 12 Beaufort and the cold front decreased
the temperature from 12 to 3 ºC. The wind direction was from the east before the drop,
changed to northeast with the drop and to southeast when the pressure was rising again. This
suggests that the centre of the cyclone was south of the town of Sitka. Gale force winds and
low temperatures well away from the lowest pressure, such as revealed by the diary of
Edward William Nelson and Edward Alphonso Goldman at St. Michael, Alaska, and at St.
Paul Island, Alaska illustrate the large extratropical nature of this storm.
The main limitation to better understand the evolution of this rare and extreme event is
data availability. Now, with version 2c of the Twentieth Century Reanalysis (20CRv2c), a 6-
hourly resolved global reanalysis that reaches back to 1851, there is the potential for an in-
depth analysis of this storm (Compo et al., 2011). However, it is not clear if or how well the
storm is resolved in 20CRv2c. A lack of observations in the northern Pacific may result in a
Figure 1. Reconstructed track of cyclone (modified from Mock and Dodds, 2009).
60
Franke et al.: The “Sitka Hurricane” 1880

large ensemble spread. In this case, single ensemble members could still show a storm, which
agrees with the large-scale circulation pattern. The aim of this study is to identify storm
patterns in the North Pacific related to the 1880 “Sitka hurricane” in 20CRv2c.

2. Data
In this section, we describe the data and methods used in this study. The data comprise a
reanalysis data set as well as independent instrumental observations.
     Version 2c of the 20CR (Compo et al., 2011) is used in this study. Only 6-hourly
observations of surface pressure from the International Surface Pressure Database (ISPD)
version 3.2.9 (Cram et al., 2015) have been assimilated (Fig. 2). Additionally, monthly sea-
surface temperature and sea-ice distributions have been prescribed as boundary conditions for
the atmosphere model. The sea-surface temperatures consist of an 18 members ensemble from
the Simple Ocean Data Assimilation with sparse input (SODAsi) version 2 (Giese et al.,
2016) with the high latitudes corrected to COBE-SST2 (Hirahara et al., 2014). We will
investigate both, the 20CRv2c ensemble mean and the ensemble members.
     The distribution of assimilated pressure measurements on the day of the storm (Fig. 2)
highlights a lack of observations in the northern Pacific in the year 1880. The closest stations
lie over a thousand kilometres to the south in the Northwest of the Unites States of America.
The data from the USS Jamestown was not included in 20CRv2c.
     Observations mainly come from the USS Jamestown, which was moored off Sitka when
the storm struck the coast. They consist of hourly observations of temperature, pressure, wind
force, as well as 12-hourly water temperature measurements and qualitative description of the
weather situation (Mock and Dodds, 2009). Additional observations, published in the same
study, were recorded by the USCS schooner Yukon, south of Unalga Pass/Unalaska.

Figure 2. Locations of pressure observations (white points) on 26 October 1880, 12 UTC in the International
Surface Pressure Database (IPSD) version 3.2.9 and the location of Sitka (red triangle).

                                                                                                        61
3. Results
3.1 The “hurricane” in observations and the 20CRv2c ensemble mean
First, we examine the time series of the grid box that includes the town of Sitka in the
20CRv2c ensemble mean and compare these to the observations from the USS Jamestown.
The evolution of mean sea-level pressure in 20CRv2c is nearly constant during the period
from 3 days before until 3 days after the “hurricane” (Fig. 3). Pressure decreases slightly from
1008 hPa on 22 October to the minimum of 1000 hPa in the night between 24 and 25 October
1880. The date of the minimum appears already one and a half day earlier than in the
historical data. In contrast to the 1000 hPa of the 20CRv2c ensemble mean, the observational
data shows a very strong pressure drop from 998 to 957 hPa within 15 hours on 26 October
1880.
The temperature evolution of the ensemble means does not drop as would be expected
due to the passage of a cold front (Fig. 3). The temperature measurements from the USS
Jamestown, however, show a remarkable temperature drop of 9 K in only 4 hours.
Figure 3. Time series of the 20CRv2c ensemble means (red) and the USS Jamestown measurements (blue) for
mean sea-level pressure (top), air temperature (middle) and 10-m wind speed (in m s-1 for 20CRv2c and Bft for
observations, bottom) in. Dates represent local time (UTC -8 h).
62Franke et al.: The “Sitka Hurricane” 1880
Figure 4. 20CRv2c ensemble mean geopotential height (shading, left) and sea-level pressure (contours) over the
North-East Pacific on 26 October 1880, 10:00 AM local time, when the Sitka hurricane made landfall. Ensemble
mean wind speed (shading, right) and direction (black arrows) for the same time and region.
Wind speed of the reanalysis data reaches 6 m s-1 (4 Bft) and does not denote a storm
within grid boxes around Sitka, whereas the wind force observations show a major peak (10
and 12 Bft) on 26 October 1880.
Over the period from 22 October to 1 November 1880, none of the variables of
temperature, sea-level pressure and wind speed shows noticeable features that point to a
severe storm at the grid boxes around Sitka. A look at the entire northeast Pacific region in
20CRv2c reveals a weak low-pressure system (1002 hPa), which was located in the Gulf of
Alaska southwest of Sitka, at the time when the USS Jamestown observed the “hurricane”
(Fig. 4). Because the nearest assimilated pressure observation is located more the 1000 km
south of Sitka (Fig. 2), the 20CRv2c ensemble means does not show a storm. Individual
members might nevertheless exhibit realistic cyclones. To further investigate this possibility,
we look at the single ensemble members as well as temporal and spatial shifts.
3.2 Single Ensemble Members
Because there are no storm patterns in the ensemble mean, we analyse the single ensemble
members to identify model runs, which resolved a storm in the area of interest. Sitka is right
at the edge of two grid boxes in the model, the mostly land covered box 57-59 ºN and the
mostly ocean covered grid box 55-57 ºN. As Sitka is right at the coast the latter is likely more
representative for the conditions in Sitka during westerlies. Time series of all ensemble
members at the grid cell south of Sitka have a large ensemble spread for all variables.
Pressure on 26 October 1880 ranges from about 960 to 1030 hPa, temperature from -5 to 12
ºC and wind speed from almost 0 to 30 m s-1 (Fig. 5).
The ensemble members #25 and #38 (green and orange curve in Fig. 5a) are the
members that have the most pronounced pressure drop within the period when the storm was
observed. In member #38 pressure decreases from 1007 hPa on 24 October 1880 to 973 hPa
on 26 October 1880. In member #25 pressure is already low with 990 hPa in the evening of
25 October 1880 but in the afternoon of 26 October 1880 it drops further down to 960 hPa.
After the drop, the pressure increases again in both members.
63Temperature drops in ensemble members #25 and #38 in the evening of 26 October
1880, only a few hours later then in the observations of the USS Jamestown (Fig. 5b). The
temperature evolution of member #25 is much closer to the measurements with relatively
constant temperatures of 8 to 10 ºC before the event and a drop down to 3 to 5 ºC during the
following days. Only the amplitude of the temperature drop is around 2 ºC smaller in
20CRv2c.
Wind speeds of 12 Beaufort have been visually observed on the USS Jamestown, which
equals around 33 m s-1. Four ensemble members (#6, #33, #48 and #49) reach wind speeds
above 30 m s-1 between 25 and 27 October 1880. These values are grid box averages and will
likely be lower than local wind maxima. Hence, some 20CRv2c members clearly reach
observed wind speeds. A little bit to the south of Sitka (132º W, 52º N), wind speed in one
20CRv2c ensemble member even exceeds 34 m s-1 on a grid box level. Wind speed in
ensemble member #25, which matched best to observations in terms of temporal sea-level
pressure and temperature evolution, exceeds 28 m s-1 on a grid box average and thus are also
in agreement with local observations of 12 Beaufort.
Figure 5. Time series of the 56 ensemble members (dashed grey lines), ensemble mean (red line) and two
ensemble members (#25 dashed blue line, #38 dashed orange line) of mean sea-level pressure (top), air
temperature (middle) and wind speed (bottom) for the nearest grid point to Sitka. Data in local time (GMT-8).
64Franke et al.: The “Sitka Hurricane” 1880
Figure 6. Wind speed (shading) and direction (arrows) over the North-East Pacific for the ensemble member #25
on 26 October 1880 04:00 local time in Sitka (left) and #38 (right) on 26 October 1880 10:00 local time.
In member #25 the centre of the low-pressure system with below 965 hPa is located to
the southwest of Sitka already 8 hours before the observed hurricane. At this time, highest
wind speeds of more than 35 m s-1 on a grid box level are reached close to the Canadian coast
a few hundred kilometres south of Sitka (Fig. 6). In the grid box at the southern edge of Sitka
wind speeds during this storm were still close to 30 m s-1. In ensemble member #38 the timing
is even more correct with the low-pressure centre of below 970 hPa just west of Sitka at the
time of the event. Also in this ensemble member, grid box average wind speeds are close to
30 m s-1 on the southern edge of Sitka (Fig. 6).
In these two ensemble members the cyclone travels over the northern Pacific Ocean on a
track similar to that proposed by Mock and Dodds (2009). Member #38 has a block over the
Bering Strait region which deviates the cyclone track southward between 22 and 24 October
1880. A cut off exists on the 22 October 1880 in the Aleutian region, which moves eastward
and deepens when it reaches a 500 hPa through close to the Alaskan/Canadian coast.
Member #25, in contrast, has no pronounced upper level waves and thus nearly zonal
flow. A weak cyclone moves from the Aleutian region on 22 October 1880 eastward and
intensifies as well shortly before making landfall at the west coast of North America.
4. Discussion
The ensemble mean of the 20CRv2c reanalysis does not show a severe storm when the so-
called “Sitka hurricane” was observed in October 1880, neither in the surrounding days nor
the adjacent area. Indeed, the ensemble means of the variables change only very slightly over
65time because single extreme members get smoothed out. The ensemble spread is large due to
the lack of observations in the northern Pacific region including Canada, Alaska and ship log
books. The closest pressure observation, which got assimilated, is located more than a
thousand kilometres from Sitka in Washington State, United States. Neither observations of
the USS Jamestown nor the USCS Yukon were included in the 20CRv2c reanalysis.
In two of the ensemble members (#25 and #38) sea-level pressure and wind speed evolve
similarly to the observations of the USS Jamestown. However, in contrast to observations,
temperatures in both members start to decrease with a delay of a few hours and not as rapidly
as observed. In both members the cyclones can be tracked back to the Aleutian region and
they follow a commonly observed storm track eastward over the North Pacific (Rodionov et
al., 2007). In contrast to a text book cyclone deepening around the Aleutian Arc, a region with
strong baroclinicity, and a weekening at the Alaskan/Canadian coast, the cyclones in both
20CRv2c ensemble members are weak in the Aleutian region and deepen close to the coast.
This disagrees with observations from the USCS schooner Yukon south of Unalga
Pass/Unalaska on 22-23 October 1880 (Mock and Dodds, 2009), where already a strong
cyclone was measured with 960 hPa pressure at its centre. Snow observation in north-western
Alaska (Fig. 1) appear very unlikely with the Bering Strait block in ensemble member #38.
We conclude that 20CRv2c ensemble member #25 is closest to observations at Sitka and
in terms of the reconstructed cyclone track by Mock and Dodds (2009), which itself is based
on the interpretation of sparse observations. However, that late deepening of the cyclone close
to landfall disagrees with observations south of Unalga Pass. Hence, none of the 20CRv2c
ensemble members simulated the exact weather evolution of the Sitka hurricane.
Nevertheless, multiple ensemble members indicate weather conditions that lead to a storm
with observed wind speeds in the grid cells surrounding Sitka around 26 October 1880.
5. Conclusions
The aim of this study was to identify if the so-called “Sitka hurricane” in October 1880 was
resolved in version 2c of the Twentieth Century Reanalysis. Despite its designation, this was
not a hurricane that developed from a tropical cyclone transition but an extra-tropical storm.
Due to a lack of assimilated observations in the North Pacific, the ensemble spread in this
region is large and hence no storm is visible in the ensemble mean. Hurricane strength storms
in single ensemble members highlight that large scale atmospheric conditions allow for a
strong storm to develop. Two ensemble members appear similar to the observed storm but
deviate in their temperature evolution and the location of cyclone deepening. Including newly
digitized information from data sparse regions, such as log books from ships, will be crucial
for future improvements of 20CRv2c and other reanalysis that extend back into the 19th
century.
Acknowledgements
Support for the Twentieth Century Reanalysis Project dataset is provided by the U.S. Department of Energy,
Office of Science Innovative and Novel Computational Impact on Theory and Experiment (DOE INCITE)
program, and Office of Biological and Environmental Research (BER), and by the National Oceanic and
Atmospheric Administration Climate Program Office. The authors wish to acknowledge funding from EC projects
ERA-CLIM2 (FP7) and EUSTACE (H2020) and the Swiss National Science Foundation project EXTRA-LARGE.
66Franke et al.: The “Sitka Hurricane” 1880
References
Compo, G. P., J. S. Whitaker, P. D. Sardeshmukh, N. Matsui, R. J. Allan, X. Yin, B. E. Gleason, R. S. Vose, G.
Rutledge, P. Bessemoulin, S. Brönnimann, M. Brunet, R. I. Crouthamel, A. N. Grant, P. Y. Groisman, P. D.
Jones, M. C. Kruk, A. C. Kruger, G. J. Marshall, M. Maugeri, H. Y. Mok, O. Nordli, T. F. Ross, R. M. Trigo,
X. L. Wang, S. D. Woodruff, and S. J. Worley (2011) The Twentieth Century Reanalysis Project. Q. J. R.
Meteorol. Soc., 137, 1–28, doi:10.1002/qj.776.
Cram, T. A., G. P. Compo, X. G. Yin, R. J. Allan, C. McColl, R. S. Vose, J. S. Whitaker, N. Matsui, L. Ashcroft,
R. Auchmann, P. Bessemoulin, T. Brandsma, P. Brohan, M. Brunet, J. Comeaux, R. Crouthamel, B. E.
Gleason, P. Y. Groisman, H. Hersbach, P. D. Jones, T. Jonsson, S. Jourdain, G. Kelly, K. R. Knapp, A. Kruger,
H. Kubota G. Lentini, A. Lorrey, N. Lott, S. J. Lubker, J. Luterbacher, G. J. Marshall, M. Maugeri, C. J. Mock,
H. Y. Mok, O. Nordli, M. J. Rodwell, T. F. Ross, D. Schuster, L. Srnec, M. A. Valente, Z. Vizi, X. L. Wang,
N. Westcott, J. S. Woollen, and S. J. Worley (2015) The International Surface Pressure Databank version 2.
Geosci. Data J., 2, 31–46, doi:10.1002/gdj3.25.
Giese, B. S., H. F. Seidel, G. P. Compo, and P. D. Sardeshmukh (2016) An ensemble of ocean reanalyses for
1815–2013 with sparse observational input. J. Geophys. Res., 121, 6891–6910, doi:10.1002/2016JC012079.
Hirahara, S., M. Ishii, and Y. Fukuda (2014) Centennial-Scale Sea Surface Temperature Analysis and Its
Uncertainty. J. Clim., 27, 57–75, doi:10.1175/JCLI-D-12-00837.1.
Martin, J. E., R. D. Grauman, and N. Marsili (2001) Surface cyclolysis in the North Pacific Ocean. Part I: A
synoptic climatology. Mon. Weather Rev., 129, 748–765.
Mock, C. J. and S. F. Dodds (2009) The Sitka Hurricane of October 1880. In: Dupigny-Giroux L. A., and C. J.
Mock (Eds.) Historical Climate Variability and Impacts in North America, 99–106,
doi:https://doi.org/10.1007/978-90-481-2828-0.
Rodionov, S. N., N. A. Bond, and J. E. Overland (2007) The Aleutian Low, storm tracks, and winter climate
variability in the Bering Sea. Deep-Sea Research Part II – Tropical Studies in Oceanography, 54, 2560–2577,
doi:10.1016/j.dsr2.2007.08.002.
67You can also read