The Socioeconomic Spillovers of Sanitation: Sewage Treatment Plants in Navi Mumbai, India - Asian ...

Page created by Ethel Coleman
 
CONTINUE READING
The Socioeconomic Spillovers of Sanitation: Sewage Treatment Plants in Navi Mumbai, India - Asian ...
ASIAN DEVELOPMENT BANK INSTITUTE

                                  ADBI Development Case Study No. 2020-1 (May)

                                     The Socioeconomic
                                   Spillovers of Sanitation:
                                  Sewage Treatment Plants
                                   in Navi Mumbai, India
                                  Vinayakam Jothiprakash, Marcus Joseph Tobias,
                                              and KE Seetha Ram

© 2020 Asian Development
Bank Institute

This work is licensed under the
Creative Commons Attribution-
NonCommercial-ShareAlike 4.0
International License.
The Socioeconomic Spillovers of Sanitation:
 Sewage Treatment Plants in Navi Mumbai, India
Vinayakam Jothiprakash, Marcus Joseph Tobias, and KE Seetha Ram

Vinayakam Jothiprakash is a professor at the Indian Institute of Technology Bombay.
Marcus Joseph Tobias is a summer intern at the Indian Institute of Technology Bombay.
KE Seetha Ram is senior consulting specialist for capacity building and training projects at
the Asian Development Bank Institute.

   We acknowledge the Navi Mumbai Municipal Corporation authorities, especially
   the present and past commissioners, the city engineer, assistant city engineer, and
   the executive engineers and their team in the Sanitation Department for providing
   necessary data and relevant information for this study. We also thank the project
   management consultant, M/s Tandon Urban Solutions Pvt Ltd, for their assistance.
   Special thanks to the Department of Environment and the Maharashtra Pollution
   Control Board, Government of Maharashtra, for the valuable contribution to
   this study.

Introduction
Urbanization and industrialization draw people from rural areas to migrate to cities in
search of a better standard of living. In fast-developing countries like India, the large flow
of migrants to major cities puts much pressure on city infrastructure especially on the
water supply and sanitation system and particularly on sanitation infrastructure such as
the wastewater collection network, treatment through sewage treatment plants (STPs),
sewage disposal system, and the reuse distribution system. As a consequence, around
80% of the total drinking water supply ends up as wastewater. In several instances, the
facilities provided have become either insufficient or improperly maintained. Kulkarni,
Wanjule, and Shinde (2018) report that out of the total sewage produced in India only
10% is treated and the rest is discharged into water bodies or on the ground. In most cities,
wastewater is often untreated, and thus contaminating the surface as well as groundwater
resources. Therefore, proper sewage treatment is essential; and sometimes treated sewage
can be used for other purposes as well (Kulkarni, Wanjule, and Shinde (2018).

Around 80% of the total drinking water supply ends up as wastewater.

Local, state, and central governments must develop and put in place sanitation policies to
help improve hygiene and living conditions of a large sector of the population. India has
established several such policies, the Jawaharlal Nehru National Urban Renewal Mission

                                                                                                 1
The Socioeconomic Spillovers of Sanitation: Sewage Treatment Plants in Navi Mumbai, India

         (JNNURM) and Atal Mission for Rejuvenation and Urban Transformation (AMRUT) among
         them. These programs have facilitated the development of sanitation infrastructure in several
         cities, which have brought sanitation and hygiene benefits to city residents. In addition, such
         large infrastructure projects also offer economic and social spillovers, depending on the technical
         efficiency of the sewer network, sewage treatment methodology, operation and maintenance of
         the STP, and continuous monitoring of the effluent characteristics. It is thus necessary to study
         and evaluate the STP process from its inception; because a small error corrected in time saves
         a large amount of effort and money over time. This study examines the technical efficiency and
         socioeconomic spillovers of the STP at Navi Mumbai Municipal Corporation (NMMC) in Navi
         Mumbai, Maharashtra, India.

         To assess the STP’s technical efficiency, we study the quality of its influent (raw) sewage and
         effluent (treated) sewage. The Supervisory Control and Data Acquisition (SCADA) system collects
         and monitors relevant time series data on several sewage characteristics such as pH, temperature,
         biological oxygen demand (BOD), chemical oxygen demand (COD), total suspended solids (TSS),
         and dissolved oxygen (DO). By comparing the observed sewage quality before and after treatment,
         we are able to assess the treatment efficiency (technical) of the STP over a period of time.

         We also assess the sanitary project’s socioeconomic spillover effects over the area by studying
         other benefits such as increased property values; increased number of settlements; increase in tax
         revenue; environment health-related aspects like air quality, water quality, and public health life;
         decrease in waterborne diseases; and the monetary benefit in the sale of treated water for various
         purposes like industrial use, gardening, and road wash.

         In India, the Manual on Sewerage and Sewage Treatment by the Central Public Health and
         Environmental Engineering Organisation (CPHEEO) (1993) provides the standard guidelines for
         designing an STP. The manual was revised in 2012. In addition, a few case studies have reported
         on the performance evaluation of STPs worldwide (UNEP 1991; Belhaj et al. 2014; Hegazy and
         Gawad 2016; Kulkarni, Wanjule, and Shinde 2018; Bhave and Rahate 2018; and Ahmed et al.
         2018); some have reported on STP performance using soft-computing techniques (Hamed,
         Khalafallah, and Hassanein 2004; Hanbay, Turkoglu, and Demir 2008); but very few studies have
         studied and reported on the STP’s spillover effects. The Central Pollution Control Board (CPCB)
         of the Government of India has issued evaluation guidelines (CPCB 2007) for assessing the
         operation and maintenance of STPs in India. But there are no standard guidelines for studying
         spillovers, especially socioeconomic spillovers, even though good reports are available to study the
         environmental assessment of STPs (UNEP 1991).

         STPs bring about other ancillary benefits, such as improved hygiene, better water quality in tanks
         and ponds, larger numbers of migratory birds in coastal cities as a result of discontinued dumping of
         untreated sewage into creeks (flamingo migration in the NMMC area), and good health and overall
         economic growth. The lessons learned from employing these sanitation policies, the technical
         knowledge from their implementation, and the quantification of the spillover effects offer useful
         knowledge for decision makers to accelerate other sanitation projects not only statewide but also
         nationwide.

2
The Socioeconomic Spillovers of Sanitation: Sewage Treatment Plants in Navi Mumbai, India

India’s National Urban Sanitation Policy
In November 2008, the Government of India launched a national urban sanitation policy with
the goal of eradicating open defecation and creating totally sanitized cities in which wastewater
is safely collected and treated. JNNURM (2005–2014) played an important role in financing
urban water supply and sanitation through central government grants. However, the grants were
limited to the 35 largest cities in the country and 28 other selected cities. Many cities with less
than 1 million inhabitants were not eligible. Hence, after 2014, the policy was extended to all
cities through AMRUT, the government’s new flagship urban development program. In addition,
the government announced its high-profile Swachh Bharat Abhiyan (Clean India Mission) policy,
which aimed to eradicate open defecation by 2019 in 4,041 cities and towns. The program has
received funding and technical support from the World Bank, corporations, and state governments
under the Sarva Shiksha Abhiyan and Rashtriya Madhyamik Shiksha Abhiyan schemes. These large
sanitation policies are expected to provide sanitation facilities throughout India.

The government has taken on the following roles: at the national level it generates awareness and
provides funding and assistance; at the state level, it ensures that standards are set and the tenure
and space issues are resolved for providing sanitation to the urban poor; and at the city level, it
conducts capacity building and training as well as monitoring and evaluation. The urban local bodies
on the other hand are responsible for preparing city sanitation plans, planning for the financing of
schemes, obtaining the required approvals, execution, and operation and maintenance.

To address urban sanitation issues—such as poor awareness, poor institutional arrangement,
lack of an integrated citywide approach, reaching the urban poor, and lack of responsiveness to
demand—India’s government introduced the National Urban Sanitation Policy to (i) generate
awareness about sanitation and its link to public and environmental health; (ii) promote access
to safe sanitation facilities for households; (iii) establish proper planning and management of
community toilets; and (iv) strengthen institutions at the national, state, and local levels to
prioritize the provision of a properly planned, implemented, and managed sanitation scheme.

After the launch of the national urban sanitation policies, several urban local bodies approached
the state and the central government to provide sanitation in their cities. Several cities have
successfully implemented sanitation facilities in consequence, but some of these facilities are now
more than 5 years old. This paper studies the sanitation facilities in a large city—in NMMC in
particular—and evaluates the efficiency of the STPs and examines the spillover effects of providing
such a large-scale facility.

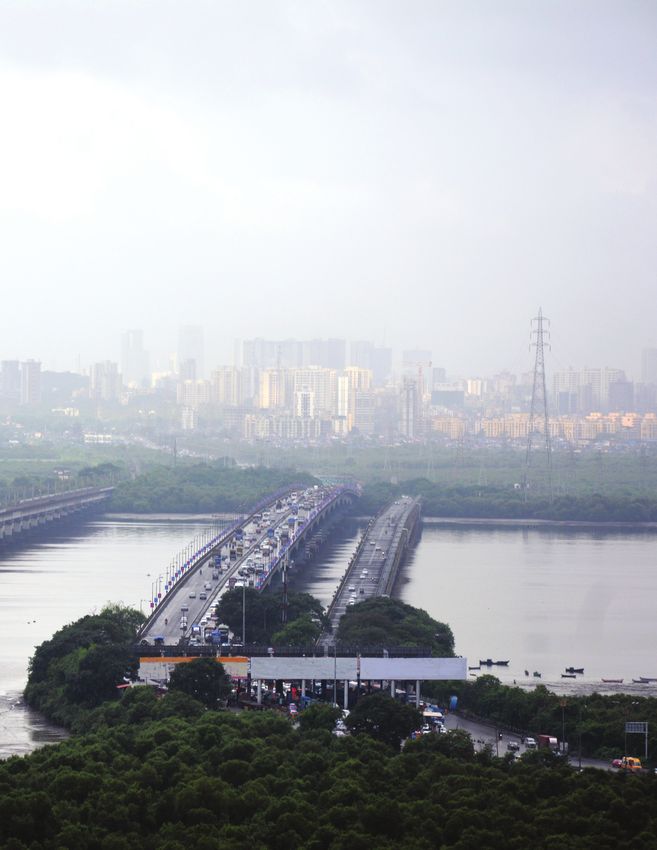
Navi Mumbai, the Study Area
Navi Mumbai is a planned township off the west coast of the Indian state of Maharashtra in the
Konkan Division. Since it is a planned city, its facilities are state of the art. Navi Mumbai has lived
up to expectations of absorbing the population shock of migrants from the megacity of Mumbai,
evident in the recorded population growth of more than 51% between 2001 and 2011.
                                                                                                          3
The Socioeconomic Spillovers of Sanitation: Sewage Treatment Plants in Navi Mumbai, India

         Navi Mumbai was designed to decongest Mumbai and is one of the largest
         planned cities in India.

         Conceived in 1972, Navi Mumbai was designed to decongest Mumbai and is one of the largest
         planned cities in India. In 1970, a public sector undertaking, the City and Industrial Development
         Corporation (CIDCO), was incorporated for the purpose of planning, developing, and maintaining
         the city of Navi Mumbai. Accordingly, CIDCO prepared a development plan for an estimated area
         of 343.70 square kilometers (km2) covering 95 villages from the Thane District to Raigad District.
         CIDCO planned to develop 14 nodes in Navi Mumbai, of which 8 nodes (Airoli, Ghansoli, Kopar
         Khairane, Vashi, Sanpada, Nerul, CBD Belapur, and Digha) were developed first to form the NMMC
         in 1991. The development of the industrial belt in Navi Mumbai attracted a fairly large population
         as it brought forth employment opportunities. Given the ease of connectivity to Mumbai, the city
         quickly became urbanized.

         NMMC jurisdiction is divided into eight zones from Digha in the north to Belapur in the south.
         Of the total 343.70 km2 area demarcated for Navi Mumbai, 108.63 km2 is under the purview of
         NMMC. According to Urban Health Post estimates for 2016–2017, the population of the NMMC
         area is around 1.5 million (1,469,302) with an average population density of about 13,525 persons
         per km2, which is 37% of Mumbai’s current average population density.

         Navi Mumbai lies in the tropical climate zone and has three seasons: summer, monsoon, and winter.
         Normal temperature in Navi Mumbai varies from 22°C to 36°C, while the maximum summer
         temperature ranges from 36°C to 41°C and the minimum winter temperature between 17°C and
         20°C. Average annual rainfall is 2,000–2,500 millimeters and humidity varies from 61% to 86%.
         Navi Mumbai’s ideal environment and proximity to Mumbai attracts industry and many people.

         Compared with other cities of similar population size, NMMC infrastructure gives its residents the
         assurance of 24/7 water supply, 100% sewerage connection and sewage treatment, a stormwater
         network, solid waste management system, and transport. Focusing our study on the technical
         efficiency and socioeconomic spillover effects of the sanitation program, we assess technical
         efficiency by measuring influent and effluent characteristics, and infer socioeconomic spillovers
         from other benefits. While we cannot attribute the spillover effects entirely to the sanitation
         program, the program has made major contributions to overall city improvement.

         NMMC infrastructure gives its residents the assurance of 24/7 water supply
         and 100% sewerage connection and sewage treatment.

4
The Socioeconomic Spillovers of Sanitation: Sewage Treatment Plants in Navi Mumbai, India

The Sanitation Program of the Navi Mumbai Municipal
Corporation Area
While developing the planned city of Navi Mumbai, CIDCO had demarcated land for various
types of infrastructure, especially for sewage treatment plants. Several nodes and sectors were
developed in the NMMC area, and prospective locations were identified for the construction of
sewage treatment plants.

In 1991, CIDCO constructed aerated lagoons in seven locations. Although they served the purpose
albeit not to the full extent, residents over time observed bad odor emanating from the treatment
plant, frequent breakdown of the aerators, and stormwater inlets causing lagoons to overflow
during the monsoon.

First, these lagoons occupied a large area, giving rise to a potentially large carbon footprint. Second,
the diameter of the installed 150-millimeter drain pipes was too small to serve the population (in
1991), causing the pipes to be blocked in several locations and making maintenance very difficult.
Third, only 70% of the developed nodes had an underground drainage system; in effect, the
drainage did not cover the remaining 30% which included the original villages (and those existing
before the NMMC area was developed). Hence, sewage from the area occupied by the 30% flowed
freely from individual household septic tanks to the open drains.

In 2000–2010, the central government launched a sanitation program for large cities under
JNNURM. Following the introduction of the National Urban Sanitation Policy in 2005, JNNURM
and NMMC prepared a detailed project report (DPR) with the following aims:

    1.   Provide a sewer network that would cover 100% of the total area, including the villages.
    2.   Treat collected sewage using the latest technique, thus reducing the carbon footprint of
         the STP area and meeting the national standards for treated effluent before letting the
         treated water out into the creek.

The NMMC appointed project management consultants, M/s Tandon Urban Solutions Pvt Ltd., to
prepare the DPR and obtained approval from the local councils. The DPR was approved in principle
by the central and state governments. Technical approval of the DPR was issued by the Ministry of
Urban Development and CPHEEO.

Thereafter, the government sought technical advice from higher technical institutes such as the
Indian Institute of Technology Bombay (IITB). IIT Bombay vetted the designs of the sewer network
and the STP and gave the following suggestions:

    1.   Drainage pipes for the sewer network should have a minimum diameter of 250 mm.
    2.   Perform conditional assessment studies prior to replacing damaged and frequently
         blocked area networks (Sourabh and Timbadiya 2018).
    3.   Install in STPs a self-cleansing velocity of 0.8 meters per second (m/s) for the sewage
         quantity of the designed period (30 years from 2008).
                                                                                                           5
The Socioeconomic Spillovers of Sanitation: Sewage Treatment Plants in Navi Mumbai, India

              4. Reduce NMMC’s carbon footprint and automate control of the STP for easy operation and
                 maintenance as well as for monitoring the influent and effluent sewage characteristics.

         The revised DPR was again tabulated before the local, state, and central governments for financial
         approval. The government approved the grant and NMMC started the work in 2009 and completed
         it in 2012. All seven STPs under this program began functioning simultaneously during 2012–2013.
         Residents felt the impact of the sanitation policy right after commissioning: there was no more
         odor in the vicinity of the STP, and the STP construction area was reduced, leaving more space for
         future STPs.

         Almost 100% of the sewage water generated by the NMMC area is treated
         before it is released in the creek.

         NMMC operates seven active STPs, all of which have secondary treatment facilities with an
         aggregate capacity of about 454 million liters per day (MLD). Table 1 describes the location,
         capacity, and secondary treatment technology of the STPs in Navi Mumbai. Under the “open-
         defecation-free city” policy, the government installed several public toilets within NMMC limits,
         especially in the area occupied by the floating population. Special suction units were installed to
         clean the sewage from public toilets—there are around 10 suction units, 7 units with a capacity of
         2,000 liters and 3 units of 6,000-liter capacity. These units collect sewage and dispose it to the
         treatment plants. The NMMC area currently generates an estimated 205 MLD of sewage, which
         are collected and treated. Almost 100% of sewage water is treated before it is released in the creek.

              Table 1: Location and Capacity of Sewage Treatment Plants in the NMMC Area
                                                                 Design Capacity        Secondary Treatment
          Serial No.              Node and Sector                    (MLD)                  Technology
          1              CBD Belapur located in sector 12               19
          2              Nerul located in sector 50                   100
          3              Sanpada located in sector 21                   37.5              Cyclic activated
          4              Vashi located in sector 18                   100                 sludge process
          5              Kopar Khairane located in sector 14            87.5             (SBR technology)

          6              Ghansoli located in sector 15                 30
          7              Airoli located in sector 18                   80
          Total                                                       454
         CBD = central business district, MLD = million liters per day, NMMC = Navi Mumbai Municipal Corporation,
         SBR = sequencing batch reactor.
         Source: NMMC (2017).

6
The Socioeconomic Spillovers of Sanitation: Sewage Treatment Plants in Navi Mumbai, India

Each STP is equipped with primary and secondary treatment facilities, which operate on the cyclic
activated sludge treatment technology using the advanced sequencing (sequential) batch reactor
(SBR) process. The system operates on a batch reactor mode, which eliminates all the inefficiencies
of the continuous process. The complete process takes place in a single reactor, which administers
the steps of biological treatment in sequential order. Water quality tests are conducted daily during
secondary treatment.

Technical Efficiency and Spillover Effects of the STPs
We analyzed the technical performance of STPs at Nerul (sector 50) in Navi Mumbai by first
collecting daily observed characteristics of influent and effluent treated sewage such as the flow
rate, BOD, COD, TSS, pH, DO, and temperature over a 5-year period from October 2013 to May
2018. The data were measured continuously using a detailed SCADA program and tested once
daily at labs inside the STPs. Once weekly the sewage characteristics were tested in government-
approved labs outside the STP. Figure 1 shows the observed raw and treated sewage characteristics
and the prescribed sewage standards for the sewage at the Nerul STP. From the time series plots
in Figure 1, we observe that the levels of effluent characteristics are well within the prescribed
standard limits, confirming that the plant is working efficiently.

Initially, we also performed a statistical analysis of influent and effluent characteristics. Tables 2
and 3 show the results of this statistical analysis such as the mean and standard deviation of the
influent and effluent sewage characteristics at the Nerul STP. Figure 1 is a pictorial analysis (or time
series), and Figure 2 shows box plots of the data.

Based on the analysis, we found that the maximum flow rate of raw sewage reached 93.6 MLD
during the monsoon period, and around 50% of the plant capacity during the non-monsoon
period. The high inflow rate during the monsoon period could be a result of heavier groundwater
infiltration or the mixing of stormwater through the manholes.

The biological oxygen demand (BOD) of raw sewage reached the highest levels during summer
(March–May) and are lowest during the high-intensity monsoon periods (June–September), which
may be attributed to the mixing of stormwater during monsoon periods and the consequent dilution
of the BOD concentration. The minimum BOD level of observed raw sewage was 48 milligrams
per liter (mg/l) and the maximum level was 213 mg/l. The maximum value of raw sewage BOD
was observed during March 2016 and the minimum value in October 2016. After treatment, the
minimum and maximum BOD levels of the treated sewage (effluent) were 2 mg/l and 5.8 mg/l,
respectively, which are well within the standard limits. In fact, the CPHEEO manual (CPHEEO
1993) suggested that the BOD level of treated effluent could be 10 mg/l, but NMMC wanted it to
be 5 mg/l. The maximum value of treated sewage BOD was 5.8mg/l, which was observed during
November 2018. Since NMMC had planned on using the treated water for industrial purposes and
also for non-human contact purposes such as gardening and road washing, the standard of 5 mg/l
is a good choice.

                                                                                                           7
8
                                                                                                                                                                                                                          pH
                                                                                                                                                                                                                                                                                                                 COD (mg/l)                                                                        Flow Rate (MLD)

                                                                                                                                                                                                  5.5
                                                                                                                                                                                                        6.0
                                                                                                                                                                                                              6.5
                                                                                                                                                                                                                    7.0
                                                                                                                                                                                                                          7.5
                                                                                                                                                                                                                                8.0
                                                                                                                                                                                                                                        8.5
                                                                                                                                                                                                                                                 9.0
                                                                                                                                                                                                                                                           9.5
                                                                                                                                                                                                                                                                                                         0
                                                                                                                                                                                                                                                                                                        50
                                                                                                                                                                                                                                                                                                       100
                                                                                                                                                                                                                                                                                                       150
                                                                                                                                                                                                                                                                                                       200
                                                                                                                                                                                                                                                                                                       250
                                                                                                                                                                                                                                                                                                       300
                                                                                                                                                                                                                                                                                                       350
                                                                                                                                                                                                                                                                                                       400
                                                                                                                                                                                                                                                                                                       450
                                                                                                                                                                                                                                                                                                       500
                                                                                                                                                                                                                                                                                                                                                                                               0
                                                                                                                                                                                                                                                                                                                                                                                                   20
                                                                                                                                                                                                                                                                                                                                                                                                        40
                                                                                                                                                                                                                                                                                                                                                                                                               60
                                                                                                                                                                                                                                                                                                                                                                                                                     80
                                                                                                                                                                                                                                                                                                                                                                                                                             100

                                                                                                                                                                                    29-Dec-13
                                                                                                                                                                                    29-Mar-14                                                                                            29-Dec-13                                                                               29-Dec-13
                                                                                                                                                                                    27-Jun-14                                                                                            29-Mar-14                                                                               29-Mar-14
                                                                                                                                                                                    25-Sep-14                                                                                            27-Jun-14                                                                               27-Jun-14
                                                                                                                                                                                    24-Dec-14                                                                                            25-Sep-14                                                                               25-Sep-14
                                                                                                                                                                                    24-Mar-15                                                                                            24-Dec-14                                                                               24-Dec-14
                                                                                                                                                                                    22-Jun-15                                                                                            24-Mar-15                                                                               24-Mar-15
                                                                                                                                                                                    20-Sep-15                                                                                            22-Jun-15                                                                               22-Jun-15
                                                                                                                                                                                                                                                                                         20-Sep-15                                                                               20-Sep-15
                                                                                                                                                                                                                                                                                                                                                                                                                           inlet

                                                                                                                                                                                    19-Dec-15
                                                                                                                                                                                                                                                                                                                                                                                                                           outlet

                                                                                                                                                                                                                                                                  (e)
                                                                                                                                                                                    18-Mar-16                                                                                            19-Dec-15                                                                               19-Dec-15

                                                                                                                                                                                                                                                                                                                                                            (c)
                                                                                                                                                                                                                                                                                                                                                                                                                                         (a)

                                                                                                                                                                                                                                inlet
                                                                                                                                                                                                                                                                                                                                                                                 18-Mar-16

                                                                                                                                                                                                                                outlet
                                                                                                                                                                                     16-Jun-16                                                                                           18-Mar-16

                                                                                                                                                                     Date (Daily)
                                                                                                                                                                                                                                                                                          16-Jun-16                                                                               16-Jun-16

                                                                                                                                                                                                                                                                          Date (Daily)
                                                                                                                                                                                                                                                                                                                                                                  Date (Daily)
                                                                                                                                                                                     14-Sep-16
                                                                                                                                Temperature in (ºC)                                 13-Dec-16                                                                                             14-Sep-16                                                                               14-Sep-16
                                                                                                                                                                                                                                                                                         13-Dec-16                                                                               13-Dec-16
                                                                                                                                                                                    13-Mar-17
                                                                                                                                                                                                                                                                                                                                                                                 13-Mar-17

                                                                                                                           24
                                                                                                                                26
                                                                                                                                     28
                                                                                                                                          30
                                                                                                                                               32
                                                                                                                                                    34
                                                                                                                                                         36
                                                                                                                                                                                      11-Jun-17                                                                                          13-Mar-17

                                                                                                                                                                                                                                                                                                                                         inlet
                                                                                                                                                                                                                                                                                           11-Jun-17                                                                               11-Jun-17
                                                                                                                                                                                    09-Sep-17

                                                                                                                                                                                                                                                                                                                                         outlet
                                                                                                                                                                                                                                                                                         09-Sep-17                                                                               09-Sep-17

                                                                                                                                                                                                                                prescribed lower limit
                                                                                                                                                                                                                                prescribed upper limit
                                                                                                                                                                                    08-Dec-17
                                                                                                             29-Dec-13                                                                                                                                                                   08-Dec-17                                                                               08-Dec-17
                                                                                                                                                                                    08-Mar-18
                                                                                                             29-Mar-14                                                                                                                                                                   08-Mar-18                                                                               08-Mar-18
                                                                                                             27-Jun-14
                                                                                                             25-Sep-14                                                                                                                                                                                                                   prescribed limit
                                                                                                             24-Dec-14
                                                                                                             24-Mar-15
                                                                                                             22-Jun-15
                                                                                                             20-Sep-15
                                                                                                             19-Dec-15

Source: Data from NMMC and figures drawn by authors.
                                                                                                                                                               (g)
                                                                                                             18-Mar-16
                                                                                                              16-Jun-16

                                                                                              Date (Daily)
                                                                                                              14-Sep-16
                                                                                                             13-Dec-16                                                                                                                                                                                            TSS (mg/l)                                                                            BOD (mg/l)
                                                                                                             13-Mar-17
                                                                                                               11-Jun-17                                                                                Dissolved Oxygen (DO) (mg/l)
                                                                                                                                                                                                                                                                                                       0
                                                                                                                                                                                                                                                                                                           50
                                                                                                                                                                                                                                                                                                                100
                                                                                                                                                                                                                                                                                                                      150
                                                                                                                                                                                                                                                                                                                            200
                                                                                                                                                                                                                                                                                                                                  250
                                                                                                                                                                                                                                                                                                                                          300
                                                                                                                                                                                                                                                                                                                                                     350
                                                                                                                                                                                                                                                                                                                                                                                               0
                                                                                                                                                                                                                                                                                                                                                                                                   50
                                                                                                                                                                                                                                                                                                                                                                                                         100
                                                                                                                                                                                                                                                                                                                                                                                                               150
                                                                                                                                                                                                                                                                                                                                                                                                                      200
                                                                                                                                                                                                                                                                                                                                                                                                                                    250

                                                                                                             09-Sep-17

                                                                                                                                                                                                  –1
                                                                                                                                                                                                        0
                                                                                                                                                                                                              1
                                                                                                                                                                                                                    2
                                                                                                                                                                                                                        3
                                                                                                                                                                                                                            4
                                                                                                                                                                                                                                   5
                                                                                                                                                                                                                                            6
                                                                                                                                                                                                                                                     7
                                                                                                                                                                                                                                                             8
                                                                                                             08-Dec-17
                                                                                                             08-Mar-18                                                                 25-Sep-14                                                                                         29-Dec-13                                                                               29-Dec-13

                                                                                                                                                      inlet
                                                                                                                                                      outlet
                                                                                                                                                                                       24-Dec-14                                                                                         29-Mar-14                                                                               29-Mar-14
                                                                                                                                                                                                                                                                                                                                                                                                                      inlet

                                                                                                                                                                                                                                                                                         27-Jun-14                                                                               27-Jun-14
                                                                                                                                                                                                                                                                                                                                                                                                                      outlet

                                                                                                                                                                                       24-Mar-15
                                                                                                                                                                                                                                                                                         25-Sep-14                                                                               25-Sep-14
                                                                                                                                                                                       22-Jun-15                                                                                         24-Dec-14                                                                               24-Dec-14
                                                                                                                                                                                       20-Sep-15                                                                                         24-Mar-15                                                                               24-Mar-15
                                                                                                                                                                                                                                                                                                                                                                                                                      prescribed limit

                                                                                                                                                                                       19-Dec-15                                                                                         22-Jun-15                                                                               22-Jun-15
                                                                                                                                                                                                                                                                                         20-Sep-15                                                                               20-Sep-15
                                                                                                                                                                                       18-Mar-16
                                                                                                                                                                                                                                                                                         19-Dec-15                                                                               19-Dec-15
                                                                                                                                                                                        16-Jun-16
                                                                                                                                                                                                                                                                                                                                                                                                                                          (b)

                                                                                                                                                                                                                                                                                                                                                            (d)

                                                                                                                                                                                                                                                                                         18-Mar-16                                                                               18-Mar-16

mg/l = milligrams per liter, STP = sewage treatment plant, TSS = total suspended solids.
                                                                                                                                                                                                                                                                  (f )

                                                                                                                                                                                        14-Sep-16                                                                                         16-Jun-16                                                                               16-Jun-16
                                                                                                                                                                                                                                                                                                                                                                  Date (Daily)

                                                                                                                                                                                                                                                                         Date (Daily)

                                                                                                                                                                        Date (Daily)
                                                                                                                                                                                       13-Dec-16                                                                                          14-Sep-16                                                                               14-Sep-16
                                                                                                                                                                                                                                                                                         13-Dec-16                                                                               13-Dec-16
                                                                                                                                                                                       13-Mar-17
                                                                                                                                                                                                                                                                                         13-Mar-17                                                                               13-Mar-17
                                                                                                                                                                                                                                                                                                                                        inlet

                                                                                                                                                                                         11-Jun-17                                                                                         11-Jun-17                                                                               11-Jun-17
                                                                                                                                                                                                                                                                                                                                        outlet

                                                                                                                                                                                       09-Sep-17                                                                                         09-Sep-17                                                                               09-Sep-17
                                                                                                                                                                                       08-Dec-17                                                                                         08-Dec-17                                                                               08-Dec-17
                                                                                                                                                                                                                                                                                         08-Mar-18                                                                               08-Mar-18
                                                                                                                                                                                       08-Mar-18
                                                                                                                                                                                                                                                         inlet
                                                                                                                                                                                                                                                                                                                                        prescribed limit

                                                                                                                                                                                                                                                         outlet
                                                                                                                                                                                                                                                                                                                                                                                                                                                                                                                                      The Socioeconomic Spillovers of Sanitation: Sewage Treatment Plants in Navi Mumbai, India

                                                                                                                                                                                                                                                                                                                                                                                                                                                Figure 1: Influent (Raw) and Effluent (Treated) Sewage Characteristics at Nerul STP

BOD = biological oxygen demand, COD = chemical oxygen demand, MLD = million liters per day,
The Socioeconomic Spillovers of Sanitation: Sewage Treatment Plants in Navi Mumbai, India

                                                Figure 2: Box Plots of Raw Sewage (Influent)
                                                and Treated Sewage (Effluent) at Nerul STP
                                                    a)                                                                                                               b)
                                                                                                                         250
                     100                      inflow (MLD)                     outflow (MLD)                                                                                                inlet
                                                                                                                                                                                            outlet
                                                                                                                        200
                     80
   Flow Rate (MLD)

                                                                                                          BOD (mg/l)
                     60                                                                                                    150

                     40                                                                                                   100

                     20
                                                                                                                                50
                       0
                                                                                                                                      0
                     –20
                                 inflow (MLD)                               outflow (MLD)                                                                    inlet                outlet

                                                    c)                                                                                                               d)
                       500                                                                                             350
                                                                                          inlet                                                                                            inlet
                                                                                          outlet                     300                                                                   outlet
                       400
                                                                                                                       250
          COD (mg/l)

                                                                                                        TSS (mg/l)

                       300
                                                                                                                     200
                       200                                                                                              150

                       100                                                                                             100
                                                                                                                             50
                            0
                                                                                                                                    0
                      –100                                                                                             –50
                                      inlet                                    outlet                                                                    inlet                    outlet

                                                    e)                                                                                                               f)

                                                                                       inlet                                                8
                           8.0                                                                                                                                            inlet        outlet
                                                                                                                 Dissolved Oxygen (mg/l)

                                                                                       outlet                                               7
                                                                                                                                            6
                           7.5
                                                                                                                                            5
                           7.0                                                                                                              4
                 pH

                                                                                                                                            3
                           6.5                                                                                                              2
                                                                                                                                            1
                           6.0
                                                                                                                                            0
                                                                                                                                           –1
                           5.5
                                      inlet                                   outlet                                                                     inlet                outlet

                                                                                                   g)
                                                                       36
                                                                                                                     inlet                          outlet
                                                                       34
                                                    Temperature (ºC)

                                                                       32

                                                                       30

                                                                       28

                                                                       26

                                                                       24

                                                                                         inlet                                             outlet

  BOD = biological oxygen demand, COD = chemical oxygen demand, MLD = million liters per day,
  mg/l = milligrams per liter, STP = sewage treatment plant, TSS = total suspended solids.
  Source: Data from NMMC and figures drawn by authors.

                                                                                                                                                                                                     9
The Socioeconomic Spillovers of Sanitation: Sewage Treatment Plants in Navi Mumbai, India

                         Table 2: Raw Sewage (Influent) Characteristics of the Nerul STP
                                                Standard                                Minimum       Maximum      Prescribed
           Parameters               Mean        Deviation    Skewness       Kurtosis     Value         Value         Value
           Flow rate (MLD)          38.26         11.23          1.19          6.37         0.03        94.15          100
           BOD (mg/l)              125.89         21.34         0.28           3.52       48           213            250
           COD (mg/l)             294.45         52.97          0.010          2.42       139          432            400
           TSS (mg/l)              165.02        20.21         (0.19)          6.02       94           312            200
           pH                        6.909         0.21       (12.19)       286.37          6             7.60       5.5-9.0
           DO (mg/l)                 0.421         0.28         0.52           4.31         0             1.80
           Temperature ( C)
                          o
                                    29.098         1.76         0.65           5.04       24.4          40.63
          ( ) = negative value, BOD = biological oxygen demand, COD = chemical oxygen demand, DO = dissolved oxygen,
          MLD = million liters per day, mg/l = milligrams per liter, STP = sewage treatment plant, TSS = total suspended solids.
          Source: Data from NMMC Sewerage Department.

                        Table 3: Treated Sewage (Effluent) Characteristics at Nerul Pond
                                                Standard                                 Minimum      Maximum      Prescribed
           Parameters                Mean       Deviation     Skewness      Kurtosis      Value        Value         Value
           Flow rate (MLD)           38.75        11.57          1.23          6.19         0.49        93.67          100
           BOD (mg/l)                 3.73         0.47         0.56           3.59         2             5.8
The Socioeconomic Spillovers of Sanitation: Sewage Treatment Plants in Navi Mumbai, India

The STP is working well and is treating the sewage at 100% efficiency.

maintained the TSS and pH characteristics of the effluent within the design limit. For dissolved
oxygen (DO), the maximum and minimum DO levels of raw sewage were 0 mg/l and 1.80 mg/l,
respectively; and after treatment the levels were 2.43 mg/l and 6.94 mg/l, respectively. The mean
value for temperature was 29.09oC. The minimum and maximum temperatures of the influent
sewage were 24.4oC and 40.63oC, respectively, while the mean temperature of treated sewage was
29.19oC, while the minimum and maximum temperatures were 24.1oC and 34.8oC, respectively.
Although there is no standard mentioned, the temperatures are well within the air temperature
prevailing in NMMC. Based on the statistical analysis of the raw sewage (influent) and treated
sewage (effluent) characteristics of the STP at Nerul in NMMC, we can conclude that the STP is
working well and is treating the sewage at 100% efficiency according to the prescribed standards.
We conducted the above analysis for one STP since all other STPs are using the same treatment
process and are also monitored using the SCADA system.

After treatment, the treated sewage is discharged into the creek. Before discharging the water from
STPs into the creek, NMMC monitors water quality regularly and sends reports to the Maharashtra
Pollution Control Board (MPCB), a government organization responsible for the upkeep of the
environmental condition of the entire Maharashtra. This type of monitoring helps to check the
levels of various parameters, which affect water quality as well as the efficiency of treatment plants.
Table 4 presents the average performance of the raw and treated sewage in all other STPs in Navi
Mumbai, clearly indicating that all parameters are well within the standard limits until 2016–2017.

 Table 4: Average Performance and Efficiency of STPs in the NMMC Area, 2013–2018
                                      pH             BOD (mg/l)           COD (mg/l)            TSS (mg/l)

 Serial                              6.5–9
The Socioeconomic Spillovers of Sanitation: Sewage Treatment Plants in Navi Mumbai, India

          Additional Policy Decisions Made After the Success
          of STPs in NMMC
          Realizing the need to conserve water, NMMC adopted a policy to reuse the treated sewage water,
          especially where human contact is absent such as in industries and gardening. This additional
          policy has fetched monetary benefits, which will be used for the maintenance of existing STPs.

          After implementing the STPs and the sewer network, NMMC adopted the “open-defecation-free
          city” policy, which also applies to the floating populations.

          Reuse of Treated Wastewater
          As mentioned earlier, NMMC had required the mandatory reuse of treated wastewater and had
          given incentives for industries to comply. It also plans to meet the water demand for various
          secondary applications in the city.

          As a pilot project for secondary treatment, 40 MLD of water was again treated using a tertiary
          process, for supply to large industries. NMMC proposed the commissioning of a direct pipeline
          to directly transfer treated sewage water from the Nerul STP to industries, thus reducing
          transportation cost. In addition to selling the treated sewage water to industries, NMMC uses the
          treated sewage water for the following purposes:

              •   Supplied to CIDCO for watering plantations along road medians;
              •   Supplied to the NRI Complex at Seawoods for gardening purposes;
              •   Supplied to construction sites for construction activity; and
              •   Used for watering the lawns of NMMC gardens (several new public parks have been
                  created).

          Improvement in Biodiversity of the NMMC Area
          NMMC’s biodiversity has improved considerably since the flow of untreated sewage into creeks
          and water bodies has been completely stopped. Navi Mumbai has an abundant green cover ranging
          from forest patches to mudflats and mangroves in the coastal region, making it an ideal spot for bird-
          watching. Different species of water birds, local migrants, and passage migrants can be spotted in
          several areas. During 2016–2017, more than 168 species of birds many of them migratory in nature
          were observed in key biodiversity hotspots in parts of the Thane Creek and the Uran Creek. Nerul’s
          Talave, Airoli, and Ghansoli mudflats are also home to some exotic birds. Ornithologists have also

          Ornithologists have observed a substantial rise in bird population.

12
The Socioeconomic Spillovers of Sanitation: Sewage Treatment Plants in Navi Mumbai, India

observed a substantial rise in bird population and attribute the reason for this to the availability of
sufficient food and conducive habitat as a consequence of cutting the flow of untreated sewage
water into these areas.

Air Quality
There are four continuous ambient air quality monitoring stations currently installed, at Airoli,
Kopar Khairane, Turbhe, and Nerul. Table 5 shows the monitored air quality in these stations.
The air quality in Kopar Khairane, Airoli, and Vashi has improved considerably because the large-
scale STP reduced the odor and emission of a large quantity of nitrogen dioxide (NO2) from the
aerated lagoons. But the rising number of settlements and consequent increase of vehicles have
produced more than the permissible limits of nitrogen oxide (NOx), carbon monoxide (CO), and
PM2.5 concentrations.

Socioeconomic Spillovers
To study socioeconomic spillovers, we first analyzed population growth in the area. NMMC’s
estimated population in 2016–2017 was about 1.469 million, which is 1.4% more than the 2015
survey data from Urban Health Post (UHP), NMMC’s health department. The population increase
coupled with the rise of industrial, educational hub, economic activities, and infrastructure
are major driving forces of the city’s growth. Figure 3 shows NMMC’s steady growth during
2012–2016. NMMC reports that it has reached its saturated level in terms of human settlement,
and that CIDCO has started developing the nearby area. But infrastructure and other facilities in
the left-over areas (near the STPs) have been improved.

        Table 5: Annual Trend in Concentration of NOx at CAAQMS in Navi Mumbai
                            Kopar Khairane            Airoli                Vashi               Turbhe
 Year                          (µg/m3)               (µg/m3)               (µg/m3)              (µg/m3)
 Annual standard                  40                    40                   40                    40
 2009–2010                        NA                  82.69                  57                   NA
 2010–2011                        NA                  66.56                  45                   NA
 2011–2012                      79.34                 59.13                  43                   NA
 2012–2013                      80.34                 77.69                  56                    22
 2013–2014                      63.83                 46.38                  44                    30
 2014–2015                      42.53                 27.25                                        35
                                                                        Site shifting
 2015–2016                      57.40                 42.35                                      33.30
                                                                       under process
 2016–2017                       27.72                39.74                                      28.61
CAAQMS = continuous ambient air quality monitoring stations, NA = not available, NOx = nitrogen oxide.
Source: NMMC (2017).

                                                                                                          13
The Socioeconomic Spillovers of Sanitation: Sewage Treatment Plants in Navi Mumbai, India

                                                             Figure 3: Population Growth in Navi Mumbai, 2012–2016

                                                            1,480,000

                                                            1,470,000
                      Population Size (number of persons)

                                                            1,460,000

                                                            1,450,000

                                                            1,440,000

                                                            1,430,000

                                                            1,420,000
                                                                        2011   2012   2013   2014    2015   2016     2017
                                                                                             Years

             Source: Urban Health Post Survey, Navi Mumbai Municipal Corporation.

          Figure 4 shows a distinct 25% increase in the number of properties in NMMC since
          2009–2010. In 2016–2017, residential properties recorded the highest number at 82% or a total
          of 307,710 properties, followed by commercial buildings with a 17% share, and Maharashtra
          Industrial Development Corporation (MIDC) with the least share of all at 1%. A land-use map in
          2003 and 2016 of the Nerul STP clearly indicated a substantial change in land use, because after
          constructing the STP in 2009–2012 the odor had reduced, the scenario had changed, people
          started developing the area, and now 8 years later, the area around the STP has become one of
          the well-sought areas in NMMC. Figure 5 shows the change in population and property growth
          in Navi Mumbai.

          The area around the sewage treatment plant has become one of the well-
          sought areas in NMMC.

14
The Socioeconomic Spillovers of Sanitation: Sewage Treatment Plants in Navi Mumbai, India

    Figure 4: Property Development Trend in Navi Mumbai, Over the Last 8 Years

                                                                  250,000

                                                                  240,000
                                           Number of Properties

                                                                  230,000

                                                                  220,000

                                                                  210,000

                                                                  200,000

                                                                  190,000

                                                                        2008   2009     2010      2011   2012   2013   2014     2015   2016   2017
                                                                                                            Years

  Source: Town Planning Department, Navi Mumbai Municipal Corporation.

                                                                  Figure 5: Population and Property Growth in Navi Mumbai

                                           250,000                             Number of Residential Properties
                                                                               Population                                                     1,470,000

                                           240,000
        Residential Properties in Number

                                                                                                                                              1,460,000

                                           230,000
                                                                                                                                                          Population in Number

                                                                                                                                              1,450,000
                                           220,000

                                           210,000                                                                                            1,440,000

                                           200,000
                                                                                                                                              1,430,000

                                           190,000
                                                                                                                                             1,420,000
                                                                    2008    2009   2010    2011     2012   2013   2014   2015     2016   2017
                                                                                                       Years

  Source: NMMC (2017).

                                                                                                                                                                                 15
The Socioeconomic Spillovers of Sanitation: Sewage Treatment Plants in Navi Mumbai, India

          Health and Hygiene Improvement in the NMMC Area
          The second spillover parameter we studied after implementation of the sanitation program is the
          health condition of the residents in the area served by the STPs. From the Health Department of
          NMMC we collected data pertaining to water-related diseases.

          Waterborne diseases are illnesses caused by intake of water contaminated with animal and human
          feces, which contains harmful or pathogenic microorganisms. These diseases are commonly found
          in tropical and subtropical regions where many people have no access to safe drinking water and
          live in unhygienic conditions. These diseases contribute to around 17% of the total global burden of
          infectious diseases. Malaria is the most common of these diseases, and dengue is one of the fastest
          growing vector-borne diseases in the world. Over the last decade (2000 to 2009), water-related
          health issues have become more and more complex, new water-related diseases have emerged, and
          existing ones have reemerged. Table 6 shows the total number of persons affected by waterborne
          diseases over the NMMC area, and Figure 6 shows the trend in the number of waterborne diseases.
          The number of affected persons has reduced drastically compared with the years 2008–2013.

          Table 6 shows a drastic reduction in the number of cases for gastrointestinal diseases during
          2014–2015 and 2015–2016. There is almost a 90% decrease (35 cases) in the number of cases
          when compared with the recorded cases during 2015 (351 cases). Norovirus is known to cause
          gastroenteritis which commonly occurs when consuming contaminated food and water. It is also
          contagious and may be contracted by direct contact with an infected person. Figure 6 records
          a drastic decrease of dysentery cases, by almost 98%, with the number of cases dropping from

                      Table 6: Persons Affected by Waterborne Diseases in NMMC, 2009–2017
                                                            Patients per Node
                               2009–   2010–      2011–     2012–      2013–     2014–     2015–       2016–
           Area                 2010    2011      2012       2013      2014       2015     2016         2017
           CBD Belapur           14       21        10         8          5         8         12           2
           Karave                21       27         7         6          1         4          8          12
           Nerul                23       20          4         8          6         5         12           1
           Nerul II              21       32        15          5         7         4         16           0
           Shiravane            23        29        17          5        51        42         33           2
           Sanpada               8        24        15          7         6        10         21           1
           Indranagar           48        37        35        26         29        32         36           5
           Turbhe                81      40         63         6         25        30         55           8
           Vashi                22        19        16        22         18        12         14           3
                                                                                           continued on next page

16
The Socioeconomic Spillovers of Sanitation: Sewage Treatment Plants in Navi Mumbai, India

Table 6 continued
                                                        Patients per Node
                     2009–       2010–       2011–      2012–       2013–      2014–       2015–     2016–
 Area                 2010        2011       2012        2013       2014        2015       2016       2017
 Juhugaon               20          12         28         33            1          1            26     7
 Khairne                81         38          23         28          52         48             41     11
 Mahape                 56          16         63         37          24         26             28      1
 Pawane                  8          15          7         28          18          12            18     4
 Ghansoli               18         32          38          21         18          16            34     4
 Rabade                  3           4          6           8         13          11            12      1
 Katkaripada            21         20           2           2          0           5            19     2
 Airoli                 29         22          86         40          25         25             34      1
 Chichpada              50          11          8           3          3           2            12     0
 Digha                   11         14         13           9         10           8            21      1
 Nagaon                  0         –           –           –           2           0            0      0
 Ilthanpada              0          16         16           5          4           1            16      1
 Nocil Naka              0           0          0           0          4           0             8     0
 Total                 558        449        472         307         318        302         476       67
– = not available, CBD = central business district, NMMC = Navi Mumbai Municipal Corporation.
Source: NMMC (2017).

65 cases in 2015–2016 to only 1 case in 2016–2017. On the other hand, hepatitis-B cases doubly
increased from 6 cases in 2015–2016 to 12 cases in 2016–2017, while cases of typhoid fever
declined from 54 to 19, respectively, during the same period. A decreasing trend is also observed
for reported malaria cases in 2014–2015 and 2015–2016. The number of cases decreased from
396 in 2013–2014 to 242 in 2016–2017. Dengue is spread throughout the tropics and the intensity
of its occurrence is influenced by rainfall, lack of hygiene and sanitation, and unplanned urban
growth. Good practices, such as covering and periodic cleaning of domestic water storage tanks
and eliminating mosquito breeding sites through proper environmental management, could
prevent the spread. The number of dengue fever cases has dropped (54) in 2016–2017, registering
an almost 29% reduction from the number of recorded cases during 2015–2016.

                                                                                                             17
The Socioeconomic Spillovers of Sanitation: Sewage Treatment Plants in Navi Mumbai, India

             Figure 6: Trend in Number of Waterborne Diseases in Navi Mumbai, 2011–2016

                                          400        Dengue
                                                     Dysentery
                                          350        Gastro
                                                     Hepatitis-B
                                          300        Malaria
                                                     Typhoid
                                          250
                        Number of Cases

                                          200

                                          150

                                          100

                                           50

                                           0
                                            2010   2011        2012   2013          2014   2015   2016   2017
                                                                             Year

             Source: NMMC (2017).

          Environmental Indices
          NMMC has calculated three indices annually from the year 2000—the Environmental Quality
          Index (EQI), the Urban Infrastructure Index, and the Quality of Life Index. NMMC also calculated
          the Environmental Performance Index, which the Maharashtra Pollution Control Board (MPCB) has
          endorsed. Overall improvement of EQI is attributed to enhanced air and water quality, sanitation
          facility, water supply, effective segregation and maximum recycling of solid waste, protection of
          mangroves, and continuous monitoring of water quality, among others.

          Lessons Learned from the Implementation of a Large
          STP in a Large City such as NMMC
          Initially, the sewage network and aerated lagoons used to treat sewage in 1991 to 2009 did not
          cover the entire NMMC area. The sewage area emitted bad odors especially during the non-
          monsoon periods. During the monsoon periods, heavy rains and consequently the stormwater inlet
          filled the lagoons to overflowing, with the non-sewer area dumping sewage into stormwater drains
          which were in turn connected to the creeks. Thus, aside from polluting water bodies and the creek
          environment, the old sanitation method had the following drawbacks:

18
The Socioeconomic Spillovers of Sanitation: Sewage Treatment Plants in Navi Mumbai, India

    1. The method of treating sewage used conventional aeration techniques, which did not
       meet treatment quality standards. Consequently, monitoring agencies such as MPCB and
       CPCB issued warning letters to NMMC.
    2. A foul odor was emitted in and around the STP area.
    3. The large area under the STP generated a large carbon footprint.
    4. Many sewage pipes were blocked or damaged because of the small size of their diameter.

Motivated by the JNNURM policy, NMMC in 2006 adopted the policy of 100% sanitation and
in 2008–2009 submitted the project report containing a detailed design of networks and STPs
with advanced biological reactors. The central government approved the design in principle and
agreed to fund it. And the central government, state government, and the NMMC Corporation
(local government) all provided project funding.

During the evaluation, NMMC asked IIT Bombay, a technical institute, to give feedback on technical
issues. The evaluation found that in several locations, the size of the sewage pipe measured a
minimum of 150 millimeters (mm), and the design did not meet the standard self-cleansing velocity
of 0.8 m/s. During the field visit, IIT Bombay and NMMC officials found that NMMC is a highly
populated and dense area and the 150-millimeter pipes were too small and disproportionate to the
population size of the settlement being served. The evaluation suggested therefore that sewage
pipes should have a diameter of at least 250 millimeters. Local authorities obtained approval
to apply the recommended diameter size, and as a result, maintenance of sewage blocking has
reduced. The technical recommendation has helped decision makers in the urban development
ministry to approve the use of pipes 200–250 mm in diameter as the minimum size depending
on the population size. IIT Bombay proposed that effluent quality be measured manually to cross
validate the SCADA-measured influent and effluent qualities.

NMMC has adopted the policy of using SCADA to measure water quality daily and perform manual
measurement once weekly. Because of NMMC’s success, several other corporations also followed
the same procedure. This sanitation project was completed in 2012 and has been in service from
2013 to date.

In general, NMMC’s experience offers the following lessons:

    1.   Adopt a sanitation policy in collaboration with the central, state, and local bodies in order
         for a sanitation program to succeed; this type of collaboration also helps to obtain the
         required funds.
    2.   The detailed project report (DPR) has to be prepared with sound technical knowledge
         and should contain minute details of the design (external consultants may be involved).
         The DPR can be vetted by a higher technical institute and can be verified by the technical
         advisory committee. This will help to identify appropriate technology for treatment,
         minimize cost, and reduce the carbon footprint.
    3.   Identify the appropriate team to implement (or execute) and monitor the project, which
         may entail the selection of motivated local engineers.

                                                                                                         19
The Socioeconomic Spillovers of Sanitation: Sewage Treatment Plants in Navi Mumbai, India

              4. Be prepared to adopt additional policies such as the open-defecation-free city, reuse of
                 treated sewage water, use of the continuous measurement policy, and new technology to
                 reduce carbon footprint.
              5. Train technical staff to keep them updated with the knowledge required for the future
                 maintenance of sanitation programs.

          The time series data analysis reveals that the efficiency of the STPs is at 100%.

          Conclusions
          This case study presents the socioeconomic spillover effects and technical evaluation of the
          sanitation program at the Navi Mumbai Municipal Corporation (NMMC) area in Navi Mumbai,
          Maharashtra, India. The NMMC area has seven STPs which treats around 454 MLD using the
          sequencing batch reactor technology. We collected data pertaining to sewage characteristics such
          as pH, temperature, biological oxygen demand (BOD), chemical oxygen demand (COD), total
          suspended solids (TSS), and dissolved oxygen (DO) through the SCADA program to analyze the
          STPs’ technical efficiency. The time series data analysis reveals that the efficiency of the STPs is
          at 100%.

          To study the STPs’ spillover effects, we collected from various departments of the NMMC office
          data pertaining to population statistics, public health by studying the number of people affected by
          waterborne diseases, land values, number of settlements, air quality, and other parameters.

          Our study revealed positive effects such as improvements in public health, hygiene condition,
          and air quality; monetary benefits in the sale of treated sewage; and increase in the number of
          settlements near the STP areas. Overall, the socioeconomic spillover effects of the NMMC’s
          sanitation program are quantifiable and clearly visible in the area.

          The NMMC experience offers useful lessons for policy makers to adopt in designing and
          implementing similar large-scale sanitation projects not only in other parts of the state but also in
          the country as a whole.

             This case study has been developed solely as a basis for class discussion. It is not intended to
             serve as a historical record, a source of primary data, or an illustration of effective or ineffective
             management.

20
The Socioeconomic Spillovers of Sanitation: Sewage Treatment Plants in Navi Mumbai, India

References
Ahmed, I., D. Ofori-Amanfo, E. Awuah, and F. Cobbold. 2018. Performance Assessment of the
    Rehabilitated Mudor Sewage Treatment Plant at James Town Accra-Ghana. Journal of Water
    Resources and Protection. 10: 725–739.

Belhaj, D., I. Jaabiri, N. Turki, C. Azri, M. Kallel, and H. Ayadi. 2014. Descriptive and Multivariable
     Analysis of the Water Parameters Quality of Sfax Sewage Treatment Plant after Rehabilitation.
     IOSR Journal of Computer Engineering. 16: 81–91.

Bhave, P., and S. Rahate. 2018. Impact of Redevelopment Projects on Waste Water Infrastructure.
     Journal of Institution of Engineers India (Series A). 99(3): 503–509.

Central Pollution Control Board (CPCB). 2007. Evaluation of Operation and Maintenance of
     Sewage Treatment Plants in India-2007. Control of Urban Pollution Series. CUPS/68/2007.
     New Delhi: Central Pollution Control Board, Ministry of Environment and Forests.

Central Public Health and Environmental Engineering Organisation (CPHEEO). 1993. Manual on
     Sewerage and Sewage Treatment. New Delhi: Ministry of Urban Development.

Hamed, M., M. G. Khalafallah, and E. A. Hassanein. 2004. Prediction of Wastewater Treatment
    Plant Performance Using Artificial Neural Network. Environmental Modeling and Software.
    19: 919–928.
Hanbay, D., I. Turkoglu, and Y. Demir. 2008. Prediction of Wastewater Treatment Plant Performance
    on Wavelet Packet Decomposition and Neutral Networks. Expert Systems with Applications.
    34: 1038–1043.

Hegazy, M. H., and M. A. Gawad. 2016. Measuring and Evaluating the Performance of a Wastewater
    Treatment Plant. Proceedings of the World Congress on Civil, Structural, and Environmental
    Engineering (CSEE’16), AWSPT 111-1 to AWSPT 111-5. Prague, Czech Republic. 30–31
    March 2016.
Kulakarni, B., R. V. Wanjule, and H. H. Shinde. 2018. Study on Sewage Quality from Sewage
     Treatment Plant Based at Vashi, Navi Mumbai. Science Direct, Materials Today: Proceedings.
     5: 1859–1863.

Navi Mumbai Municipal Corporation (NMMC). 2017. Environmental Status Report of Navi
     Mumbai Municipal Corporation. Internal Report. Navi Mumbai, India.

Sourabh, N., and P. V. Timbadiya. 2018. Hydraulic and Condition Assessment of Existing Sewerage
     Network: A Case Study of an Educational Institute. Journal of Institution of Engineers India
     (Series A). 99(3): 555–563.

United Nations Environment Programme (UNEP). 1991. Environmental Impact Assessment:
     Sewage Treatment Plant for Port Sais. UNEP Regional Seas Reports and Studies. No. 133.

                                                                                                          21
The Socioeconomic Spillovers of Sanitation: Sewage Treatment Plants in Navi Mumbai, India

 Asian Development Bank Institute
 ADBI, located in Tokyo, is the think tank of the Asian Development        ADBI encourages printing or copying information exclusively for personal
 Bank (ADB). Its mission is to identify effective development strategies   and noncommercial use with proper acknowledgment of ADBI. Users
 and improve development management in ADB’s developing member             are restricted from reselling, redistributing, or creating derivative works
 countries.                                                                for commercial purposes without the express, written consent of ADBI.
 The ADBI Development Case Study Series presents public policy             Asian Development Bank Institute
 initiatives for achieving the Sustainable Development Goals in Asia       Kasumigaseki Building 8F
 and the Pacific. It provides a timely resource for discussion-based       3-2-5 Kasumigaseki, Chiyoda-ku
 learning among policy makers in ADBI’s capacity-building and training     Tokyo 100-6008
 programs.                                                                 Japan
                                                                           Tel: +813 3593 5500
                                                                           www.adbi.org

22
You can also read