The Status, Implications and Challenges of Business Vulnerability In South Africa and Its Potential Impact on Sustainable Business and Economic ...
←
→
Page content transcription
If your browser does not render page correctly, please read the page content below
The Status, Implications
and Challenges of
Business Vulnerability In
South Africa and Its
Potential Impact on
Sustainable Business
and Economic Growth.

     Economic and Business Research Division Roasting Chamber Session – Virtual Event
                                                  Bureau of Market Research (Pty) Ltd
                                                                  13 September 2021
                                                                        10h00-11h00
                                                                   Prof Paul Kibuuka
                                                                   Mr Arthur Risenga
Table of Contents

• Trends in Global Risks and Major Drivers
• International, National and Subnational Framework for Assessing Vulnerability
• Global Business Vulnerabilities, Transmission, Causes and Implications
• South Africa Retail Sector Vulnerabilities in Sales, Consumption and Expenditure
• South Africa National Business Vulnerabilities Trends by Sector and Size
• South Africa Provincial Business Vulnerabilities Challenges and Implications
• South Africa Municipal Business Vulnerabilities, Size, Sector, Challenges and Implications, Status, Trends and
  Peculiarities
• Forecast of South Africa Business Vulnerabilities Potential Impact on Sustainable Business and Economic Growth
• Conclusion
“Trends in Global Risks, Impact, Likelihood and Drivers”
                              Sources and Publications

      Economist Intelligence Unit              Bureau of Market Research          Investec South Africa
      Statistics South Africa                  Allianz Global Corporate           World Health Organisation
      World Economic Forum                     African Development Bank           South African Reserve Bank
      World Bank                               International Monetary Fund        South African Revenue Services (SARS)
     MACROECONOMIC AND RETAIL TRADE SALES FORECAST FOR SOUTH AFRICA, 2021 – June 2021

     ESTIMATING AND FORECAST OF THE SIZE OF THE FORMAL BUSINESS SECTOR OF SOUTH AFRICA, 2020/21 – August 2021

     CoT CUSTOMER SATISFACTION SURVEY, 2021 – July 2021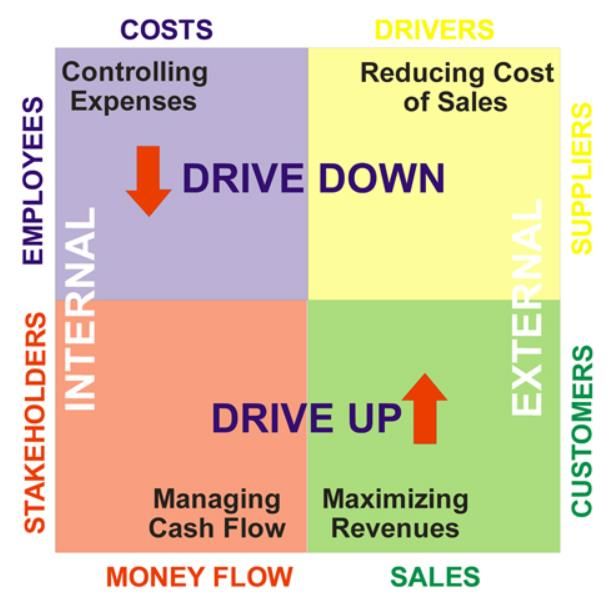
Trends in Global Risks and Major Drivers
“
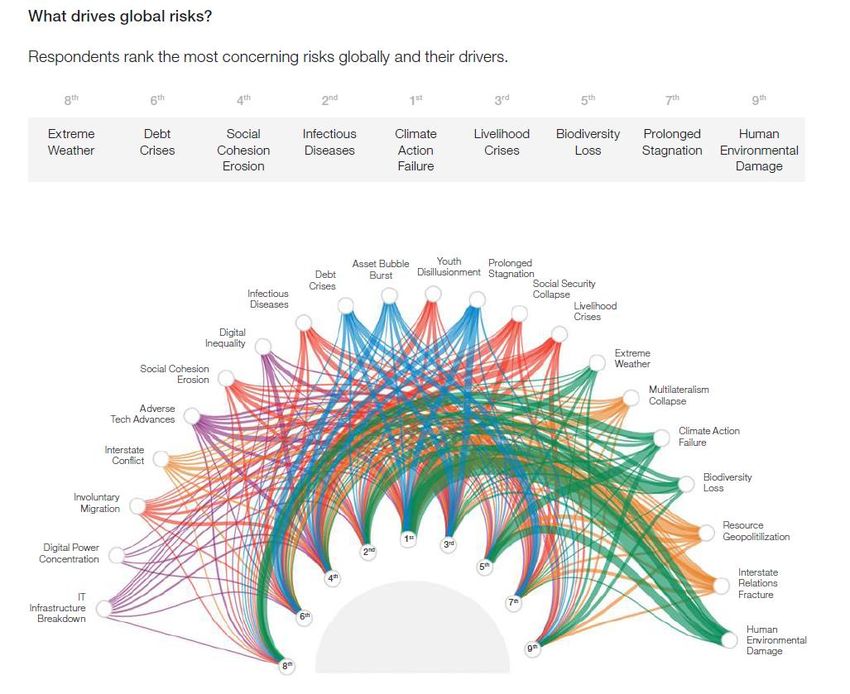
“International, National and Subnational Framework for Assessing
Vulnerability”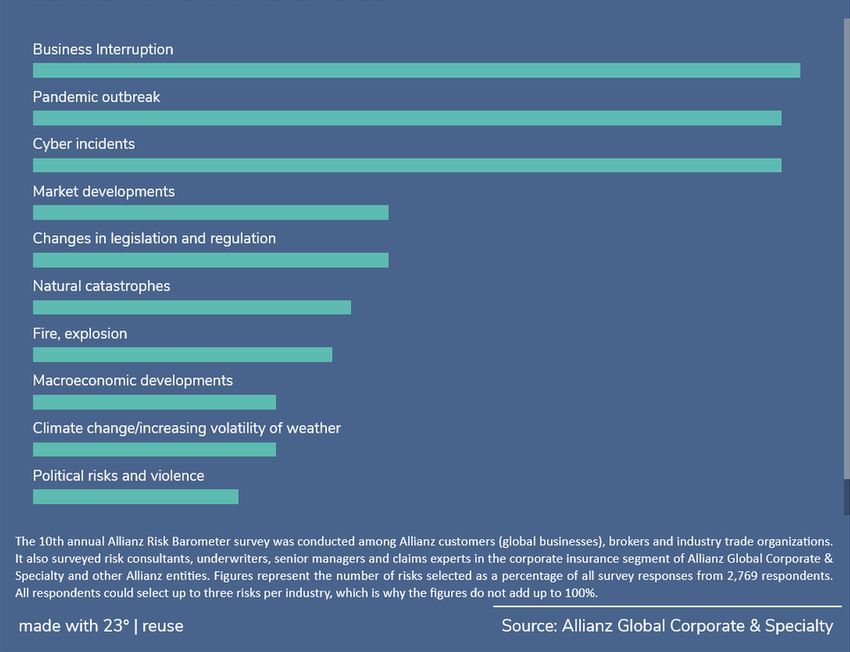
International, National and Subnational Framework of Vulnerability

                                                    Business     vulnerability
                                                    refers to the state of
                                                    weakness that allows
                                                    threats to compromise
                                                    the value of business.

                                                    Vulnerability can be
                                                    divided     into     four
                                                    different     categories:
                                                    physical,    operational,
                                                    personnel,            and
                                                    technical.

                                                    In short, a threat may
                                                    exist, but if there are no
                                                    vulnerabilities for the
                                                    threat to exploit, then
                                                    there would be no risk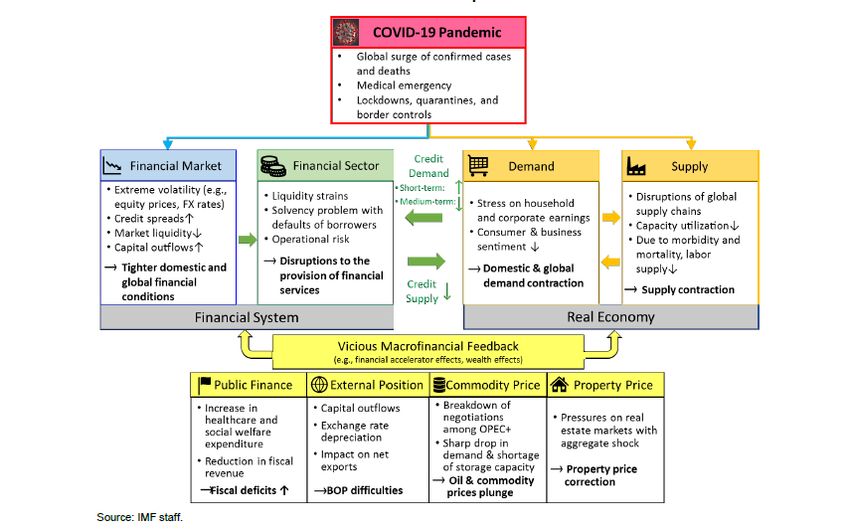
Global Business Threats, Vulnerability & Risks 2021
National Economic Sector Business Threats, Vulnerability & Risks 2020/21

                                      The most recurrent national risks per sector were Covid-19 induced
                                      restrictions followed by electricity supply disruptions and weak household
                                      demand exacerbated by political unrest and violence
“
“Global Business Vulnerabilities Transmission, Causes and
Implications”Covid-19 Financial and Economic Business Vulnerability Causes and
Implications - 2021
•Reduced (revenue or sales to existing and new
customers)
•Increased (cost of sales, mainly through lack of
working synergy with suppliers)
• Raised (expenses or costs, through widespread
employee lack of effort and focus)
•Decreased (cash-flows by lack of working
relationship with organizational stakeholders)“
“STATUS OF BUSINESS VULNERABILITY - MACROECONOMIC AND
RETAIL TRADE SALES FORECAST FOR SOUTH AFRICA, 2020”
”SOUTH AFRICA RETAIL BUSINESS VULNERABILITY MEASURED BY LEVELS OF MONTHLY SALES –
2020 (PERCENTAGE SHARE IN 2012 PRICES)
Food, Furniture,
Clothing, All other
High points General dealers beverages, Pharmaceuticals appliances, Hardware
footwear retailers
tobacco equipment
January High
February Very high
March High High Very high High
April
May High
June
July High
August High High High
September High
October High High High High
Overall, the 2020 trends in the
November High High High High Very high
December Very high Very high High Very high Very high High High table show that the lowest sales
registered by retail outlets were
Food, Furniture, reported during the month of
Clothing, All other
Low points General dealers beverages, Pharmaceuticals appliances, Hardware April and the highest sales
footwear retailers
tobacco equipment
occurred in December 2020.
January Low Low These months coincided with the
February Very low Low Low onset of the aftereffects of the
March Low Low Low national lockdowns but also the
April Very low Very low Very Low Very low Very low Very low
end of year holiday season,
May Low Low Low
June Low Low Low
respectively.
July Low Low Low
August Low
September Low Low
October Low
November
December
Source: BMR/Stats SA, 2020VULNERABILITY IN MARKET SHARES OF TYPES OF RETAILERS FROM 2011 TO 2020
(PERCENTAGE SHARE IN 2012 PRICES)
50
45
40
35
30
25
20
15
10
5
0
General dealers Food, beverages and tobacco Pharmaceuticals Clothing, footwear Furniture, appliances and Hardware All other retailers
equipment
2011 2012 2013 2014 2015 2016 2017 2018 2019 2020
Source: BMR/Stats SA, 2020 The highest level of market share vulnerability was realised in outlets
that operate in the, all other retailers category, dealing in amongst
others stationary, jewellery, sports and entertainment requisites
followed by clothing and footwear in addition to food, beverages and
tobacco.“
“ESTIMATING THE SIZE OF THE FORMAL BUSINESS SECTOR OF
SOUTH AFRICA 2018-2020”
”Comparative Analysis of Formal Business Vulnerability in South Africa 2018 - 2020 : Percentage Distribution by Sector
South Africa 2018 South Africa 2019
Unclassified 23,09 Unclassified 23,82%
Community, social and personal services 11,20 Community, social and personal services 10,67%
Finance, real estate and business services 30,58 Finance, real estate and business services 31,53%
Transport, storage and communication 3,32 Transport, storage and communication 2,66%
Wholesale, retail and motor trade, catering and accommodation 10,72 Wholesale, retail and motor trade, catering and accommodation 11,07%
Construction 6,49 Construction 6,40%
Electricity, gas and water 0,41 Electricity, gas and water 0,41%
Manufacturing 9,46 Manufacturing 8,95%
Mining and quarrying 0,84 Mining and quarrying 0,60%
Agriculture, forestry and fishing 3,88 Agriculture, forestry and fishing 3,89%
0 25 50 0% 10% 20% 30% 40% 50%
PERCENTAGE PERCENTAGE
South Africa 2020 • Construction is the only sector that has registered vulnerability
Unclassified 19,91% through out the period as per decline in the proportionate number of
Community, social and personal services 11,75% businesses between 2018 & 2020
Finance, real estate and business services 31,73%
Transport, storage and communication 2,66%
• All other sectors have registered increases in the overall percentage
Wholesale, retail and motor trade, catering and accommodation 11,52%
Construction 6,27%
composition of businesses
Electricity, gas and water 0,45%
Manufacturing 9,31% • This has been possible due to the decline in the unclassified category
Mining and quarrying 0,94% leading to sector reallocations as a result of improved accuracy in
Agriculture, forestry and fishing 5,45%
reporting
0% 10% 20% 30% 40% 50%
PERCENTAGEComparative Analysis of Formal Business Vulnerability in South Africa 2018-2020 : Percentage Distribution by Size
South Africa 2018 South Africa 2019
Large Large
Medium Medium
Small Small
0 25 50 75 100 0% 20% 40% 60% 80% 100%
PERCENTAGE PERCENTAGE
Total Western Cape Northern Cape North West Mpumalanga Total Western Cape Northern Cape North West Mpumalanga
Limpopo KwaZulu-Natal Gauteng Free State Eastern Cape Limpopo KwaZulu-Natal Gauteng Free State Eastern Cape
South Africa 2020
• Between 2018 and 2020, the number of small
Large
businesses registered a decline of 1.2%
Medium • Medium sized businesses increased by 0.9%
over the two years #
Small
0% 20% 40% 60% 80% 100% • While large businesses grew by 0.3% over the
PERCENTAGE
same period.
Total Western Cape Northern Cape North West Mpumalanga
Limpopo KwaZulu-Natal Gauteng Free State Eastern CapeComparative Analysis of Formal Business Vulnerability in South Africa 2018-2020 : Percentage Distribution by Province
South Africa 2018 South Africa 2019
Large Large
Medium Medium
Small Small
South Africa South Africa
0 25 50 0% 10% 20% 30% 40% 50%
PERCENTAGE PERCENTAGE
Western Cape Northern Cape North West Mpumalanga Limpopo Western Cape Northern Cape North West Mpumalanga Limpopo
KwaZulu-Natal Gauteng Free State Eastern Cape KwaZulu-Natal Gauteng Free State Eastern Cape
South Africa 2020
• Four provinces registered declines in the percentage
Large proportion of small businesses between 2018 & 2020
Medium
• This vulnerability was prevalent in Gauteng, KwaZulu
Small
Natal, Northern Cape and Mpumalanga
South Africa
0% 10% 20% 30% 40% 50% • A similar pattern of vulnerability was witnessed in
PERCENTAGE
medium sized businesses in Eastern Cape, Free State,
Western Cape Northern Cape North West Mpumalanga Limpopo
Limpopo & Western Cape over the same period
KwaZulu-Natal Gauteng Free State Eastern Cape“ “South Africa Municipal Business Vulnerabilities, Size, Sector, Challenges and Implications, Status, Trends and Peculiarities”
Municipal Business Vulnerability Transmission Mechanism

                                                                   International
                                                                     business
                                                                   environment

                                       Business                                        Major
                                      impact of                                       business
                                       Covid-19                                      constraints
                                                                    Business
                                                                  Vulnerability
                                                                   Causes and
                                                                  Implications
                                     Business                                          Macro-
                                    competitive                                       economic
                                       ness                                          environment

                                                                        Financial
                                                                       position of
                                                                        business
                               Source: BMR Satisfaction survey, 2021
Comparative Analysis of Formal Business Vulnerability in South Africa
2020/21 City of Tshwane Metro
100 Level of vulnerability Policy action required
BVI score range
> Extremely vulnerable Very urgent need for action
CoT Business Vulnerability Scores 2021 >
>
Extremely vulnerable .......................Secure
75
0 29.99
> Vulnerable Urgent need for action
>
54,87 >
50,37
50 47,26 47,35
30 49.99
> Exposed Improvement required
>
>
25
50 69.99
> Ensure no slippage (maintain policy
> environment)
>
0 Secure
Formal small Formal medium Formal large Informal
Formal small Formal medium Formal large Informal
70 100.00Leading Risk Factors and Drivers of Informal Business
Vulnerability City of Tshwane Metro 2020/21
1. Financial position of businesses 2. Major business constraints
The cash flow position of the business Level of crime and corruption
o Decreasing sales. o Corruption at all levels in government.
The net wealth (balance sheet) of the business o Crime and corruption caused by unemployment.
o Cash flow problems The political environment including social/political unrest.
The long-term financial sustainability of the business o Government corruption
o Lack of money o Limited businesses expansion opportunities.
o Political unrest.
o Poor public service delivery.
Ease of doing business.
o Slow/deferred payment by customers.
Quality of infrastructure
o Deteriorating infrastructure - poor roads/potholes.
Labour quality
3. Business impact of Covid-19 4. Macroeconomic environment of Tshwane
Access to government relief schemes, like the COVID-19 temporary relief scheme The Tshwane business environment
o Corruption o Government corruption.
o Never received the relief. o Closure of businesses.
o Slow process / Long & complicated process/procedure. The Tshwane economy
Change in the prices of supplies o High unemployment.
o Uncontrolled cost escalations
Change in ability to access financial resources.
o Limited access to business finance
Access to materials, goods or services within South Africa
Importing of goods or services
5. Business competitiveness 6. International business environment
Level of confidence in conducting business in Tshwane -
Level of confidence in the future of the business
o Unfair / too much competition.Leading Risk Factors and Drivers of Small Formal Business
Vulnerability City of Tshwane Metro
1. International business environment 2. Major business constraints
Import prices. Level of crime and corruption
o Covid-19 limited import opportunities o No law enforcement
o High importing costs of specialised products. o Corruption at all levels in government.
Opportunities for exports The political environment including social/political unrest.
o Covid-19 restricts exports. o Poor public service delivery.
International economic growth o Government corruption.
o Corruption scares away international investors. o Government mismanagement of funds.
o Covid-19 impact negatively on business Quality of infrastructure
o Deteriorating infrastructure - poor roads/potholes.
o Poor maintenance
o Deterioration in services eg Telkom, Eskom.
Ease of doing business.
o Covid-19
o Too much red tape to do business with government.
Labour quality
o Lack of proper education and qualifications.
Labour stability or industrial disputes
3. Macroeconomic environment of Tshwane 4. Financial position of businesses
The Tshwane economy The cash flow position of the business
o High unemployment. o Slow/deferred payments by clients.
o BBEE requirements and regulations problematic. o Decreasing sales.
The Tshwane business environment The net wealth (balance sheet) of the business
o Government corruption. o Covid-19
o Lower consumer spending. o Cash flow problems
o BBBEE requirements and regulations problematic. The long-term financial sustainability of the business
o Late/deferred payment by clients.
5. Business competitiveness 6. Business impact of Covid-19
Level of confidence in conducting business in Tshwane Access to government relief schemes, like the COVID-19 temporary relief scheme
o Unfair competition. Change in the prices of supplies
Level of confidence in the future of the business Access to materials, goods or services within South AfricaLeading Risk Factors and Drivers of Medium Formal Business
Vulnerability City of Tshwane Metro 2020/21
1. International business environment 2. Major business constraints
Import prices. Level of crime and corruption
o High importing costs of specialised products. o Corruption at all levels in government.
Opportunities for exports o No law enforcement.
o Covid-19 restricts exports. o Crime and corruption caused by unemployment.
o Challenging export restrictions. The political environment including social/political unrest.
International economic growth o Poor public service delivery.
o Corruption scares away international investors. o BBBEE regulations.
o Covid-19 impact negatively on business o Government mismanagement of funds.
o Government policies, programmes and actions scare away potential investors. o Government corruption
Quality of infrastructure
o Deteriorating infrastructure - poor roads/potholes.
o Poor maintenance
Ease of doing business.
o Covid-19
o BBBEE regulations limiting opportunities for contracts.
o Too much red tape to do business with government.
Labour quality
o Lack of proper education and qualifications.
o Affirmative action leads to appointment of unqualified workers.
o Difficult to find experienced/competent workers.
Labour stability or industrial disputes
o Low worker commitment/interest in work.
3. Macroeconomic environment of Tshwane 4. Financial position of businesses
The Tshwane economy The cash flow position of the business
o High unemployment. o Slow/deferred payments by clients.
o BBEE requirements and regulations problematic. o Decreasing sales.
The Tshwane business environment The net wealth (balance sheet) of the business
o Lower consumer spending. o Covid-19
o BBBEE requirements and regulations problematic. o Cash flow problems
o Government corruption. The long-term financial sustainability of the business
o Late/deferred payment by clients.
5. Business competitiveness 6. Business impact of Covid-19
Level of confidence in conducting business in Tshwane Access to government relief schemes, like the COVID-19 temporary relief scheme
o Corruption. Change in the prices of supplies
Level of confidence in the future of the business Access to materials, goods or services within South AfricaLeading Risk Factors and Drivers of Large Formal Business
Vulnerability City of Tshwane Metro 2020/21
1. International business environment 2. Major business constraints
Import prices. Level of crime and corruption
o Covid-19 limited import opportunities o Misappropriated government spending.
Opportunities for exports The political environment including social/political unrest.
o Covid-19 restricts exports. Quality of infrastructure
International economic growth o Poor maintenance
o Covid-19 impact negatively on business Ease of doing business.
o Covid-19
Labour quality
o High labour cost.
3. Macroeconomic environment of Tshwane 4. Financial position of businesses
The Tshwane economy The cash flow position of the business
The Tshwane business environment o Slow/deferred payments by clients.
o Covid-19 impacted negatively on business The net wealth (balance sheet) of the business
o Covid-19
The long-term financial sustainability of the business
5. Business competitiveness 6. Business impact of Covid-19
Level of confidence in conducting business in Tshwane Change in the prices of supplies
o Tshwane incompetence Importing of goods or services“
Forecast of South Africa Business Vulnerabilities, Potential Impact on
Sustainable Business and Economic Growth”FORECAST IN RETAIL TRADE SALES VULNERABILITIES GROWTH RATES (CONSTANT 2012 PRICES)
2020-2021
All other retailers
Retailers in hardware, paint and glass
Retailers in household furniture, appliances and equipment
Retailers in textiles, clothing, footwear and leather goods
Retailers in pharmaceutical and medical goods, cosmetics and toiletries
Retailers of food, beverages and tobacco in specialised stores
General dealers
-35,00 -30,00 -25,00 -20,00 -15,00 -10,00 -5,00 0,00 5,00 10,00
2021 2020
ource: BMR/Stats SA, 2020
Due to the causes shared earlier, during 2021 negative growth rates are expected to continue for businesses in the all-other retailer's
category but also very low growth rates to be registered among retailers in hardware, paint and glass plus retailers of food, beverages
and tobacco.FORECAST OF VULNERABILITIES IN FINAL CONSUMPTION EXPENDITURE INCURRED AT RETAIL
OUTLETS (constant 2010 prices), 2020-2021
Recreational and entertainment goods
Medical and pharmaceutical products
Household consumer goods
Household fuel, power and water
Food, beverages and tobacco
Miscellaneous goods
Recreational and entertainment goods
Household textiles, furnishings, glassware, etc.
Clothing and footwear
Other durable goods
Recreational and entertainment goods
Computers and related equipment
Furniture, household appliances, etc.
-30,0 -25,0 -20,0 -15,0 -10,0 -5,0 0,0 5,0 10,0 15,0
2021 2020
During 2021 vulnerability in final consumption expenditure will be recorded mainly in the semi-durable
recreational and entertainment goods category but also in the clothing and footwear categoryREAL HOUSEHOLD CONSUMPTION EXPENDITURE VULNERABILITY FORECAST BY PRODUCT
GROUP (constant 2010 prices), 2020-2021
Services
Non-durable goods
Semi-durable goods
Durable goods
-20 -15 -10 -5 0 5
2021 2020
During 2021 semi-durable goods will experience the highest household expenditure vulnerability while
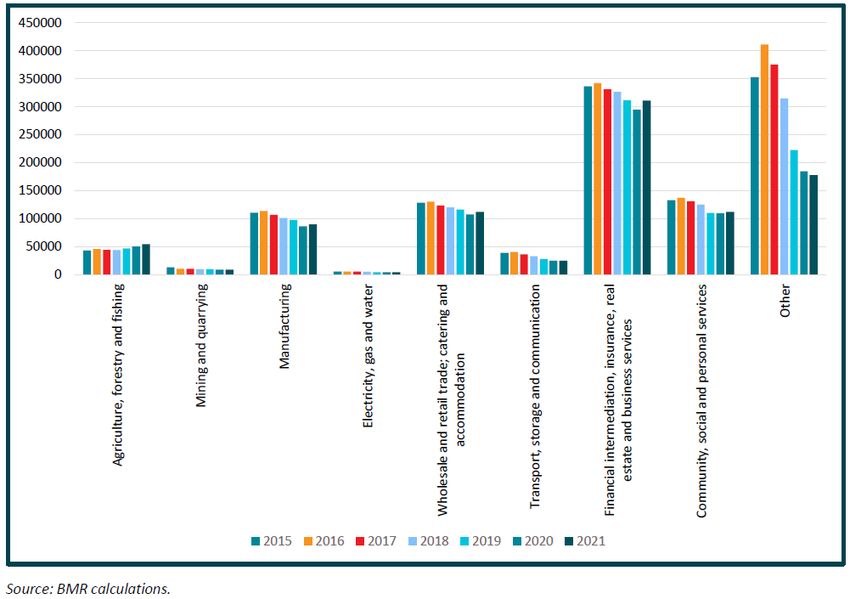
durable goods, services and non-durable goods will experience a rebound though from a low a base.ESTIMATION AND FORECAST OF SOUTH AFRICA BUSINESS VULNERABILTY
BY ECONOMIC SECTOR 2015-2021
During 2021, the highest
vulnerability as measured
by the annual rate of
decline in the
number of businesses per
sector is projected to be
registered in the other
category (-3.7%)
followed by transport,
storage, and
communication (-1.3%) with
the lowest growth in
mining and quarrying (1.1%)
as well as electricity, gas,
and water (1.6%).
*“other” category mainly consists of companies that could not be ascribed to any specific economic sectorESTIMATION AND FORECAST OF SOUTH AFRICA BUSINESS VULNERABILTY
BY SIZE OF BUSINESS 2020 & 2021
Sector Business Vulnerability by Size of
Business The trends continue to show that
2020 business vulnerability in the
2021
different sectors is concentrated
Agriculture, forestry, and fishing Small Medium among small businesses during
Mining and quarrying Large both 2020 and 2021. During 2020
Large
however medium sized businesses
Manufacturing Medium Small exhibited almost the same degree
Electricity, gas, and water Medium of risk towards vulnerability as
Large
small businesses. It is projected
Construction Medium Small that the South African economy
Wholesale and retail trade; catering and Medium may see more large businesses
Small also cecum to vulnerability during
accommodation
2021 especially in the electricity,
Transport, storage, and communication Large Small gas and water, financial
Financial intermediation, insurance, real Small intermediation, insurance, real
Large
estate, and business services estate, and business services as
well as community, social and
Community, social and personal services Small Large personal services.
Other Small Small“ Conclusion
Conclusion

• Covid-19 induced restrictions followed by electricity supply disruptions and weak
  household demand exacerbated by political unrest and violence are the greatest
  threats to business vulnerability in South Africa during 2020/21

• The results also show that the number of formal businesses is expected to increase in
  2021

• As the overall economy bounces back from a low base due to the impact of the Covid-
  19 pandemic during 2020.

• Nevertheless, small businesses have been and will continue to be the most vulnerable
  during 2020 and 2021.
END
You can also read