The weather behind words - new methodologies for integrated hydrometeorological reconstruction through documentary sources
←
→
Page content transcription
If your browser does not render page correctly, please read the page content below
Clim. Past, 15, 1303–1325, 2019
https://doi.org/10.5194/cp-15-1303-2019
© Author(s) 2019. This work is distributed under
the Creative Commons Attribution 4.0 License.

The weather behind words – new methodologies for
integrated hydrometeorological reconstruction
through documentary sources
Salvador Gil-Guirado1,2 , Juan José Gómez-Navarro3 , and Juan Pedro Montávez3
1 Interuniversity
                Institute of Geography, University of Alicante, P.O. Box 99, 03080 Alicante, Spain
2 Department of Geography, University of Murcia, Campus de la Merced, 30001 Murcia, Spain
3 Department of Physics, University of Murcia, Campus de Espinardo (Faculty of Chemistry), 30100 Murcia, Spain

Correspondence: Salvador Gil-Guirado (salvagil.guirado@ua.es)

Received: 3 January 2019 – Discussion started: 9 January 2019
Revised: 3 May 2019 – Accepted: 18 June 2019 – Published: 10 July 2019

Abstract. Historical climatology has remarkable potentiali-      1   Introduction
ties to produce climatic reconstructions with high temporal
resolution. However, some methodological limitations hin-        Understanding climate variability is fundamental to apply
der the spatial development of this discipline. This study       a long-term climatic perspective to ongoing global change
presents a new approach to historical climatology that over-     (IPCC, 2013). Meteorological observations play a promi-
comes some of the limitations of classical approaches, such      nent role here, as they record this variability and enable it
as the rogation method or content analysis: the Cost Oppor-      to be studied. Despite few early instrumental records start-
tunity for Small Towns (COST). It analyses historic docu-        ing in the 18th century in industrialised areas (Cornes et al.,
ments and takes advantage of all sorts of meteorological in-     2012; Domínguez-Castro et al., 2013; Prohom et al., 2016),
formation available in written documents, and not only the       the systematic recording of climatic data, globally coordi-
severest events, to therefore overcome the most prominent        nated by the World Meteorological Organization (WMO), is
bottlenecks of former approaches. COST relies on the fact        much more recent. This short period of time precludes the
that using paper is very costly, so its use to describe meteo-   establishment of a robust statistical characterisation of cli-
rological conditions is hypothesised as being proportional to    mate variability and thus limits the understanding of those
the impact they had on society. To prove the validity of this    mechanisms behind long-term climate variability. Therefore,
approach to reconstruct climate conditions, this article exem-   it is necessary to use proxy data or direct climate descriptions
plarily uses the Municipal Chapter Acts of a small town in       that allow climate series to be reconstructed beyond short in-
southern Spain (Caravaca de la Cruz), which span the 1600–       strumental records (Pfister et al., 2008). Such reconstructions
1900 period, and allows reconstructions to be obtained on a      shed light on the relations between social processes and long-
monthly basis. Using the same documentary source, the three      term climate variability (Hsiang and Burke, 2013). Climate
approaches were used to derive respective climate recon-         models and climate reconstructions are the two main tools
structions, which were then compared to assess climate sig-      presently available to climate researchers that enable climate
nal consistency and to identify possible caveats in the meth-    variability to be studied. Both approaches are necessary and
ods. The three approaches led to a generally coherent series     complementary, as their joint analysis has been shown to
of secular variability in the hydrological conditions, which     constrain uncertainties and shortcomings that would not be
agrees well with previous study results. The COST approach       otherwise possible (Gómez-Navarro et al., 2015). Climate is
is arguably more objective and less affected by changes in       a complex phenomenon with wide regional variability that
societal behaviour, which allows it to perform comparative       demands a coordinated study (Izdebski et al., 2016) to tackle
studies in regions with different languages and traditions.      as many world regions as possible (Giorgi et al., 2009). How-
                                                                 ever, the availability of proxy data to be used in climate re-

Published by Copernicus Publications on behalf of the European Geosciences Union.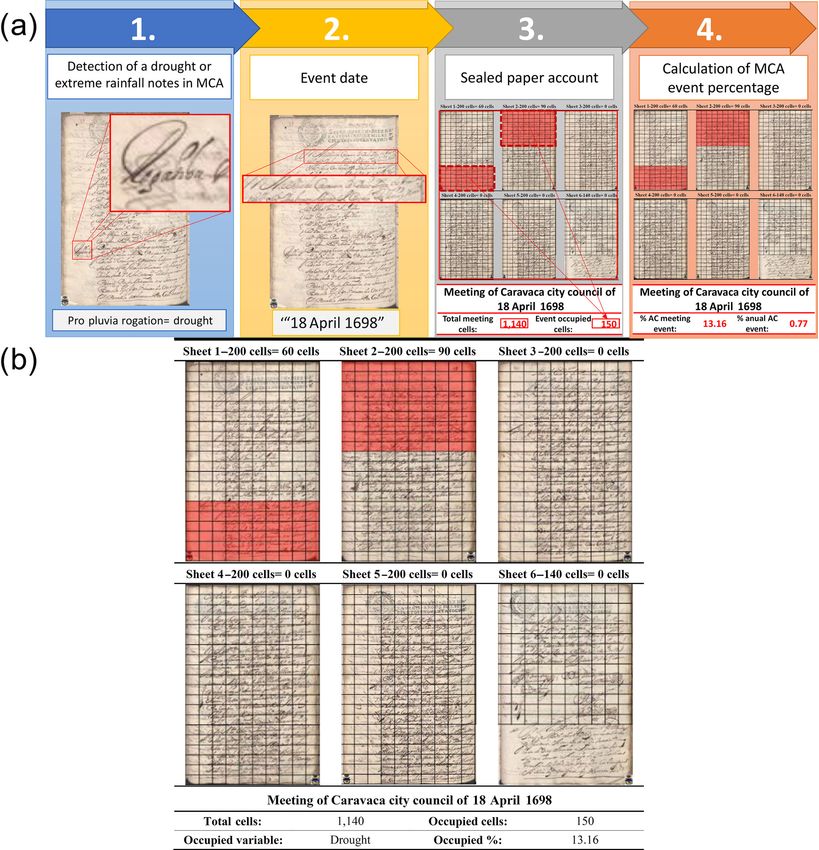
1304                                                                          S. Gil-Guirado et al.: The weather behind words

constructions is very heterogeneous in space and time terms        2015; Cuadrat et al., 2016; Tejedor et al., 2018) are exam-
(PAGES 2k Consortium, 2013, 2017). Each proxy data type            ples of well-studied regions. Beyond Europe, other regions
has a specific potential and limitations (see Pfister et al.,      where HC has remarkably developed are South America (Pri-
2008, and IPCC, 2001, chap. 2, Sect. 2.3.). In some parts of       eto, 1985; Prieto and Jorba, 1991; Prieto et al., 2000) and SE
the world, the specific limitations of each proxy feed one an-     Asia (Ge et al., 2003, 2005). However, most regional studies
other given its socio-environmental characteristics (Huang et      in HC date from the 1980s and 1990s. This period underwent
al., 2000); thus, large areas worldwide are not represented in     tremendous growth as far as series reconstructed through his-
palaeoclimatic reconstructions (Luening, 2017). Arid regions       toric documents emerging are concerned. HC studies have
are, for instance, generally underrepresented due to limited       not grown as much as studies have done through other types
natural proxies being available (Machado et al., 2011). By         of proxies. This situation can be explained by two alterna-
way of example, to carry out climate reconstructions by            tive causes: either there are already sufficient reconstructed
speleothem, specific geological conditions must come into          locations to allow optimum knowledge of climate variabil-
play (Bar-Matthews et al., 1996). Regarding climate recon-         ity or HC is currently limited by methodological limitations
struction through ancient tree rings, the existence of appro-      that prevent the catalogue of locations from being extended.
priate plant species is required (Galván et al., 2014). Finally,   The current proliferation of studies that present new recon-
the correlation between the presence of ice masses and the         structed series from natural sources (Romero-Viana et al.,
feasibility of making reconstructions through ice cores is         2011; Nieto-Moreno et al., 2013; Barreiro-Lostres et al.,
clear (Thompson, 2000), but most of these requirements are         2014; Tejedor et al., 2016) suggests that methodological lim-
not met in arid and semiarid areas.                                itations are indeed the current bottleneck of HC. Thus, new
   In this context, historical climatology (hereinafter referred   methodologies have to be developed that circumvent current
to as HC) is a suitable alternative tool that may bridge this      HC limitations to keep it competitive with other fields. Such
gap because it allows climate reconstruction in locations          advances would also greatly benefit palaeoclimatology given
where natural proxies are scarce (Brázdil et al., 2005; Pri-       the potential of HC to produce the above-described high-
eto and García-Herrera, 2009). HC is a very powerful source        resolution series. Remember that annual, and even seasonal,
of insight, as the historic documents that record weather-         resolved information is essential to understand how climate
related phenomena prior to instrumental weather data collec-       variability affects societies (Hegerl et al., 2011).
tion are available in many parts of the world (Gil-Guirado et         Spain has one of the largest and most varied documentary
al., 2016; Brázdil et al., 2019). Documentary data are a high-     heritages in the world which has, unfortunately, not yet been
resolution proxy for climate reconstructions (Pfister et al.,      fully exploited for climate studies. For instance, although it
2008). Therefore, HC is to be uniquely placed to generate ex-      has a surface covering more than half a million square kilo-
tended datasets that are to be used for climate model valida-      metres, only 15 reconstructed series currently exist, which
tions studies and to provide empirical evidence to further our     simultaneously span more than three centuries and overlap
understanding about the changing nature of climate–society         instrumental records. Catalonia (in northeast Spain) presents
relations over time (Nash and Adamson, 2014). A prominent          good spatial coverage (Martín-Vide and Barriendos, 1995),
advantage of this research field over other palaeoclimatology      while the Balearic Islands and inland and northwest Spain
approaches lies in its economic–technical requirements be-         present notable spatial gaps (see Fig. 1a). Apart from these
ing minimal. However, it requires continuous and homoge-           long series, some initiatives have accomplished reconstruc-
neous written sources (Brázdil et al., 2005). In Europe, this      tions that span much shorter periods of time, but they do
condition limits the reconstructed period to the last 8 to 10      not overlap instrumental data, which preclude the calibra-
centuries, depending on the country (Lamb, 1965; Gagen et          tion and validation of series against observations (Bullón,
al., 2006; Brázdil et al., 2010). However, some documenta-         2008; Fernández-Fernández et al., 2015; Alberola Romá et
tion available in southeast Asia has allowed researchers to        al., 2016; Alberola Romá, 2016; Cortizo, 2016). Most of the
perform reconstructions that date back to more than 20 cen-        studies that overlap instrumental data in Spain focus on cap-
turies (Ge et al., 2003; Wei et al., 2014).                        ital cities (73 % of the series), especially in the episcopal see
   All over Europe, where literature on temperatures and           (93 % of the series). This is due to the large amount of eccle-
precipitation reconstructed through historic documents is          siastical and municipal sources used to produce these series,
abundant, HC is an important source of insight. Studies in         which has a side effect: small populations with no strong ec-
Switzerland, Germany, the Czech Republic, France, Hun-             clesiastical representation are excluded as sources of insight.
gary, the Netherlands, the British Isles, the Balkans, Portu-      This scenario contributes to the above-described bottleneck
gal, Norway, Italy (for a more detailed analysis of the HC         of HC.
literature in Europe, see Camenisch, 2015; Brázdil et al.,            Including the sources that current HC methods do not con-
2005, 2010; Camuffo et al., 2010) and Spain (Martín-Vide           sider entails making major quantitative and qualitative efforts
and Barriendos, 1995; Sánchez-Rodrigo et al., 1999; García-        to develop new reconstruction methodologies capable of in-
Herrera et al., 2003; Vicente-Serrano and Cuadrat, 2007;           tegrating more world locations (Pfister, 2014) and making the
Domínguez-Castro et al., 2008; Fernández-Fernández et al.,         obtained series comparable in time and space terms (Nash

Clim. Past, 15, 1303–1325, 2019                                                               www.clim-past.net/15/1303/2019/
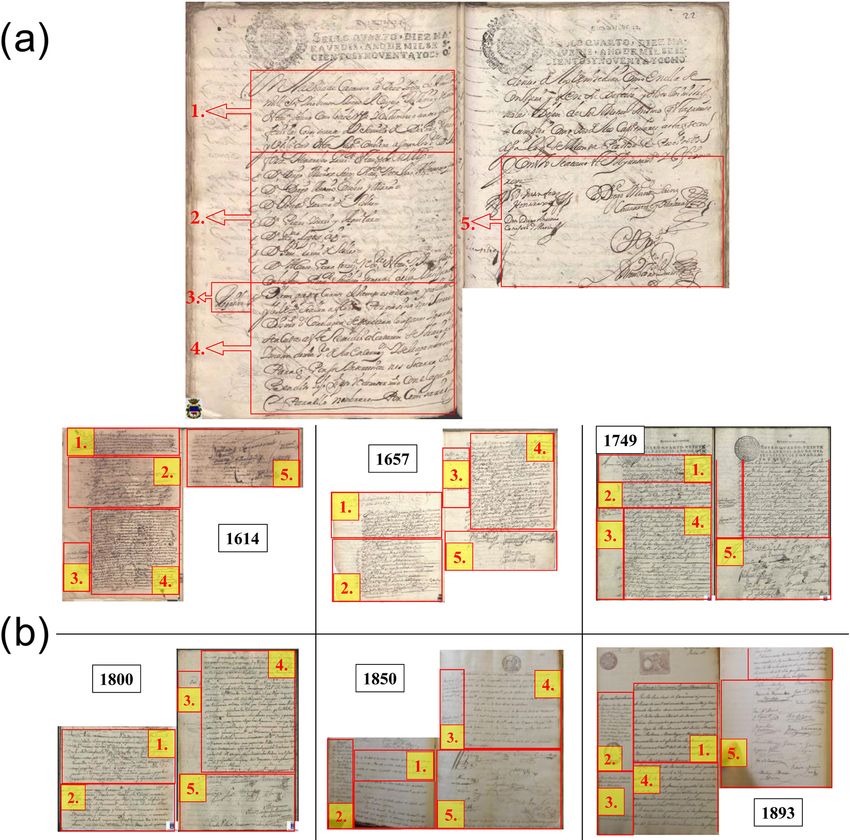
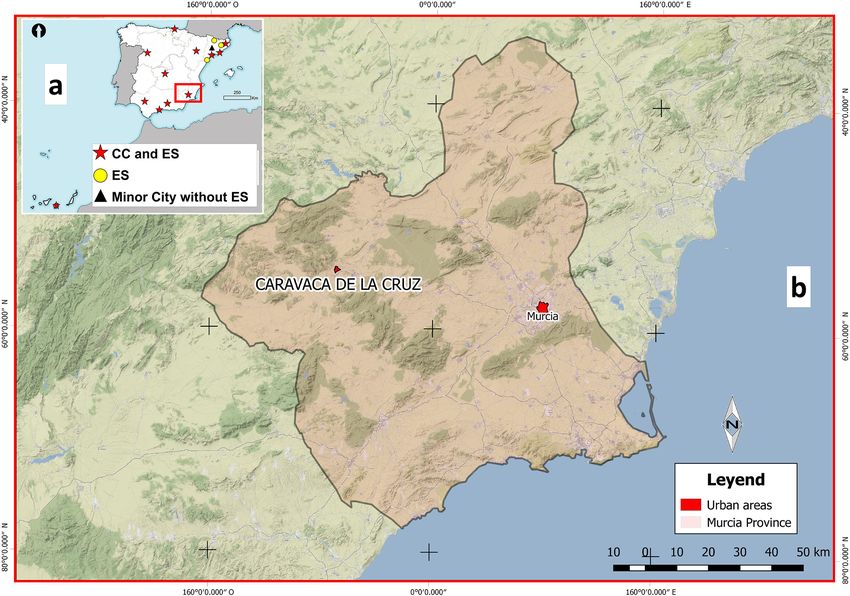
S. Gil-Guirado et al.: The weather behind words                                                                                          1305

Figure 1. Location maps of reconstructed series with an instrumental overlap in Spain (a) and the study area (Caravaca de la Cruz) (a).
Panel (a) shows the reconstructed series in Spain that overlap instrumental records. Red stars identify the reconstructed series in capi-
tal cities (CCs) that are also episcopal sees (ESs). The yellow circle identifies the reconstructed series in cities that are ESs. Finally, the
black triangle identifies the small cities with no capital or episcopal see. Panel (b) represents the location of the study area (Caravaca de
la Cruz). Sources: Martín-Vide and Barriendos (1995), Sánchez-Rodrigo et al. (1999), García-Herrera et al. (2003), Vicente-Serrano and
Cuadrat (2007), Sánchez-Rodrigo and Barriendos (2008) and Gil-Guirado (2013).

and Adamson, 2014). This is, however, a difficult task and                in numerical values (typically rain, temperature and wind).
one which poses numerous questions that need addressing.                  The application of these two methods is subject to one im-
What is the most appropriate methodology for each location?               portant factor, i.e. the amount of available documentation.
Does it depend on the targeted period? Are there complemen-               In this sense, Spain is a good target for such studies be-
tary and alternative methods? Answering these questions is                cause important sources of historic documentation are cur-
no easy task, and it is necessary to analyse the sensitivity of           rently available and are more abundant than in, for instance,
different methods, as this knowledge will allow the methods               South America where historic vicissitudes have caused a
for each application to be optimised. By making a promi-                  larger part of this documentation to be lost (Gil-Guirado,
nent effort in this direction, Neukom et al. (2009) used the              2013). However, when the amount of documentary sources
pseudo-documentary source concept to confirm how good                     is very large, consultations of the full material become too
complementarity exists between the series reconstructed with              complex and time-consuming, and therefore the selection of
different kinds of historical sources, e.g. newspapers and of-            the most suitable sources is necessary (Brazdil et al., 2005).
ficial documents. However, the aim of such an analysis was a              In this circumstance, the most appropriate method is the ro-
methodological validation for the same place using the same               gation (RO) method as it enables highly robust reconstruc-
documentary sources, but by different methodologies, which                tions using a fraction of the total documentation (Barriendos,
is infrequent in the HC literature                                        1997; Gil-Guirado, 2013). This condition explains why the
   There are currently two main HC methods that have been                 RO method is the most widely used one in the HC litera-
used to produce continuous series with historic documents                 ture in Spain. Conversely, when the amount of documentary
from the old Spanish empire. On the one hand, there is                    sources is scarce, it is necessary to consult the documentary
the rogation method (Martín-Vide and Barriendos, 1995;                    sources in full detail. This forces researchers to use docu-
Barriendos, 1997; Sánchez-Rodrigo and Barriendos, 2008;                   ments from heterogeneous sources to gain an advantage from
Domínguez-Castro et al., 2008) maps ceremonies asking                     every piece of climate information that they might contain.
God for rain (pro pluvia) or to stop rain (pro serenitate) in             In this circumstance, the most appropriate method is content
precipitation indices; on the other hand, there is content anal-          analysis (CA), as it allows documentary sources of various
ysis (Prieto et al., 2005), which maps the precise wording                kinds (civil, religious, private, etc.) to be analysed by a com-
used in historic documents to describe meteorological events              mon methodology to enable robust series to be obtained (Pri-

www.clim-past.net/15/1303/2019/                                                                        Clim. Past, 15, 1303–1325, 2019
1306                                                                           S. Gil-Guirado et al.: The weather behind words

eto et al., 2003). This situation has resulted in the CA method    town management matters were analysed1 . It was manda-
being the most widely used one in South American countries         tory to leave a written record of meetings and records in
(Prieto et al., 2000; Neukom et al., 2009; Prieto and García-      the municipal archive for possible future claims or consul-
Herrera, 2009).                                                    tations. A public scribe was responsible for transcribing all
   Bearing in mind this review on the current status of HC,        the information in a MCA book. In these books, the date, the
the objectives study are to                                        participants, the topics covered, the specific contributions of
                                                                   each participant and any reached agreements were recorded
    1. describe and validate a new suitable methodology to re-     (see Fig. 2a for an example of this type of documents). This
       construct climatic series in small towns through historic   arrangement remained intact for centuries (see Fig. 2b for
       documents (the so-called Cost Opportunity for Small         different MCAs throughout the study period). MCAs were
       Towns method – COST);                                       official documents that were countersigned on official State
                                                                   paper. By law, the central State obliged this arrangement to
    2. simultaneously apply the RO, CA and COST methods            be maintained. Therefore, these MCAs were extremely simi-
       to the same historic document by analysing the sensi-       lar in terms of their structure and composition. However, the
       tivity of the results to the chosen method by thus char-    rule about holding weekly meetings was not strictly followed
       acterising the uncertainties and robustness of this new     through, and the number of meetings was more related to ur-
       approach; and                                               gent themes than to administrative matters. In other words,
                                                                   the dynamics of CCO meetings responded to towns’ day-to-
    3. determine if complementarity between methods exists         day problems. For this reason, some weeks went by when
       for it to be used to bridge gaps when the requirements      no meetings were held, while several meetings could have
       for applying one of these three methodologies are not       taken place in just 1 week. In any case, rules about having to
       met.                                                        hold weekly meetings explain that there was no seasonality
                                                                   in the number of MCAs used each month, which has been
As a testbed to apply the methods, we took the data from
                                                                   evidenced in other areas of Spain (Pérez, 1987; Gutiérrez,
a small population in the southeast of Spain (Caravaca de
                                                                   2005), but the most important point is that there was no time
la Cruz, 25 633 inhabitants in 2017) (see Fig. 1b) over the
                                                                   of the year when meetings had to be put off. Hence, the im-
1600–1900 period. The semiarid conditions (around 380 mm
                                                                   portance of matters and the situation of a given year explain
annual average) and mild temperatures (about 16 ◦ C annual
                                                                   the bigger or smaller quantity of paper used in a year but also
average) render the precipitation and water availability as the
                                                                   ensured that whenever any extraordinary event occurred, like
determining factors for human activity (DeMenocal, 2001,
                                                                   scarce rainfall or heavy rain events, and no matter what the
p. 667). Therefore, precipitation is the target variable for re-
                                                                   date, the CCO would meet to deal with any particulars.
construction.
                                                                      This makes the MCA book a kind of official gazette in
   This paper is arranged as follows: Sect. 2 presents and dis-
                                                                   which all issues that affected towns were recorded (Barrien-
cusses historic sources. Section 3 focuses on the thoughtful
                                                                   dos, 1999). In the MCA, all environmental aspects that in-
description of the three methodologies. Section 4 presents the
                                                                   fluenced the population were comprehensively treated. In
reconstructions carried out and compares the results. Finally,
                                                                   this way, all anomalous events were collected in great de-
Sect. 5 concludes the paper by making the main remarks.
                                                                   tail. Therefore, the existence of a MCA with no references to
                                                                   meteorological information implies that the climate and envi-
2    Documentary sources                                           ronmental situation were regarded as being normal because
                                                                   when the climate thresholds accepted by a society are not
The previous analysis of all documentary sources is a neces-       exceeded, there is no news (Prieto et al., 1999). Taking into
sary step in every HC study (Brázdil et al., 2005). The next       account these described characteristics, MCA books are the
step is to objectify the obtained information, i.e. convert his-   primary council source to offer direct weather data, water-
toric data into climate data (Glaser, 1996, p. 57).                dependent data and phenological data (Jones and Bradley,
   For this paper, we consulted the Actas Capitulares (Mu-         1992, p. 12).
nicipal Chapter Acts; MCAs) of the Concejo (City Council)
of Caravaca de la Cruz (henceforth referred to as Caravaca).
                                                                   3   Methodology
In all, we consulted 50 388 sheets of paper for the 1600–1900
period. Notwithstanding, it was not possible to bridge some
                                                                   Through the different applied methodologies, continuous
documentary gaps (from 1820 to 1823, and 1891 to 1892).
                                                                   data series were obtained from 1600 to 1900 on a daily ba-
   The MCAs of City Councils (CCO) are the most useful
source for climate studies in Ibero-American countries (Met-           1 These were the ordinary meetings. If some extraordinary event,
calfe et al., 2002). After the foundation of each new town,        such as floods, plagues and epidemics, took place, they held an ex-
the CCO was established for its government. Councillors and        traordinary meeting. Therefore, depending on the needs, meetings
mayors (capitulants) held weekly meetings during which all         could be held on any day of the year.

Clim. Past, 15, 1303–1325, 2019                                                                 www.clim-past.net/15/1303/2019/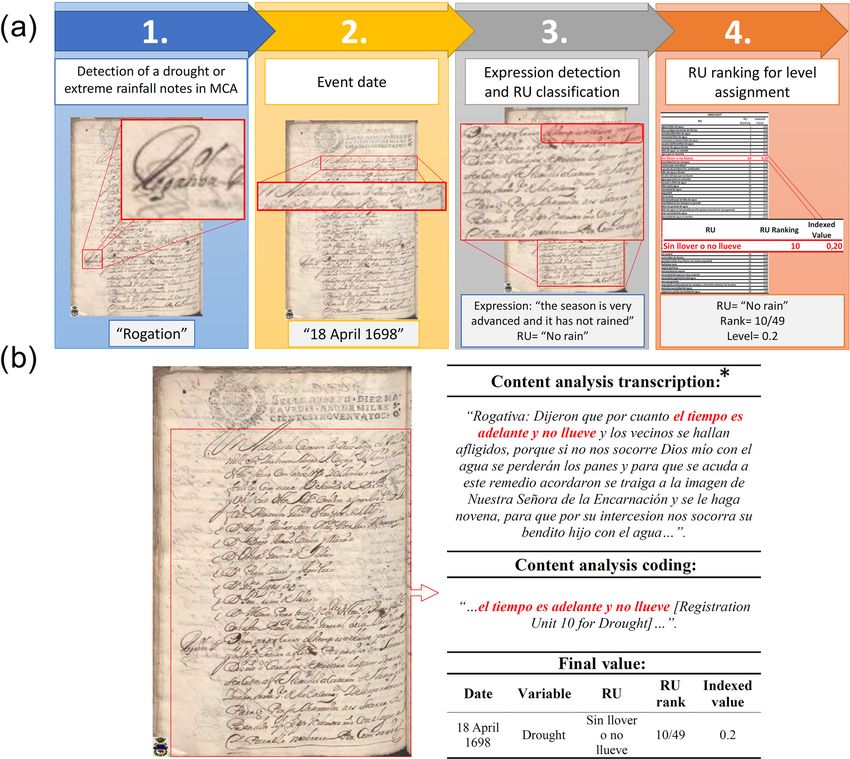
S. Gil-Guirado et al.: The weather behind words                                                                                         1307

Figure 2. The Caravaca CCO meeting sample (18 April 1698) (a) and different examples of MCA throughout the study period (b). The main
parts of a MCA are marked: 1 – date, place and type of meeting (ordinary or extraordinary); 2 – full name of those attending the meeting;
3 – short summary of the topics discussed; 4 – topic memorandum and attendees’ contributions; 5 – attendees’ signatures. Note: the text in
panel (a) describes a ceremony to ask God for rain (pro pluvia): “Dijeron que por cuanto el tiempo es adelante y no llueve y los vecinos se
hallan afligidos, porque si no nos socorre Dios mío con el agua se perderán los panes y para que se acuda a este remedio acordaron se traiga
a la imagen de Nuestra Señora de la Encarnación y se le haga novena, para que por su intercesion nos socorra su bendito hijo con el agua
y para ello nombraron por comisarios a los Señores Don Francisco de Quesada y Don Alfonso de Sajosa. Y en este estado dijeron que por
cuanto Don Alfonso de Sajosa se halla en el campo y no puede venir y por no estar delante el Señor Don Francisco de Quesada parece se
podrá excusar y para obviar cualquier excusa acordaron se repartan suertes entre los capitúlales que están y toco a los Señores Don Francisco
de Quesada y Ginés de Gadea”. Source: the Carmesi Project. This text is written in Old Spanish. An approximate translation is the following:
“They said that the season is very advanced and it has not rained and the population is afflicted, and unless God helps us with rain the crops
will be lost. Therefore, they agreed to bring the image of “Our Lady of Encarnación” and to celebrate nine masses praying so that She asks
to her Son to help us with rain. For this reason, Don Francisco de Quesada and Don Alfonso de Sajosa were appointed as commissioners.
And they said that it was necessary to make a raffle among the capitulants because Don Alfonso de Sajosa was working in the fields and
Don Francisco de Quesada was not in this meeting. After making this raffle, Don Francisco de Quesada and Ginés de Gadea were elected as
commissioners.”

sis. For the data analysis, daily values were aggregated on              3.1    The rogation method
monthly, seasonal (winter: December, January and February;
spring: March, April and May; summer: June, July and Au-                 Rogations are liturgical acts in which the Catholic Church
gust; and autumn: September, October and November) and                   asks God for rain (pro pluvia rogations, hereinafter referred
annual scales. The analysis of drought and extreme rainfall              to as PPRs) or to stop rain (pro serenitate rogations, here-
series was carried out separately to create seasonal and an-             inafter referred to as PSRs). Catholic countries present a
nual series for droughts and extreme rainfall, respectively.             high incidence of such ceremonies (Espín-Sanchez and Gil-
                                                                         Guirado, 2016). In Latin American countries, this historical

www.clim-past.net/15/1303/2019/                                                                        Clim. Past, 15, 1303–1325, 2019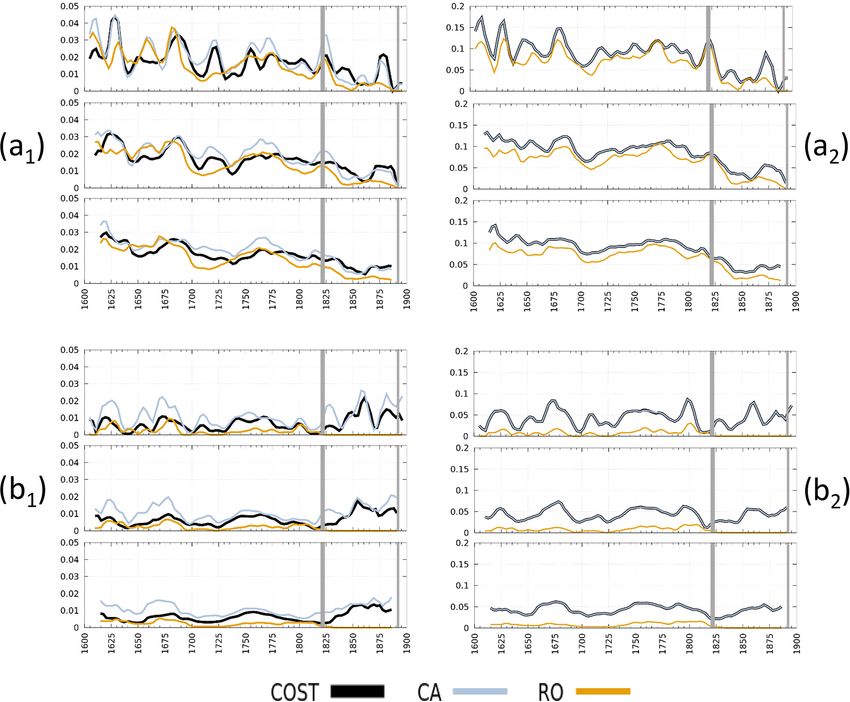
1308 S. Gil-Guirado et al.: The weather behind words
context and the absence of more precise proxies explain the 1. thanksgiving masses: masses held to thank God for rain
proliferation of academic articles using RO data to recon- arriving;
struct weather patterns (Martin-Vide and Barriendos, 1995;
Alcoforado et al., 2000; Domínguez-Castro et al., 2018). 2. RO masses held in church or spells against storms;
Spain is a country where remarkable results have been ob-
tained following this method (Martín-Vide and Barriendos, 3. popular processions with figures of saints or virgins ex-
1995; Sánchez-Rodrigo and Barriendos, 2008; Domínguez- hibited in church;
Castro et al., 2008).
4. popular saints or virgins exhibited from the church
Catholic ROs are religious rites performed for specific pur-
tower; and
poses, such as earthquakes, droughts, heavy rain and floods.
PPRs are the most extended and frequent form of them. Since 5. popular processions with figures of saints or virgins ex-
the 9th century, the RO procedure has been strictly regulated hibited and other uncommon ceremonies in PSRs.
by the Vatican (for more details, see Espín-Sanchez and Gil-
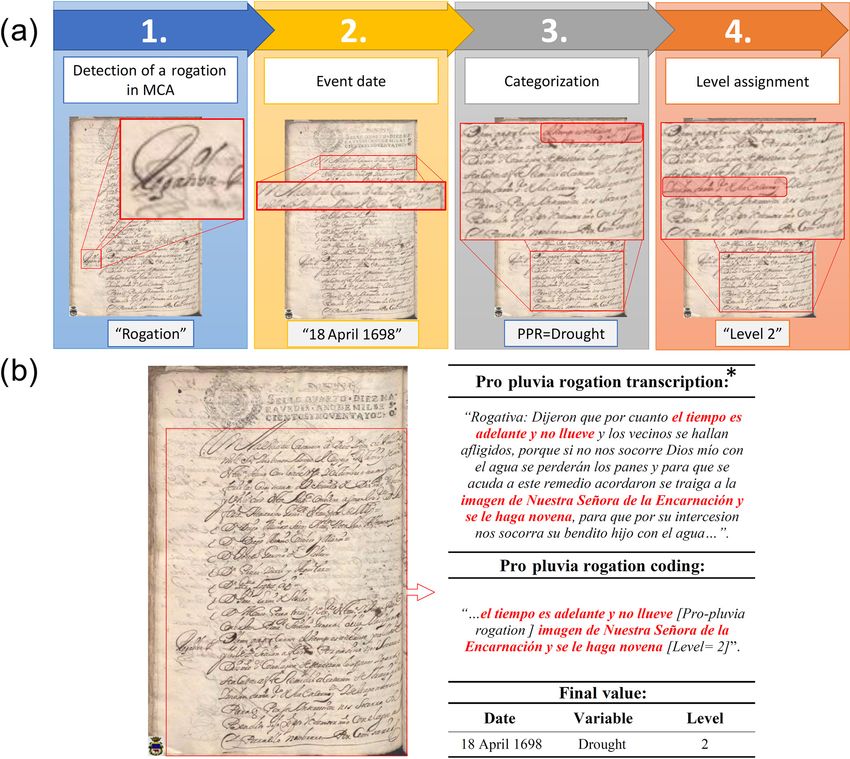
Guirado, 2016). In the ceremonies of level 3 or higher, with two images
In this way, implementing PPR has been consistent over (statues of saints or virgins) or more, we add another level
time in all Catholic territories. The PPR process usually com- point for each additional image (e.g. a PPR procession with
prises the steps below (Garza and Barriendos, 1998): three statues of saints scores five points, with three points
for the profession and two points for additional saints). Such
i. The local government (civil authorities) receives a RO strengthened ceremonies were held when the adverse situa-
request from farmers and decides to ask the religious tion persisted, despite them having prayed for a long time
authorities for a RO request. (see Fig. 3).
The way to code a PPR or a PSR follows some steps (see
ii. The religious authorities receive the RO request from
the example in Fig. 3). Once a RO is detected in the CA, we
the civil authorities, and then the religious authorities
read it to identify if it was an RO for shortage of rain (PPR)
decide the RO date and ceremony type.
or an RO for rain to stop (PSR). The text always explicitly
iii. The ceremony is performed. specifies this information because it provides an explanation
about the reasons why an RO was organised (“does not rain”
iv. When rain occurs, the religious authorities decide to or “shortage of rain” are the most frequently found wordings
give a thanksgiving mass. when requesting a PPR). Then, we analyse the liturgy used
in the RO to determine its level. By following the example in
The institutionalisation of the RO process allows us to dif- Fig. 3, an agreement is reached at the CCO to carry a figure
ferentiate between different RO levels, depending on the of the Virgin Encarnación to perform the RO in church, so
performed ceremony type. The RO cost has increased in its intensity level is level 2. With this information, we will
line with an augmented RO level (Espín-Sanchez and Gil- obtain the date the RO was held, the reason for or type of RO
Guirado, 2016). We adapted the methodology proposed by (drought PPR) and its level (level 2). So with this information
Martín-Vide and Barriendos (1995) by classifying PPR into classified by date, type and level, it is easy to aggregate data
five different levels of drought intensity, from level 1 (the later to offer data on a monthly, seasonal or yearly basis.
weakest drought) to level 5 (the severest drought). The dif-
ferent levels are as follows:
3.2 Content analysis
1. RO masses held in church;
One of the main problems which palaeoclimatologists en-
2. RO masses held with figures of saints or virgins exhib- counter when transforming the qualitative information con-
ited in church; tained in documental information into quantitative data is ho-
mogenisation when describing in writing a climate-type phe-
3. popular processions through city streets with figures of nomenon. The official nature of documents is an advantage
saints or virgins; for such cases because the patterns and ways to act over time
are repeated, and some terms that refer to possible climate
4. popular pilgrimages to a sanctuary outside the city, car-
events are constantly repeated. A CA is a research technique
rying figures of saints or virgins; and
used to identify the meaning given to full written texts by
5. water body immersion (river, well or fountain) of the taking into account the historic and socio-cultural contexts
figures of saints or virgins. in which they were drafted (Bardin, 1986). The intention of
a CA is to quantify a series of parameters to carry out sta-
In addition to PPRs, PSRs are also recorded, but much less tistical analyses. This is a matter of analysing the frequency
frequently, as reported below. Accordingly, PSRs are also with which terms were used and the intensity of certain key
classified into five increasing levels of rain intensity: concepts, defined as time units or in the space they occupy
Clim. Past, 15, 1303–1325, 2019 www.clim-past.net/15/1303/2019/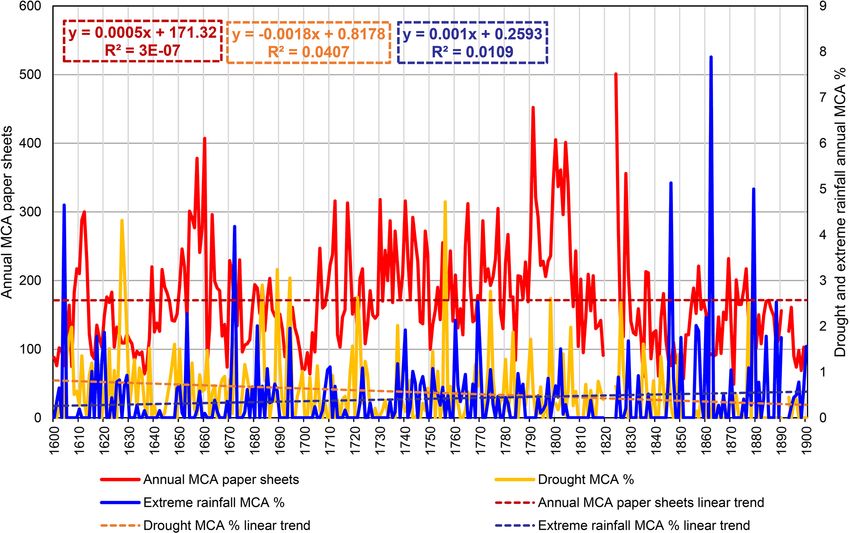
S. Gil-Guirado et al.: The weather behind words                                                                                          1309

Figure 3. RO method by step (a) and encoding example of the RO method (b). This particular example refers to a pro pluvia RO on
18 April 1698, so the reconstructed variable is drought. Source: the Carmesi Project. This text is written in Old Spanish. An approximate
translation is the following: “They said that the season is very advanced and it has not rained and the population is afflicted, and unless God
helps us with rain the crops will be lost. Therefore, they agreed to bring the image of “Our Lady of Encarnación” and to celebrate nine masses
praying so that She asks to her Son to help us with rain.”

in the document. The use of CA in climate studies is rel-                   Documentation encoding was done on the topics in the
atively recent and not yet widespread. Moodie and Catch-                  MCA, which are susceptible to contain information about
pole (1975), and later Baron (1982), pioneered the CA appli-              droughts and extreme rainfall. They are mainly the follow-
cation in HC. Recently, the works of Prieto et al. (2003, 2005)           ing:
have promoted this technique by showing its validity for en-
vironmental history. Some studies have used this technique                   – PPR and PSR topics;
in the Iberian Peninsula (Domínguez-Castro et al., 2015) but
                                                                             – information about crops (mainly cereals and wine);
only for a limited number of years and without it overlapping
instrumental data.                                                           – information about food prices (bread, wine, meat, etc.);
   CA studies must follow several steps to be conducted.
Bardin (1986, p. 71) distinguishes the following: (1) the pre-               – cattle status topics;
analysis, when the documents to study are selected, the hy-
pothesis is formulated and objectives are set; (2) the use of                – measures taken against floods and droughts;
material, when documentation is encoded; (3) data process-
                                                                             – topics about not paying taxes and the reasons; and
ing, inference and interpretation.
   We used the Caravaca MCA according to the present work                    – information on the state of roads and communications.
objectives and hypothesised that the different linguistic ex-
pressions employed by contemporary people to describe a                   After locating all the expressions containing information
climate event and to report the intensity, duration and direc-            about droughts and extreme rainfall, this information is clas-
tion of this event.                                                       sified according to date (Fig. 4a, steps 1 and 2). Next, all the

www.clim-past.net/15/1303/2019/                                                                        Clim. Past, 15, 1303–1325, 2019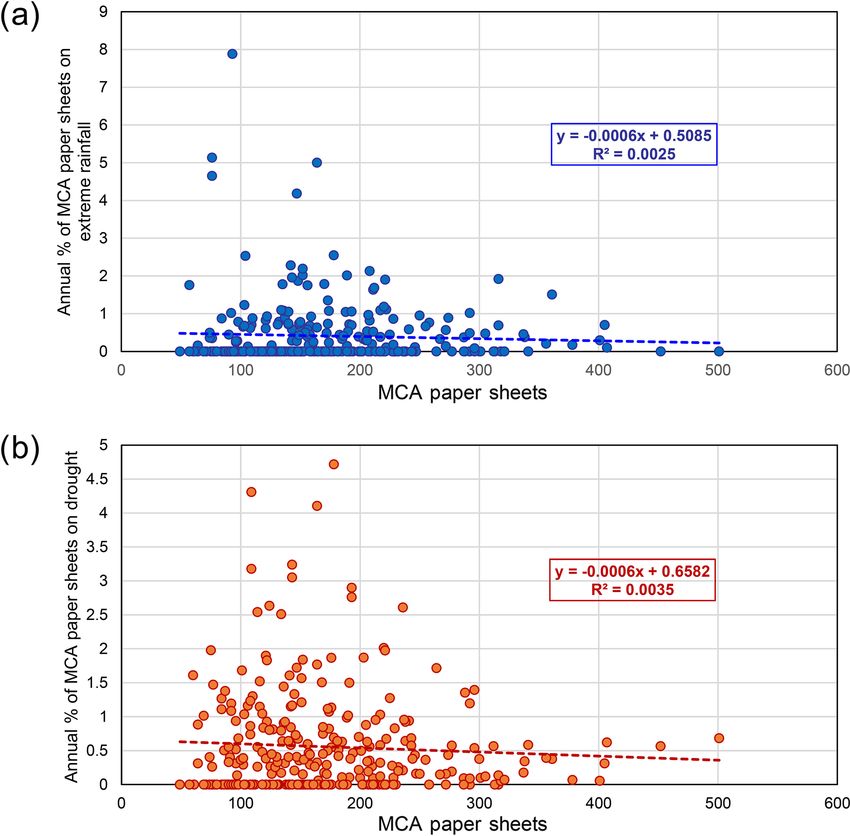
1310                                                                                S. Gil-Guirado et al.: The weather behind words

information about the news is read to identify the exact ex-             3.3   Opportunity Cost for Small Towns (COST)
pression that defines the climate event (Fig. 4a, step 3). As
Prieto et al. (2005, p. 45) point out, many expressions are              We propose a new methodology to be applied to small towns,
synonymous, so the initial number of expressions detected to             the Cost Opportunity for Small Towns (hereinafter referred
define a drought (341 different expressions) is summarised               to as COST). This method provides comparable results with
in 49 registration units (RUs) for droughts. For extreme rain-           the CA and RO methods, as it is also based on a text anal-
fall events, the 105 different expressions are summarised in             ysis. However, it exploits the volume occupied by the text,
42 RUs. To identify the exact meaning of each RU, Spanish                rather than subjective linguistic terms. In fact, if the inten-
language dictionaries covering the entire study period were              sity of certain key concepts is analysed in a CA, the COST
reviewed2 . As seen in similar studies in the Spanish language           approach analyses the same key concepts but in units of the
(Prieto and Jorba, 1991), no evident changes exist in the use            space occupied in the document; i.e. we obtain the amount of
of language to describe climate anomalies during the study               MCAs that cover extreme rainfall and drought matters.
period.                                                                     The underlying hypothesis is that the larger the amount of
   The next step (Fig. 4a, step 4) consists in assigning a nu-           paper used to describe a climate event, the greater the inten-
merical value and classifying it according to its intensity              sity and the longer the duration of this event. The require-
(greater or lesser drought intensity and greater or lesser ex-           ments of this methodology are as follows:
treme rainfall intensity) to the various RUs. To assign a value            i. availability of continuous and homogeneous documen-
to each RU, we considered all the RUs for each variable                       tary sources and
(drought and extreme rainfall) by establishing a range be-
tween 1 and the total number of RUs of this variable. The RU              ii. the use of paper must have some kind of economic limi-
with the lowest intensity is assigned to a value of 1, whereas                tation. This condition implies that referring to a particu-
the RU with the most intensity is associated with a number                    lar issue has an opportunity cost for not using that paper
that equals the total number of RUs. Between a range of 1                     for another topic.
and the total number of RUs of that variable, the rest of the
RUs were classified from lower to greater intensity. Finally,            The use of paper in MCAs was affected by the taxes imposed
values were normalised to provide a value between 0 and 1.               by the Central State through the “papel sellado” (sealed pa-
   To determine the position of each RU within its range of              per). The sealed paper in Spain was a special type of paper
the variable, we categorised firstly the general descriptors             with a royal seal to improve the reliability of public deeds
of the phenomenon and secondly adjectives and adverbs. In                and to contribute to the cost of the monarchy (Rodriguez,
this way, descriptors determined intensity (Prieto and Jorba,            1996). This paper was an expensive material that incurred
1991, p. 50).                                                            significant expenditure for CCOs. From the 17th century in
   For example, we assigned the value of 1 to the RU “al-                Spain, needs for paper exponentially increased and, at the
guna falta de agua” (“some water is lacking”) because it de-             same time, the Spanish paper industry could not meet pa-
scribes mild drought. We assigned a value of 49 to the RU                per demands (Hidalgo-Brinquis, 2006). This situation forced
“extrema necesidad del agua” (“extreme need for water”) as               CCOs in small towns to take austere measures for using
it describes the worst recorded drought. Thus, by using val-             paper. Thus, the second above-described condition is met.
ues between 1 and 49, the remaining 47 RUs were classi-                  Moreover, all the topics discussed during CCO meetings in-
fied from less to more drought intensity. In the example (see            curred a high cost for towns. Firstly, a series of direct ex-
Fig. 4b), the expression “the season is very advanced and it             penses was necessary during each meeting, e.g. the food and
has not rained” found in information about a pro-rain RO, is             drink that the participants took, wax for lighting, the partic-
included in the “no rain” RU, which is located in position 10            ipants’ travelling costs, paying the salaries of public scribes,
of the 49 drought RU, with an intensity value of 0.2.                    stewards. Secondly, each topic was preceded by a previous
                                                                         work to analyse the situation and to collect the necessary in-
   2 Covarrubias, Sebastián De: Tesoro de la lengua castellana o         formation (Martínez, 1996).
española. Madrid, Luis Sánchez, 1611. Gaspar y Roig: Biblioteca             From these requirements, we quantified the amount of pa-
Ilustrada de Gaspar y Roig. Diccionario enciclopédico de la lengua       per (percentage of MCA used during CCO meetings), includ-
española, con todas las vozes, frases, refranes y locuciones usadas      ing any information about drought and rain. Thus, the studied
en España y las Américas Españolas [. . . ] Tomo I. Madrid, Im-          variables are the same as for MCA. The encoding was done
prenta y Librería de Gaspar y Roig, editores, 1853; Gaspar y Roig:
                                                                         on the same MCA topics as in the CA (see the previous sec-
Biblioteca Ilustrada de Gaspar y Roig. Diccionario enciclopédico
de la lengua española, con todas las vozes, frases, refranes y locu-
                                                                         tion).
ciones usadas en España y las Américas Españolas [. . . ] Tomo II.          The official nature of MCAs determines that neither their
Madrid, Imprenta y Librería de Gaspar y Roig, editores, 1855. Real       structure nor their composition has varied during the study
Academia Española. Diccionario de la Lengua Española, vigésima           period. However, it is true that the quantity of paper used
segunda edición. Available at https://dle.rae.es/ (last access: 10 Oc-   each year presents wide interannual variety. This variability
tober 2018).                                                             in the amount of sealed paper may have something to do with

Clim. Past, 15, 1303–1325, 2019                                                                    www.clim-past.net/15/1303/2019/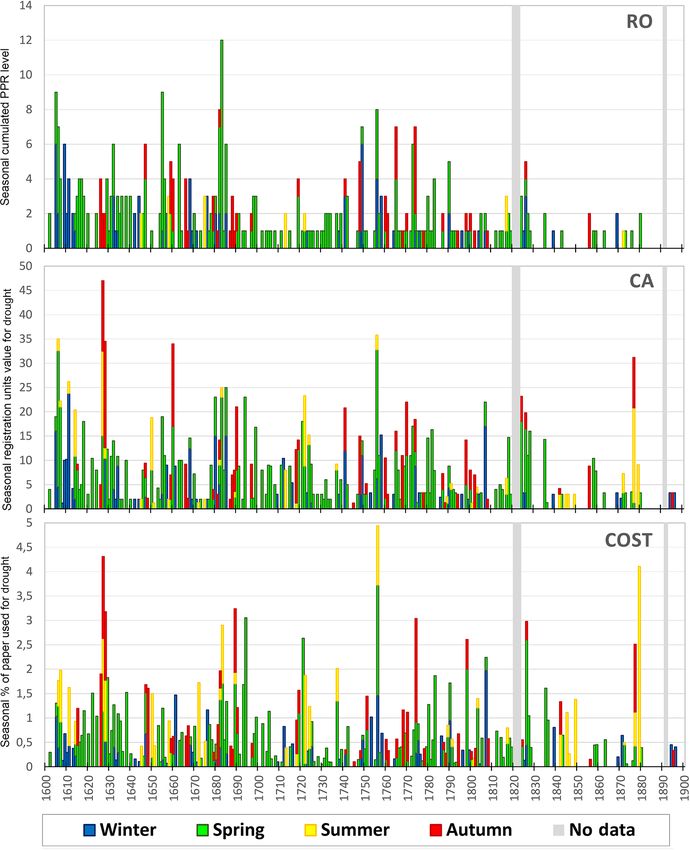
S. Gil-Guirado et al.: The weather behind words                                                                                          1311

Figure 4. Content analysis method by step (a) and an example of the encoding of the CA method (b). The coded source is the same as in
Fig. 2 to emphasise how the three different approaches are applied in practice. This particular example refers to a PPR on 18 April 1698, so
the reconstructed variable is drought. Source: the Carmesi Project. ∗ This text is written in Old Spanish. An approximate translation is the
following: “They said that the season is very advanced and it has not rained and the population is afflicted, and unless God helps us with rain
the crops will be lost. Therefore, they agreed to bring the image of “Our Lady of Encarnación” and to celebrate nine masses praying so that
She asks to her Son to help us with rain.”

the need to deal with more or fewer matters during a given                Nonetheless, less paper was used in the months of November
period. It might also be related to CCOs having bigger bud-               and December in Caravaca (see Fig. A3 in Appendix A).
gets because, if more money was available, CCO could have                    To expedite the COST implementation, digitising docu-
posed fewer restrictions on the use of paper. Nonetheless,                mentary sources is recommended. In this work, the Caravaca
the variability in the amount of paper used each year shows               MCAs are available on the Carmesi Project3 website for the
no trend with time (see Fig. A1 in Appendix A). Moreover,                 1600–1699 period. For the 1700–1900 period, the authors
no statistical correlation was found between the quantity of              had access to MCA photographs. These photographs were
sealed paper used each year and the percentage of this paper              taken during a collection data campaign in the Caravaca mu-
used to discuss droughts and extreme rain events (see Fig. A2             nicipal archive.
in Appendix A). Moreover, in extreme years, in terms of the                  The steps to follow to implement this methodology were
quantity of sealed paper used (regardless of this amount be-              as follows (see Fig. 5a): (1) detect the place where there is in-
ing excessive or too small), no extreme percentages of the                formation about droughts or extreme rainfall events; (2) date
sealed paper used to discuss droughts and extreme rain events             the event; (3) count the total amount of sealed paper used
were found.                                                               during this meeting to talk about drought or extreme rainfall
   As for the seasonality of the employed sealed paper,                   events; (4) calculate the percentage of this information of all
royal ordinances expected council meetings to be held once
weekly, irrespectively of the time of year. For this reason, the             3 The Carmesi Project website: http://www.regmurcia.com/
use of sealed paper presented no seasonality and the amount               servlet/s.Sl?METHOD=FRMSENCILLA&sit=c,373,m,139,serv,
of used paper was similar for all the months of the year.                 Carmesi (last access: 10 October 2018)

www.clim-past.net/15/1303/2019/                                                                        Clim. Past, 15, 1303–1325, 2019
1312                                                                             S. Gil-Guirado et al.: The weather behind words

the sealed paper used during this meeting and of all the sealed    Table 1. Basic statistics of the reconstructed series by the three
paper used that year.                                              methods for both droughts and extreme rainfall, respectively. N
   The encoding procedure is as follows (see Fig. 5b): we di-      refers to the number of months where the series differs from zero
vide each MCA sheet into 200 cells. In this way, each CCO          during the 1600–1900 period, excluding data gaps (1820–1823 and
meeting is broken down into a number of cells and a date.          1891–1892). Percentage (%) indicates the fraction of months in-
                                                                   cluding an event. X and S represent the mean and standard devia-
Then, we quantify the number of cells occupied by the stud-
                                                                   tion of the series, respectively. The average deviation is a dispersion
ied variables (if any). At this point, we have the dates, the      metric calculated as the average of the absolute difference between
amount of total cells and the amount of cells occupied by          a given month and the mean of the series.
each variable. Finally, for each meeting, we aggregate the to-
tal cell number and the number of cells in each variable, and                                     Drought              Extreme rainfall
then we calculate the percentage occupied by each variable
                                                                                           RO      CA       COST    RO       CA     COST
for each meeting. In the example provided in Fig. 5b, we can
see that a meeting was held on 18 April 1698, during which             N                    228    301        301     22     154       154
almost six sheets of sealed paper were used (a total of 1140           %                   6.44   8.50       8.50   0.62    4.35      4.35
                                                                       X                   2.39   8.72       0.85   1.50   11.33      0.96
cells of papers). Of this amount of paper, less than one sheet         S                   1.84   7.82       0.80   0.96   10.08      1.09
(150 cells) was used to talk about a matter related to the prob-
lems that resulted from the drought taking place at that time;         Average deviation   0.74   0.71       0.71   0.71    0.80      0.61
150 cells represent 13.16 % of all the cells of this meeting. If
we bear in mind that 19 600 cells of sealed paper were used
(98 pages of MCA used by the Caravaca CCO in 1698), we             4       Results
obtained 0.77 % of all the sealed paper employed in 1698 to
discuss the April drought. In this work, we used values re-        The number of extreme rainfall and drought events recon-
lated to annual values; i.e. for every month, we represent the     structed by the CA and COST approaches is equal, while
percentage of MCAs employed to discuss drought and ex-             this number is always smaller in RO. This is due to the fact
treme rainfall events in relation to all the annual MCAs.          that whenever documents reflect drought or excess rainfall
                                                                   events, this information can be classified according to CA
3.4    Climate analysis of the series of drought and
                                                                   and COST. However, the RO method only allows climate in-
       extreme rainfall
                                                                   formation to be collected when these events lead to liturgical
                                                                   processes of ROs. Therefore, all the RO data are included
The analysis of the consistency of the data involves homo-         by both CA and COST and also coincide temporarily with
geneity tests that allow to find abrupt changes, as well as        one another, while some data obtained by applying the CA
to discern whether such changes have either a climatic or          and COST data are missed by RO. In our study, 7.1 % of the
a methodological origin. This analysis is carried out for the      months between 1860 and 1900 take non-zero values in RO,
drought and extreme rainfall reconstructed series separately.      whereas this value reaches 12.9 % of the months in CA and
For each variable, we have applied standard homogenisation         COST. This indicates the better sensitivity of RO to hydrom-
tests to both the frequencies of appearance and the intensities    eteorological extremes. However, this asymmetry depends on
of annual values. We use several non-parametric tests to de-       the variable being reconstructed. Hence, major differences
termine possible changes in the data. Although robust, they        appear between drought events (6.4 % of the months in RO
all have the disadvantage of being able to identify a single       versus 8.5 % in CA and COST) and extreme rainfall events
jump in the series. The homogeneity tests include the Pet-         (0.6 % of the months in RO versus 4.4 % in CA and COST)
titt test (Pettitt, 1979), the standard normal homogeneity test    (see Table 1).
(SNHT) by Alexandersson (1986) and the Buishand rank test             This has two main consequences: (1) reconstruction meth-
(Buishand, 1982). Due to their similarities, the results are       ods are more sensitive to drought events than to rainfall. De-
very similar among tests. However, the Pettitt test is the most    Menocal (2001, p. 667) argues that this lack of rain is the
widely disseminated, while the SNHT has a mathematical             factor that most strongly affects human activities in semiarid
predisposition to detect jumps near the beginning and end of       regions; (2) the applicability of RO to reconstruct extreme
the series. On the other hand, the Buishand rank test is more      rainfall events is not as clearly established as it is for drought.
sensitive to non-homogeneities in the middle of the series         This is because the religiosity associated with climate is more
(Renom Molina, 2009). The XLSTAT software (Addinsoft,              tightly bound to climate situations with a stronger potential-
2018) has been used for the application of these tests.            ity to produce long-term impacts on society, which is the case
    We also analysed the low-frequency variability of the re-      of droughts in semiarid climate zones (Espín-Sanchez and
constructed indices by analysing the 10-, 20- and 30-year          Gil-Guirado, 2016).
running means and by the Mann–Kendall test with a 95 %                Table 1 summarises the number of months with drought
confidence level. The XLSTAT software (Addinsoft, 2018)            and extreme rainfall events during the 1600–1900 period for
was used to run these tests.                                       all three methodologies. The average and standard deviation

Clim. Past, 15, 1303–1325, 2019                                                                   www.clim-past.net/15/1303/2019/
S. Gil-Guirado et al.: The weather behind words 1313
Figure 5. COST method by step (a) and an example the COST method encoding (b). The coded source is the same as in Figs. 3 and 4
to emphasise how the three different approaches are applied in practice. This particular example refers to a PPR on 18 April 1698, so the
reconstructed variable is drought. Source: the Carmesi Project.
values are also shown for descriptive purposes only. RO has 4.1 Annual cycle and agroclimatic context
an average PPR of level of 2.4, whereas PSR has a level of
1.5. CA indicates an average intensity of 8.7 RU for drought Relating the annual cycle of the reconstructed series with the
and an average intensity of 11.3 RU for extreme rainfall. Fi- water variability of the agricultural system allows their ro-
nally, COST leads to 0.9 % and 1 % of paper used to discuss bustness to be analysed. Indeed, the strong decoupling be-
each event type on average, respectively. In this way, we can tween reconstructed series and water agricultural require-
see how the average extreme rainfall values are above those ments could invalidate the use of historic documents to re-
for lack of rainfall in CA and COST, whereas this situation construct climate (Gil-Guirado et al., 2016) because it would
is reversed for RO. This further illustrates the lower sensi- indicate that the social water demand is not related to water
tivity of RO to detect the previously discussed extreme rain- scarcity.
fall. The variability of the indices obtained by the three meth- With droughts, the averaged frequency and intensity
ods differs and depends on the variable being reconstructed. present an absolute maximum in spring, together with a sec-
While the average deviation in droughts indicates similar val- ondary one in autumn and a minimum in summer (seen more
ues across all methods, with extreme rainfall, this value is clearly in RO) (see Fig. 6a). This annual cycle can be di-
lowest for COST and highest for CA. CA tends to overesti- rectly related to the distribution of precipitation in Caravaca
mate extreme rainfall events. given its continental Mediterranean character. Spring is the
rainiest season, followed by autumn, but summers are dry.
www.clim-past.net/15/1303/2019/ Clim. Past, 15, 1303–1325, 20191314 S. Gil-Guirado et al.: The weather behind words
few extreme rainfall events in RO (N = 22) reduce the relia-
bility of the frequencies reconstructed by this approach. It is
noteworthy that for rainfall, the reconstructed series reflects
the inherent heterogeneity of precipitation to the SE of the
Iberian Peninsula. Therefore, in spring and winter, precipita-
tion is associated with frontal systems, with potential damage
because water accumulates over several days. In autumn, se-
vere flash floods are associated with convective storms that
are frequent and have a strong impact (Martin-Vide, 2004).
Although convective precipitation is not exceptional in sum-
mer, which determines that CA and COST increase rainfall
intensity in June, this is the cereal harvesting month, and
therefore excessive rain can lead to major economical loss,
which is reflected in the documents. Both CA and COST in-
dicate high average intensities in the rainiest spring and au-
tumn months. Nevertheless, lack of a clear annual cycle sug-
Figure 6. Annual cycle of the values in the series associated with gests that the reconstructed precipitation spectrum is limited
RO, CA and COST. Panel (a) shows droughts, whereas (b) denotes mostly to flash flood episodes and also to events associated
extreme rainfall. The figures on the left represent the frequency with the presence of frontal systems.
(number of months with non-zero values) and those on the right de-
pict normalised intensity. Intensity is normalised by dividing each
datum by the maximum value of each series. 4.2 Seasonal variability and the coherence of
hydrometeorological extremes
In seasonal and annual drought variability terms (see Fig. 7),
The agricultural specialisation in this region, based on ce-
the three reconstruction methods coincide in pointing out the
real crop growing (mostly wheat and barley)4 , is the result
same long drought periods. However, the years with more
of adaptations to this seasonality. Autumn rainfalls are espe-
intensified droughts differ. While for RO the five driest years
cially critical for plant cereals, while spring rain is impor-
were 1683, 1605, 1655, 1756 and 1606 (where the fifth posi-
tant for optimal growth. Conversely, summer is the harvest-
tion is shared by the years 1749, 1765 and 1774), for CA this
ing season, so rainfall is not necessary in these months and
ranking includes the years 1627, 1606, 1628, 1660 and 1756.
can prove inconvenient if excessive. This explains why refer-
Finally, for COST, the five driest years were 1756, 1627,
ences to droughts in summer are rare in historic documents.
1879, 1689 and 1628, respectively. In this way, a clear in-
When severe drought occurs in spring, summer could suffer
termethod agreement is reached in that the years 1606, 1627,
issues that result from water shortages in spring. This might
1628 and, especially, 1756 were the driest. These droughts
explain why the differences between RO and the other two
are consistent with the results of other works. Corona et
approaches are especially large in summer. In these months,
al. (1988) detected a severe drought between 1602 and 1606
dry conditions may lead to water management requirements,
to the SW of the Iberian Peninsula based on dendroclimatic
which are recorded in historic documents, but did not lead to
evidence. Martín-Vide and Barriendos (1995, p. 212) iden-
any RO ceremony. In summary, the intensity and frequency
tified 1628 as one of the four driest years in Barcelona for
of the annual cycle specified in documents well reflect the
the 1525–1825 period. The year 1756 witnessed wide cli-
actual precipitation regime in Caravaca. This indicates that
mate variability in the Iberian Peninsula, characterised by se-
when water demand occurs in the months when water is lack-
vere droughts (Cuadrat et al., 2016, p. 72) and aggravated by
ing, it can have the strongest social impact and therefore
torrential rains and a severe locust plague (Alberola Romá,
demonstrates the ability of these reconstructed series to re-
1996).
flect actual past climate conditions, particularly drought vari-
The seasonal drought values in each year also show wide
ability.
temporal variability, as well as notable differences between
For extreme rainfall, major differences appear between the
methods. The agricultural model of Caravaca, based on ce-
frequencies of RO and the other two methods (see Fig. 6b).
real production, generally magnifies the impact of spring
RO shows a clear spring maximum, which counteracts the
droughts. Winters are, however, less sensitive, but were es-
season with the heaviest rains in Caravaca, whereas CA and
pecially dry between 1600 and 1615. The autumns of the
COST do not present such a clear maximum. However, the
second half of the 17th and 18th centuries increased the rel-
4 The Cadastre of the Marques de la Ensenada in 1756 pointed ative weight of droughts in annual computations. Although
out that the main agricultural products of Caravaca were wheat, the Caravaca society has adapted to lack of precipitation in
barley and rye. Ref. General File of Simancas: AGS-CE-RG-L463- summer, COST, and CA to a lesser extent, indicates very dry
324. summers in the 17th century and in the second half of the
Clim. Past, 15, 1303–1325, 2019 www.clim-past.net/15/1303/2019/S. Gil-Guirado et al.: The weather behind words 1315
of the 18th century, especially between 1855 and 1870, sev-
eral wet winters are also detected and coincide with wet
winters in Andalusia (Sánchez-Rodrigo et al., 2000). Spring
shows generally more homogeneous behaviour and no obvi-
ous anomalous periods. In autumn and summer, notable dif-
ferences appear between CA and COST. CA tends to exag-
gerate the intensity of several humid summers and autumns,
especially in the 17th century. Both methods coincide in in-
dicating the autumns of 1740–1775 as being very humid, like
the autumns in the second half of the 19th century. Barrien-
dos and Llasat (2009) highlight severe autumn rain in the sec-
ond half of the 19th century and associate it with a period of
strong climate variability to the east of the Iberian Peninsula,
identified as the Maldá anomaly. There are also many historic
studies on and testimonies from this epoch5 that point out
the sharp intensity of autumn rainfall in the Spanish Mediter-
ranean region in the second half of the 19th century (Barrien-
dos and Martín-Vide, 1998; Gil-Guirado, 2013) (Fig. 8). In
line with all this, an excellent source of evidence for rain in-
tensity during this period is pointed out by the fact that five of
the 10 rainiest years detected by CA and COST are included
in the 1829–1888 period, with three of these years only be-
tween 1650 and 1685.
To gain insight into the intra-annual differences of vari-
ability across the three methods, we need to bear in mind
Figure 7. Seasonal drought variability in Caravaca between 1600 several considerations. Regarding droughts, it is important
and 1900. Seasonal values accumulate for each year. In this way, the to take into account their continuous nature. Droughts show
annual value is defined as the sum of the four seasonal values for a their social impacts cumulatively over time, which makes it
given year. The values on the y axis are in the unit that corresponds difficult to define clear boundaries (Logar and van den Bergh,
to each methodology, i.e. the sum of the pro pluvia RO levels for 2013). This can be seen in our results, which account for the
each station in RO, the sum of the values of RU for the drought number of dry summers and were immediately preceded by
in CA and the percentage of paper used for droughts during each a dry spring (see Table 2). More than 50 % of summers with
season in COST. Note: data gaps (from 1820 to 1823 and 1891 to drought were preceded by a dry spring. However, these cor-
1892) are shown in grey.
relative droughts do not occur as frequently in winter, spring
or autumn. This allows us to infer further information about
the severity of spring drought when both CA and COST in-
19th century. However, RO is unable to provide any informa- dicate dry summers. A similar analysis reveals clear differ-
tion about droughts for these months because RO ceremonies ences for extreme rainfall events. Unlike droughts, extreme
are lacking. rainfall manifests its impact immediately, and therefore doc-
The annual and seasonal series of indices associated with uments reflect them with no delay or with references to pre-
extreme rainfall offer some interesting aspects (Fig. 8). The vious events. This explains the lack of autocorrelation noted
rarity of extreme rainfall reconstructed by RO is remarkable between consecutive seasons. Both CA and COST detect a
as only 4 months had extreme rainfall events throughout the correlation between wet summers and previous wet springs
19th century. This situation reduces this method’s reliability (see Table 2).
to reconstruct precipitation. Note that this factor does not af-
fect the CA and COST methods, which were able to record
many extreme rainfall events throughout the study period.
Both CA and COST report wet winters at the end of the
17th century. This period is consistent with the coldest and 5 In this climate context, and after the notable damages caused by
wettest winters detected for the same period by Alcoforado et the continuous floods in the late 19th century in SE Spain, a number
al. (2000) to the south of the Iberian Peninsula and might in- of studies were conducted to mitigate the negative impacts of floods.
dicate a strengthening of the zonal circulation associated with Indeed, the work of Hernández Amores (1885) titled “Inundaciones
the polar front during the late Maunder Minimum (Luter- de la huerta de Murcia: juicio sobre su frecuente repetición de pocos
bacher et al., 2001), which is also consistent with climate años a esta parte, sus terribles desastres, sus causas y remedios” is
simulations (Gómez-Navarro et al., 2011). In the second half a prominent example.
www.clim-past.net/15/1303/2019/ Clim. Past, 15, 1303–1325, 2019You can also read