THEPATH FORWARD - AnnualReports.com
←
→
Page content transcription
If your browser does not render page correctly, please read the page content below
®
THEPATH
     FORWARD

                  ®

             PREIT 2012
         ANNUAL REPORT
THE PATH
      FORWARD
In the pages ahead, we will discuss The Path Forward, focusing on four strategic
objectives – balance sheet improvement, operational excellence, elevating portfolio
quality and positioning for growth – that will allow us to achieve our vision:
Driving shareholder value through the creation of dynamic and compelling shopping
environments for the retailers, consumers and communities we serve.

Pennsylvania Real Estate Investment Trust, founded in 1960 and one of the first equity REITs in the U.S., has a primary investment focus on retail shopping malls.
As of December 31, 2012, the Company’s portfolio of 49 properties comprised 38 shopping malls, eight community and power centers, and three development
properties. As of the record date, the Company’s portfolio of 46 properties comprises 36 shopping malls, seven community and power centers, and three development
properties.The Company’s properties are located in 13 states in the eastern half of the United States, primarily in the Mid-Atlantic region. The operating retail properties
have approximately 31.0 million total square feet of space. PREIT, headquartered in Philadelphia, Pennsylvania, is publicly traded on the NYSE under the symbol PEI.
The Company’s website can be found at preit.com.

PENNSYLVANIA REAL ESTATE INVESTMENT TRUST                               (in thousands, except per share amounts)

Year ended December 31,                                                                                                 2012                   2011                   2010

Funds from operations*                                                                                       $        95,617        $      105,585         $        99,214
Total revenue                                                                                                $       427,182        $      427,003         $      426,057
Loss from continuing operations                                                                              $       (42,892)       $       (66,574)       $       (75,397)
Net loss attributable to common shareholders                                                                 $       (48,821)       $       (90,161)       $       (51,927)
Loss from continuing operations per share – basic and diluted                                                $          (0.90)      $          (1.18)      $         (1.44)
Net loss per share – basic and diluted                                                                       $          (0.89)      $          (1.66)      $         (1.04)
Investment in real estate, at cost                                                                           $     3,477,540        $    3,576,997         $    3,587,468
Total assets                                                                                                 $     2,877,624        $    2,910,254         $    3,080,117
Distributions paid per common share                                                                          $           0.63       $           0.60       $          0.60
Number of common shares and OP Units outstanding                                                                      58,632                 58,006                 57,765
Total market capitalization                                                                                  $     3,337,292        $    2,973,126         $    3,241,799

*Reconciliation to GAAP can be found on page 14.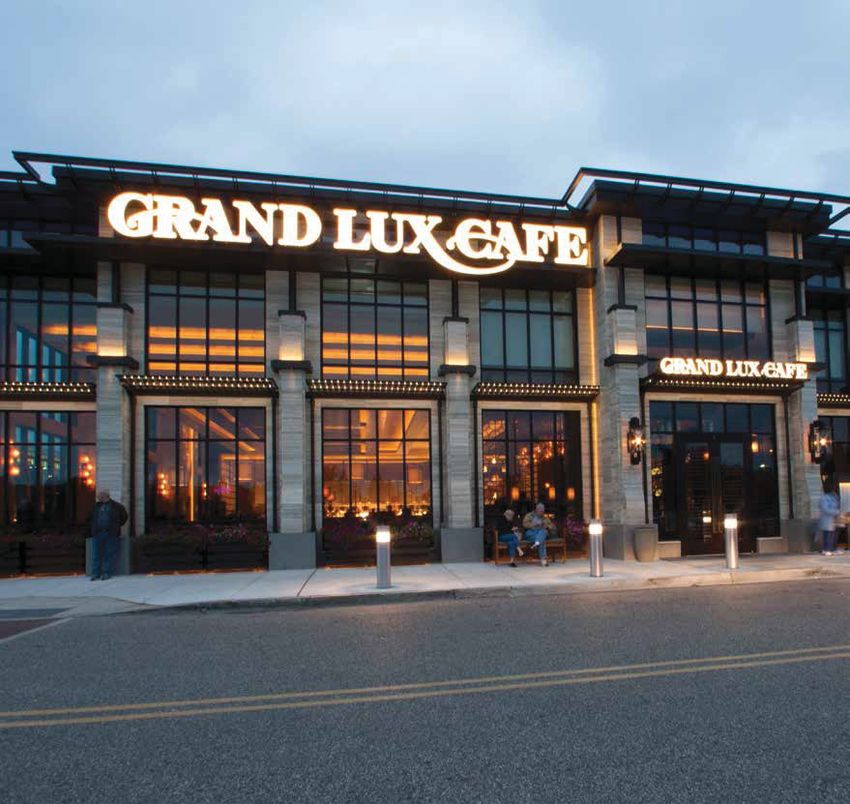
The new movie theater under construction
                                                  at Moorestown Mall, Moorestown, NJ.
DEAR FELLOW
       SHAREHOLDERS
We made significant progress during the           At year end, we held a total of 49 properties comprising approximately 33 million
past year. In 2012, we transformed PREIT         square feet – including 38 shopping malls, eight community and power centers and
and the results included a stronger balance      three development properties. Since 2013 began, we divested of three non-core
sheet, improved operating metrics, a higher      properties: Phillipsburg Mall, Orlando Fashion Square and Paxton Towne Centre.
quality portfolio and powerful returns to        And we have another, Christiana Center, under agreement of sale.
shareholders.
                                                 POSITIVE FINANCIAL RESULTS
Most important, we charted a path to             Our 2012 operating and financial results illustrate the potential of PREIT’s long-term
future growth that is clear, achievable and      strategy. Funds from operations, as adjusted, same store net operating income
full of promise.                                 (“NOI”), occupancy and sales per square foot all improved over 2011.
STRONG FUNDAMENTALS                              Thanks to these results, investors continued to recognize the value of our Company
PREIT’s portfolio of malls and power             and its strategy. Over the course of the year, the price of PREIT’s common shares
centers recorded strong results in 2012.         increased by nearly 70 percent. We have recorded our 144th consecutive dividend
We increased same store comp sales to            payment and increased the dividend paid on our common shares by 20% to $0.18
$378 per square foot from $370 in 2011,          since the beginning of 2012.
while same store total mall occupancy
grew to 94.3% at year-end – up from              THE PATH FORWARD
93.1% in 2011.                                   In the pages ahead, we will discuss our Path Forward, focusing on four strategic
                                                 objectives – balance sheet improvement, operational excellence, elevating portfolio
These results can be attributed to the quality   quality and positioning for growth – that will allow us to achieve our vision:
of our portfolio, the creativity of our team     Driving shareholder value through the creation of dynamic and compelling shopping
in enhancing our shopping environments,          environments for the retailers, consumers and communities we serve. Accomplish-
and the development of solutions that are        ing these strategic objectives is designed to position us to deliver strong returns to
unique to each market. We also benefited          our shareholders.
from increased retailer demand and the
resiliency of the U.S. consumer.                 I am honored to be at the helm as we pursue this path, having assumed the title
                                                 of Chief Executive Officer in June 2012 when Ronald Rubin became Executive
ENHANCING OUR PORTFOLIO                          Chairman. I established priorities for our team and created a focus on values that
We are enhancing our portfolio by attracting     emphasize innovation, collaboration and a culture of ownership.
new and diverse retailers, restaurants and
                                                 I am confident that The Path Forward is leading to success because I am confident
entertainment destinations to our properties
                                                 in our team – which includes our trustees, employees, retailers, shoppers and
and by disposing of properties that do
                                                 shareholders. All of us in the PREIT organization are grateful for their steadfast
not fit with our strategy. This emphasis on
                                                 support and pledge to continue efforts to optimize value for our stakeholders in
a higher quality portfolio is improving our
                                                 the years ahead.
performance and allowing us to focus on
assets where value creation prospects are
strongest. It is also enticing customers to
increase both the number and the duration
of their visits.
                                                 Joseph F. Coradino
                                                 Chief Executive Officer
                                                 April 5, 2013

BALANCE SHEET
      IMPROVEMENT
As one of our top priorities, we made          In total, we completed nearly $500 million in property-level financings in 2012.
significant improvements to our balance         These transactions generated net proceeds of approximately $102 million, reduced
sheet in 2012. We reduced our outstand-        average interest rates from 5.54% to 4.25% and increased the weighted average
ing debt level, lowered interest rates on      maturity of our mortgage loans from 3.4 years to 5.0 years.
refinanced mortgages and our 2010 credit
facility, increased the length of our debt     AN ONGOING PURSUIT
maturities, unencumbered selected assets,      The combined interest savings from our 2012 financing activities will result in a
and maintained strong liquidity levels.        considerable reduction of one of our key expenses – interest. But our pursuit of
                                               balance sheet improvement is far from complete.
INTEREST RATE AND DEBT                         With interest rates remaining near historic lows, we will seek opportunities to
LEVEL REDUCTION
                                               reduce costs and improve our financial ratios. At the same time, we will strive
With borrowing costs at their lowest levels
                                               to take advantage of our growing financial strength to deliver stronger returns
in decades, we were active in the capital
                                               to shareholders.
markets, issuing securities and refinancing
key properties to lock in lower rates for
the future.
We took advantage of the preferred share
market by issuing two series of preferred
shares – one in April and one in October –
that generated combined proceeds of
$195,200,000. We used the proceeds
to reduce other indebtedness.
We negotiated attractive financing terms on
a range of properties refinanced throughout
our portfolio, which reduced our base of
long-term, fixed-rate interest costs. In
August, for example, we reduced the
effective interest rate on the loan secured
by Cherry Hill Mall in Cherry Hill, NJ,
by 1.5 percentage points. In addition to
strengthening our balance sheet, this
transaction highlighted the value we created
at this property from the 2009 redevelop-
ment and ongoing tenancy upgrades.
The new Grand Lux Cafe, The Cheesecake Factory’s “super upscale casual dining” concept, opened at Cherry Hill Mall in Cherry Hill, NJ, in July 2012.
It is one of only 11 locations in the country.
OPERATIONAL
     EXCELLENCE
As a pioneer in the REIT industry, PREIT          restaurants at the mall that includes The Capital Grille, Seasons 52, Maggiano’s
has a wealth of practical knowledge in            Little Italy, Bobby Flay’s Bobby’s Burger Palace, California Pizza Kitchen and
real estate leasing and management.               Bahama Breeze.
We are applying this knowledge with
                                                  In 2013, Valley Mall in Hagerstown, MD, will debut Cafe Rio Mexican Grill, a leading
advanced strategies and fresh ideas as
                                                  quick-service restaurant; as well as Red Robin Gourmet Burgers, a family eatery.
we continue to improve the results of our
property operations.                              At Voorhees Town Center, in Voorhees, NJ, we welcomed Catelli Duo and Rodizio
                                                  Grill. Elena Wu, created by renowned restaurateurs with roots in the Voorhees area,
SALES GROWTH                                      opened in 2013 and we look forward to adding Iron Hill Brewery & Restaurant,
Our success is driven by the health of our        an award-winning brew pub, to the center’s lineup of restaurants later this year.
tenants. A key indicator of a retailer’s health
is sales performance. We are committed            OCCUPANCY IMPROVEMENT
to creating an environment that drives traffic     Through creative strategies, PREIT increased same store total mall occupancy
to and sales at our properties. Examples          by 120 basis points, to 94.3%, in 2012.
of this include the addition of premier or        By adding premier retailers, dining and entertainment establishments, as well as
catalyst retailers as well as the introduction    selectively introducing non-retail tenants – such as schools, offices, government
of restaurants and entertainment options.         services and healthcare providers – PREIT is helping its properties attract new
In November, we introduced a new Apple            customers while giving existing shoppers more reasons to extend their visits.
store to our portfolio at Willow Grove Park       In September, we introduced Mercy Health Center at Plymouth Meeting Mall in
in Willow Grove, PA. We look forward to           Plymouth Meeting, PA, the Northeast’s first full-scale medical health and wellness
welcoming new customers who will find              center at an enclosed mall. Offering a wide range of ambulatory services, the
an exclusive lineup of complementary              center is open seven days a week and rounds out offerings at the mall.
retail tenants to patronize. Earlier in the
year at Willow Grove Park, we completed           Another example of the creative solutions we employ can be seen at Voorhees Town
the remerchandising of a vacant depart-           Center, where we opened an exciting new Farmer’s Market in 2012. The market has
ment store to include Nordstrom Rack,             been a great community gathering spot and traffic builder on Saturday mornings
offering a less conventional option for           between May and October.
our shoppers.
Great restaurants are also proven traffic-
generators and offer a more comprehensive
experience for consumers. PREIT is con-
tinuing to bring destination dining to malls
throughout its portfolio.
At Cherry Hill Mall, for instance, 2012
saw the opening of the Grand Lux Cafe,
an upscale casual restaurant created
by the founder of the hugely successful
The Cheesecake Factory. Grand Lux Cafe
joins an already impressive lineup of
A new, large format Forever 21 replaced a vacant Borders bookstore at Patrick Henry Mall in Newport News, VA, one of PREIT’s Core Growth properties. This addition will serve as a catalyst as we continue to reposition the retail offerings at this center.
ELEVATING
PORTFOLIO QUALITY
PREIT has assembled a strong portfolio many new, high-quality, market-exclusive tenants, including The North Face,
of owned and managed properties in Pottery Barn, Teavana and an expanded Forever 21.
13 states, comprising more than 30 million
CORE GROWTH PROPERTIES
square feet of retail space after accounting
Core Growth properties, our mid-tier holdings, benefit from solid trade areas,
for the properties sold in the first quarter
dominant positioning or limited competition. In many cases, value remains
of 2013. We continue, however, to look for
to be realized through comprehensive remerchandising plans and targeted asset
ways to increase the quality level of our
strategies. These properties accounted for nearly 47% of same store NOI in 2012,
asset base.
excluding properties held for sale.
ASSET CLASSIFICATION An example of these solid performers is Capital City Mall in Camp Hill, PA, a suburb
We classified our mall portfolio in order to of the state capital, Harrisburg. As the region’s dominant mall, Capital City Mall
demonstrate its existing underlying quality features a number of first-to-market retailers and attracts strong daytime traffic
and to more clearly identify opportunities to from nearby federal and state offices. The mall ended the year with total occupancy
drive value. Our four classes are Premier, of 96.9% and sales per square foot of $371. Going forward, we plan to continue
Core Growth, Opportunistic and Non-Core upgrading Capital City Mall’s dining, lifestyle and fashion-oriented junior apparel
malls. In 2012, approximately 80% of same options.
store NOI, excluding properties held for
sale, came from Premier and Core Growth OPPORTUNISTIC PROPERTIES
malls, which delivered an average of $416 The Opportunistic category represents properties within our portfolio that generate
in sales per square foot. moderate sales productivity. These properties do not account for a significant portion
of our same store NOI and will likely either improve and be reclassified as Core
PREMIER PROPERTIES Growth properties or become Non-Core properties. Opportunities to drive value
Our Premier properties are growing in value in these assets come in many different forms. In some cases it is tenant demand;
and will continue to benefit from selective in others it’s an investment made in the community that may drive tourism, job
tenant upgrading. These properties growth or land value.
accounted for nearly 33% of same store
NOI in 2012, excluding properties held PORTFOLIO MANAGEMENT
for sale. We continue to manage the portfolio through selective dispositions of properties that
we no longer consider strategic to us. In 2012, we initiated the disposition of seven
One example of a Premier property in
Non-Core properties, totaling 3.8 million square feet. Three properties were sold in
our portfolio is Woodland Mall in Grand
2013, one is under agreement of sale and we continue to market the balance.
Rapids, MI. Located in the heart of the
region’s premier retail hub, Woodland Mall
had a total occupancy of 98.3% at year-
end and recorded $530 in sales per square
foot. In addition to its prime location,
this high-quality property benefits from a
regional economy that is vibrant and grow-
ing, fueled by the healthcare, technology
and pharmaceutical industries. Over the
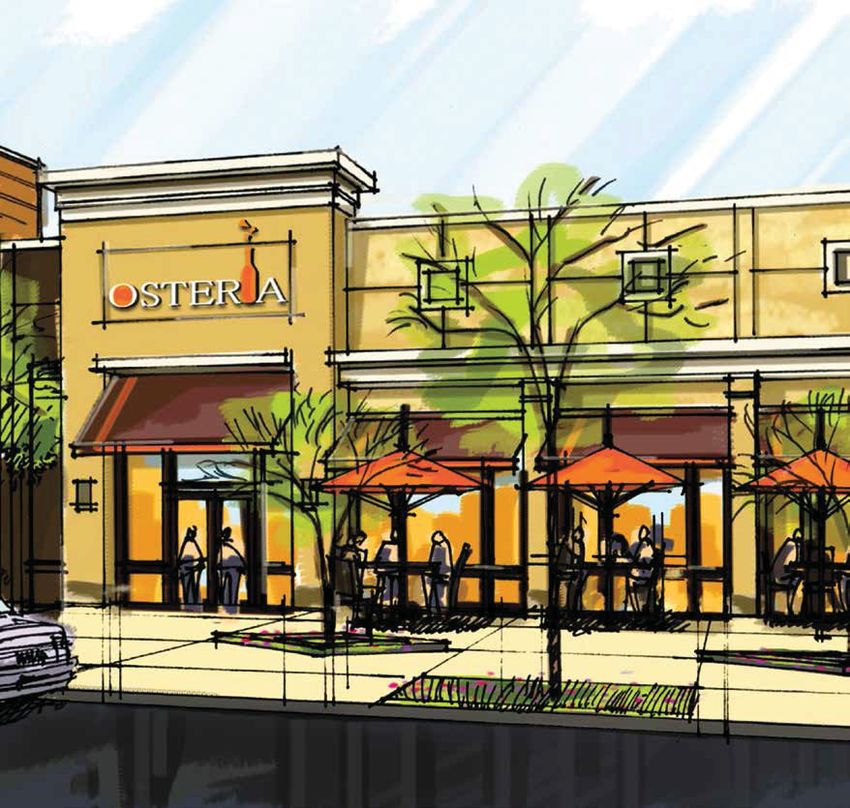
past two years, Woodland Mall welcomedAs part of the redevelopment plan, renowned Philadelphia-based chef Marc Vetri will open Osteria, his first suburban restaurant, at Moorestown Mall in Moorestown, NJ, in 2013. The original Osteria in Philadelphia was named one of Newsweek’s “101 Best Places to Eat in the World.”
POSITIONING
  FOR GROWTH
As we look toward our future and               Similarly, we continue to consider further investment in The Gallery at Market East,
continue to make improvements to our           a Core Growth property that is uniquely positioned in the heart of Center City
capital structure, operations and the          Philadelphia. We continue to work toward finalizing a remerchandising strategy
quality gradient of our portfolio, we know     that will help The Gallery at Market East achieve its full potential.
that growth prospects are critical to future
                                               STRINGENT ACQUISITION CRITERIA
valuation. We are currently focused on
                                               PREIT will also consider adding new properties to our portfolio, but only in cases
harvesting the returns on previously
                                               where we see a strong strategic fit.
invested capital and are mindful of applying
a careful, measured approach to future         When evaluating potential acquisitions, we look for properties in strategic locations
capital deployment. We will continue to        with operating fundamentals that are equal to, or better than, those of our existing
apply this discipline while considering        portfolio averages. The potential for meaningful NOI growth must exist along
growth through the most strategic acquisi-     with stable or growing demographic trends and opportunities to upgrade existing
tion opportunities.                            tenancy.

ORGANIC GROWTH                                 LOOKING FORWARD
Currently, our top priority is generating      2012 was a year of tremendous transformation and accomplishment for PREIT.
growth organically from our existing           As we look ahead to 2013 and beyond, we see a Company that is positioned to
portfolio.                                     continue the momentum of 2012. We have the right strategy, the right portfolio
                                               and the right team to achieve our vision. We are energized by the opportunities
A case in point is Moorestown Mall, in
                                               on the horizon and we are motivated to translate our objectives into greater value
Moorestown, NJ, a Core Growth property
                                               for stakeholders.
that we continue to support through capital
investment and creative solutions. In 2013,
Regal Cinemas will open the region’s only
12-screen Premium Experience Theater.
In addition, 2013 will bring the opening of
Firebirds Wood Fired Grill and renowned
chef Mark Vetri’s Osteria. Osteria’s sister
location, in downtown Philadelphia, is
one of the region’s most acclaimed
restaurants. A voter referendum in 2011
overturned a 100+ year ban on liquor
sales within the township and paved the
way for the addition of these fine dining
restaurants at the mall. We are pursuing
additional liquor licenses that would allow
us to add more restaurants in the future.
PENNSYLVANIA REAL ESTATE INVESTMENT TRUST
PROPERTIES As of March 31, 2013
ENCLOSED MALLS CITY STATE OWNERSHIP ACQUIRED SQUARE
INTEREST FEET
Beaver Valley Mall Monaca PA 100% 2002 1,154,000
Capital City Mall Camp Hill PA 100% 2003 609,000
Chambersburg Mall Chambersburg PA 100% 2003 454,000
Cherry Hill Mall Cherry Hill NJ 100% 2003 1,307,000
Crossroads Mall Beckley WV 100% 2003 475,000
Cumberland Mall Vineland NJ 100% 2005 944,000
Dartmouth Mall Dartmouth MA 100% 1997 671,000
Exton Square Mall Exton PA 100% 2003 1,086,000
Francis Scott Key Mall Frederick MD 100% 2003 711,000
Gadsden Mall Gadsden AL 100% 2005 502,000
The Gallery at Market East Philadelphia PA 100% 2003 1,090,000
Jacksonville Mall Jacksonville NC 100% 2003 489,000
Lehigh Valley Mall Allentown PA 50% 1973 1,158,000
Logan Valley Mall Altoona PA 100% 2003 782,000
Lycoming Mall Pennsdale PA 100% 2003 835,000
Magnolia Mall Florence SC 100% 1997 614,000
The Mall at Prince Georges Hyattsville MD 100% 1998 917,000
Moorestown Mall Moorestown NJ 100% 2003 1,003,000
New River Valley Mall Christiansburg VA 100% 2003 465,000
Nittany Mall State College PA 100% 2003 533,000
North Hanover Mall Hanover PA 100% 2003 452,000
Palmer Park Mall Easton PA 100% 1972/2003 458,000
Patrick Henry Mall Newport News VA 100% 2003 715,000
Plymouth Meeting Mall Plymouth Meeting PA 100% 2003 951,000
South Mall Allentown PA 100% 2003 405,000
Springfield Mall Springfield PA 50% 2005 611,000
Uniontown Mall Uniontown PA 100% 2003 699,000
Valley Mall Hagerstown MD 100% 2003 912,000
Valley View Mall La Crosse WI 100% 2003 606,000
Viewmont Mall Scranton PA 100% 2003 747,000
Voorhees Town Center Voorhees NJ 100% 2003 732,000
Washington Crown Center Washington PA 100% 2003 674,000
Willow Grove Park Willow Grove PA 100% 2000/2003 1,162,000
Wiregrass Commons Dothan AL 100% 2003 636,000
Woodland Mall Grand Rapids MI 100% 2005 1,163,000
Wyoming Valley Mall Wilkes-Barre PA 100% 2003 906,000
TOTAL MALLS 27,628,000COMMUNITY AND CITY STATE OWNERSHIP DEVELOPED SQUARE
POWER CENTERS INTEREST FEET
Christiana Center (held for sale) Newark DE 100% 1998 303,000
The Commons at Magnolia Florence SC 100% 1999 227,000
The Court at Oxford Valley Langhorne PA 50% 1996 705,000
Metroplex Shopping Center Plymouth Meeting PA 50% 2001 778,000
Red Rose Commons Lancaster PA 50% 1998 463,000
Springfield Park Springfield PA 50% 1998 275,000
Whitehall Mall Allentown PA 50% 1964/1998 575,000
TOTAL COMMUNITY AND POWER CENTERS 3,326,000
TOTAL PROPERTIES 30,954,000
MI
WI
PREIT PROPERTY MAP
NY
MA Regional Shopping Centers
MI Owned and Managed Properties
Managed Properties
NJ
PA Community and Power Centers
Owned and Managed Properties
Managed Properties
Development Properties
DE
MD Joint Ventures
WV
VA
NC
SC
AL
FLAVERAGE COMP SALES TOTAL RETURN PERFORMANCE
150
380
120
360
90
index value
dollars per square foot
60
340
30
320 0
2007 2008 2009 2010 2011 2012
PREIT S&P 500 NAREIT Equity Russell 2000
The five-year performance graph above compares our cumulative total shareholder
300 return with the S&P 500 Index, the NAREIT Equity Index and the Russell 2000
Index. Equity real estate investment trusts are defined as those which derive more
December 2008 2009 2010 2011 2012 than 75% of their income from equity investments in real estate assets. The graph
assumes that the value of the investment in each of the four was $100 on the last
Excludes Held for Sale properties trading day of 2007 and that all dividends were reinvested.
CONTRIBUTION TO SAME STORE NOI DEBT/EBITDA
3.0 12
Premier Properties
33%
2.5
11
Core Growth Properties 2.0
asset classification
47%
billions
ratio
1.5 10
Opportunistic Properties
1.0
14% 9
0.5
Non-Core Properties
0 8
2% December 2008 2009 2010 2011 2012
debt debt/ebitda
Categories represent mall NOI only Debt to EBITDA ratio is calculated based on definitions in the Company’s 2010
Excludes Held for Sale properties Credit Facility.Financial Contents
Selected Financial Information 14
Consolidated Financial Statements 15
Notes to Consolidated Financial Statements 20
Management’s Report on Internal Control Over Financial Reporting 41
Reports of Independent Registered Public Accounting Firm 41
Management’s Discussion and Analysis 43
Trustees and Officers 64
Investor Information Inside Back Cover
PENNSYLVANIA REAL ESTATE INVESTMENT TRUST 2012 ANNUAL REPORT 13SELECTED FINANCIAL INFORMATION (UNAUDITED)
(in thousands, except per share amounts) Year Ended December 31,
Operating results 2012 2011 2010 2009 2008
Total revenue $ 427,182 $ 427,003 $ 426,057 $ 419,668 $ 425,128
Loss from continuing operations $ (42,892) $ (66,574) $ (75,397) $ (41,500) $ (27,874)
Net loss $ (42,550) $ (93,935) $ (54,363) $ (90,091) $ (16,355)
Net loss attributable to PREIT common shareholders $ (48,821) $ (90,161) $ (51,927) $ (85,738) $ (15,766)
Loss from continuing operations per share –
basic and diluted $ (0.90) $ (1.18) $ (1.44) $ (0.99) $ (0.72)
Net loss per share – basic and diluted $ (0.89) $ (1.66) $ (1.04) $ (2.11) $ (0.43)
Cash flows
Cash provided by operating activities $ 120,324 $ 105,262 $ 116,791 $ 136,148 $ 124,963
Cash (used in) provided by investing activities $ (88,178) $ (21,772) $ 81,029 $ (103,405) $ (353,239)
Cash (used in) provided by financing activities $ (19,954) $ (104,019) $ (229,736) $ 31,714 $210,137
Cash distributions
Cash distributions per share – common shares $ 0.63 $ 0.60 $ 0.60 $ 0.74 $ 2.28
Cash distributions per share – Series A Preferred shares $ 1.3464 $ — $ — $ — $ —
Cash distributions per share – Series B Preferred shares $ 0.3278 $ — $ — $ — $ —
Funds From Operations(1)
Net loss $ (42,550) $ (93,935) $ (54,363) $ (90,091) $ (16,355)
Dividends on preferred shares (7,984) — — — —
Gains on sales of interests in real estate — (740) — (923) —
Gains on sales of discontinued operations (947) — (19,094) (9,503) —
Impairment of assets 3,805 52,336 — 74,254 —
Depreciation and amortization of real estate assets:
Wholly owned and consolidated partnerships, net 128,634 128,795 149,968 148,430 133,171
Unconsolidated partnerships 7,396 8,403 8,656 8,144 8,361
Discontinued operations 7,263 10,726 14,047 17,030 15,835
Funds from operations $ 95,617 $ 105,585 $ 99,214 $ 147,341 $ 141,012
Weighted average number of shares outstanding 55,122 54,639 50,642 40,953 38,807
Weighted average effect of full conversion OP Units 2,310 2,329 2,329 2,268 2,236
Effect of common share equivalents 1,131 502 502 12 14
Total weighted average shares outstanding including OP Units 58,563 57,470 53,473 43,233 41,057
Funds from operations per diluted share and OP Unit $ 1.63 $ 1.84 $ 1.86 $ 3.41 $ 3.43
(in thousands) As of December 31,
Balance sheet items 2012 2011 2010 2009 2008
Investments in real estate, at cost $ 3,477,540 $3,576,997 $ 3,587,468 $ 3,684,313 $3,708,048
Total Assets $ 2,877,624 $2,910,254 $ 3,080,117 $3,346,580 $3,444,277
Long term debt
Consolidated properties:
Mortgage loans payable, including debt premium $ 1,718,052 $1,691,381 $ 1,744,248 $1,777,121 $1,760,296
Revolving Facilities $ — $ 95,000 $ — $ 486,000 $ 400,000
Exchangeable Notes, net of debt discount $ — $ 136,051 $ 134,091 $ 132,236 $ 230,079
Term Loans $ 182,000 $ 240,000 $ 347,200 $ 170,000 $ 170,000
Company’s share of partnerships:
Mortgage loans payable $ 201,717 $ 204,546 $ 175,693 $ 181,776 $ 184,064
(1)
The National Association of Real Estate Investment Trusts (“NAREIT”) defines Funds From Operations (“FFO”), which is a non-GAAP measure commonly used by REITs, as net income
excluding gains and losses on sales of operating properties, extraordinary items (computed in accordance with GAAP) and significant non-recurring events that materially distort the comparative
measurement of company performance over time; plus real estate depreciation and amortization; and after adjustments for unconsolidated partnerships and joint ventures to reflect funds from
operations on the same basis. We compute FFO in accordance with standards established by NAREIT, which may not be comparable to FFO reported by other REITs that do not define the term
in accordance with the current NAREIT definition, or that interpret the current NAREIT definition differently than we do. NAREIT’s established guidance provides that excluding impairment
write downs of depreciable real estate is consistent with the NAREIT definition. For additional information about FFO, please refer to page 51.
14 SELECTED FINANCIAL INFORMATIONCONSOLIDATED BALANCE SHEETS
December 31, December 31,
(in thousands, except per share amounts) 2012 2011
Assets:
Investments in Real Estate, at cost:
Operating properties $ 3,395,681 $ 3,470,167
Construction in progress 68,619 91,538
Land held for development 13,240 15,292
Total investments in real estate 3,477,540 3,576,997
Accumulated depreciation (907,928) (844,010)
Net investments in real estate 2,569,612 2,732,987
Investments in Partnerships, at equity: 14,855 16,009
Other Assets:
Cash and cash equivalents 33,990 21,798
Tenant and other receivables (net of allowance for doubtful accounts of $14,042 and $17,930
at December 31, 2012 and 2011, respectively) 38,473 39,832
Intangible assets (net of accumulated amortization of $14,940 and $51,625
at December 31, 2012 and 2011, respectively) 8,673 9,921
Deferred costs and other assets 97,399 89,707
Assets held for sale 114,622 —
Total assets $ 2,877,624 $ 2,910,254
Liabilities:
Mortgage loans payable (including debt premium of $282 at December 31, 2011) $ 1,718,052 $ 1,691,381
Exchangeable Notes (net of debt discount of $849 at December 31, 2011) — 136,051
Term Loans 182,000 240,000
Revolving Facility — 95,000
Tenants’ deposits and deferred rent 14,862 13,278
Distributions in excess of partnership investments 64,874 64,938
Fair value of derivative instruments 9,742 21,112
Liabilities on assets held for sale 102,417 —
Accrued expenses and other liabilities 72,448 60,456
Total liabilities $ 2,164,395 $ 2,322,216
Commitments and Contingencies (Note 11)
Equity:
Series A Preferred Shares, $.01 par value per share; 25,000 shares authorized; 4,600 shares issued
and outstanding at December 31, 2012 and 0 shares issued and outstanding at December 31, 2011;
liquidation preference of $115,000 $ 46 $ —
Series B Preferred Shares, $.01 par value per share; 25,000 shares authorized; 3,450 shares issued
and outstanding at December 31, 2012 and 0 shares issued and outstanding at December 31, 2011;
liquidation preference of $86,250 35 —
Shares of beneficial interest, $1.00 par value per share; 200,000 shares authorized; issued and
outstanding 56,331 shares at December 31, 2012 and 55,677 shares at December 31, 2011 56,331 55,677
Capital contributed in excess of par 1,247,730 1,047,487
Accumulated other comprehensive loss (20,867) (34,099)
Distributions in excess of net income (608,634) (524,738)
Total equity – Pennsylvania Real Estate Investment Trust 674,641 544,327
Noncontrolling interest 38,588 43,711
Total equity 713,229 588,038
Total liabilities and equity $ 2,877,624 $ 2,910,254
See accompanying notes to consolidated financial statements.
PENNSYLVANIA REAL ESTATE INVESTMENT TRUST 2012 ANNUAL REPORT 15CONSOLIDATED STATEMENTS OF OPERATIONS
For the Year Ended December 31,
(in thousands of dollars) 2012 2011 2010
Revenue:
Real estate revenue:
Base rent $ 276,524 $ 271,314 $ 270,831
Expense reimbursements 121,108 125,250 125,946
Percentage rent 5,714 6,368 5,537
Lease termination revenue 1,760 1,091 2,986
Other real estate revenue 16,542 16,268 15,481
Total real estate revenue 421,648 420,291 420,781
Other income 5,534 6,712 5,276
Total revenue 427,182 427,003 426,057
Expenses:
Operating expenses:
CAM and real estate taxes (135,049) (133,850) (132,123)
Utilities (22,198) (24,265) (25,835)
Other (20,677) (22,611) (24,572)
Total operating expenses (177,924) (180,726) (182,530)
Depreciation and amortization (129,459) (129,704) (151,452)
Other expenses:
General and administrative expenses (37,538) (38,901) (38,973)
Provision for employee separation expense (9,437) — —
Impairment of assets — (24,359) —
Project costs and other expenses (1,936) (964) (1,137)
Total other expenses (48,911) (64,224) (40,110)
Interest expense, net (122,118) (127,148) (136,412)
Total expenses (478,412) (501,802) (510,504)
Loss before equity in income of partnerships, gains on sales of real estate
and discontinued operations (51,230) (74,799) (84,447)
Equity in income of partnerships 8,338 6,635 9,050
Gains on sales of real estate — 1,590 —
Loss from continuing operations (42,892) (66,574) (75,397)
Discontinued operations:
Operating results from discontinued operations 3,200 616 1,940
Impairment of assets of discontinued operations (3,805) (27,977) —
Gains on sales of discontinued operations 947 — 19,094
Income (loss) from discontinued operations 342 (27,361) 21,034
Net loss (42,550) (93,935) (54,363)
Less: net loss attributed to noncontrolling interest 1,713 3,774 2,436
Net loss attributable to PREIT (40,837) (90,161) (51,927)
Less: preferred share dividends (7,984) — —
Net loss attributable to PREIT common shareholders $ (48,821) $ (90,161) $ (51,927)
See accompanying notes to consolidated financial statements.
16 CONSOLIDATED FINANCIAL STATEMENTSCONSOLIDATED STATEMENTS OF OPERATIONS (CONTINUED)
EARNINGS PER SHARE
For the Year Ended December 31,
(in thousands of dollars, except per share amounts) 2012 2011 2010
Loss from continuing operations $ (42,892) $ (66,574) $ (75,397)
Preferred dividends (7,984) — —
Noncontrolling interest in continuing operations 1,726 2,674 3,240
Dividends on restricted shares (441) (547) (615)
Loss from continuing operations used to calculate earnings per share – basic and diluted $ (49,591) $ (64,447) $ (72,772)
Income (loss) from discontinued operations $ 342 $ (27,361) $ 21,034
Noncontrolling interest in discontinued operations (13) 1,100 (804)
Income (loss) from discontinued operations used to calculate earnings per share – basic and diluted $ 329 $ (26,261) $ 20,230
Basic and diluted earnings (loss) per share:
Loss from continuing operations $ (0.90) $ (1.18) $ (1.44)
Income (loss) from discontinued operations 0.01 (0.48) 0.40
$ (0.89) $ (1.66) $ (1.04)
(in thousands of shares)
Weighted average shares outstanding – basic 55,122 54,639 50,642
Effect of dilutive common share equivalents(1) — — —
Weighted average shares outstanding – diluted 55,122 54,639 50,642
(1)
For the years ended December 31, 2012, 2011 and 2010, there are net losses allocable to common shareholders from continuing operations, so the effect of common share equivalents
of 1,131, 502 and 502 for the years ended December 31, 2012, 2011 and 2010, respectively, is excluded from the calculation of diluted loss per share, as their inclusion would be
anti-dilutive.
See accompanying notes to consolidated financial statements.
CONSOLIDATED STATEMENTS OF COMPREHENSIVE INCOME
For the Year Ended December 31,
(in thousands of dollars) 2012 2011 2010
Comprehensive (loss) income:
Net loss $ (42,550) $ (93,935) $ (54,363)
Unrealized gain (loss) on derivatives 11,370 6,118 (12,343)
Other 2,419 24 1,951
Total comprehensive loss (28,761) (87,793) (64,755)
Less: Comprehensive loss attributable to noncontrolling interest 1,156 3,526 2,851
Comprehensive loss attributable to Pennsylvania Real Estate Investment Trust $ (27,605) $ (84,267) $ (61,904)
See accompanying notes to consolidated financial statements.
PENNSYLVANIA REAL ESTATE INVESTMENT TRUST 2012 ANNUAL REPORT 17CONSOLIDATED STATEMENTS OF EQUITY
FOR THE YEARS ENDED DECEMBER 31, 2012, 2011 & 2010
PREIT Shareholders
Series A Series B
Preferred Preferred
Shares, $25 Shares, $25
plus accrued plus accrued Shares of Capital Accumulated
dividends dividends Beneficial Contributed Other Distributions Non-
(in thousands of dollars, Liquidation Liquidation Interest, in Excess Comprehensive in Excess of controlling
except per share amounts) Total Equity Value Value $1.00 Par of Par Loss Net Income Interest
Balance January 1, 2010 $ 634,804 — — $ 44,616 $ 881,735 $ (30,016) $ (317,682) $ 56,151
Total comprehensive loss (64,755) — — — — (9,977) (51,927) (2,851)
Shares issued under 2010 public offering,
net of expenses 160,589 — — 10,350 150,239 — — —
Shares issued under employee and trustee
compensation plans, net of shares retired 489 — — 470 19 — — —
Amortization of deferred compensation 8,030 — — — 8,030 — — —
Distributions paid to common shareholders
($0.60 per share) (31,584) — — — — — (31,584) —
Noncontrolling interests:
Distributions paid to Operating Partnership
unit holders ($0.60 per unit) (1,365) — — — — — — (1,365)
Amortization of historic tax credit (1,697) — — — — — — (1,697)
Contributions from noncontrolling interest, net 19 — — — — — — 19
Balance December 31, 2010 704,530 — — 55,436 1,040,023 (39,993) (401,193) 50,257
Total comprehensive loss (87,793) — — — — 5,894 (90,161) (3,526)
Shares issued under employee and trustee
compensation plans, net of shares retired (1,350) — — 241 (1,591) — — —
Amortization of deferred compensation 9,055 — — — 9,055 — — —
Distributions paid to common shareholders
($0.60 per share) (33,384) — — — — — (33,384) —
Noncontrolling interests:
Distributions paid to Operating Partnership
unit holders ($0.60 per unit) (1,395) — — — — — — (1,395)
Amortization of historic tax credit (1,921) — — — — — — (1,921)
Contributions from noncontrolling interest, net 296 — — — — — — 296
Balance December 31, 2011 588,038 — — 55,677 1,047,487 (34,099) (524,738) 43,711
Total comprehensive loss (28,761) — — — — 13,232 (40,837) (1,156)
Shares issued upon redemption of
Operating Partnership units — — — 28 413 — — (441)
Shares issued under employee and trustee
compensation plans, net of shares retired (4,722) — — 626 (5,348) — — —
Amortization of deferred compensation 11,028 — — — 11,028 — — —
Series A Preferred share offering 110,896 46 — — 110,850 — — —
Series B Preferred share offering 83,335 — 35 — 83,300 — — —
Distributions paid to common shareholders
($0.63 per share) (35,735) — — — — — (35,735) —
Distributions paid to Series A preferred
shareholders ($1.3464 per share) (6,193) — — — — — (6,193) —
Distributions paid to Series B preferred
shareholders ($.3278 per share) (1,131) — — — — — (1,131) —
Noncontrolling interests:
Distributions paid to Operating Partnership
unit holders ($0.63 per unit) (1,459) — — — — — — (1,459)
Amortization of historic tax credit (1,810) — — — — — — (1,810)
Other distributions to noncontrolling interests, net (257) — — — — — — (257)
Balance December 31, 2012 $ 713,229 $ 46 $ 35 $ 56,331 $1,247,730 $ (20,867) $ (608,634) $ 38,588
See accompanying notes to consolidated financial statements.
18 CONSOLIDATED FINANCIAL STATEMENTSCONSOLIDATED STATEMENTS OF CASH FLOWS
For the Year Ended December 31,
(in thousands of dollars) 2012 2011 2010
Cash flows from operating activities:
Net loss $ (42,550) $ (93,935) $ (54,363)
Adjustments to reconcile net loss to net cash provided by operating activities:
Depreciation 128,204 128,378 137,210
Amortization 15,951 19,941 40,253
Straight-line rent adjustments (2,234) (331) (1,466)
Provision for doubtful accounts 1,861 3,320 5,337
Amortization of deferred compensation 11,028 9,055 8,030
Gain on sales of real estate and discontinued operations (947) (1,590) (19,094)
Amortization of historic tax credit (1,810) (1,921) (1,697)
Impairment of assets and expensed project costs 5,057 52,909 1,056
Change in assets and liabilities:
Net change in other assets (15,167) (7,143) (1,290)
Net change in other liabilities 20,931 (3,421) 2,815
Net cash provided by operating activities 120,324 105,262 116,791
Cash flows from investing activities:
Additions to construction in progress (38,104) (25,426) (23,448)
Investments in real estate improvements (43,543) (36,017) (32,226)
Additions to leasehold improvements (881) (364) (290)
Investments in partnerships (3,682) (252) (9,070)
Capitalized leasing costs (5,336) (4,999) (4,459)
Cash proceeds from sales of real estate investments — 7,551 134,669
(Increase) decrease in cash escrows (1,404) 2,210 (967)
Repayment of tenant note receivable — — 10,000
Cash distributions from partnerships in excess of equity in income 4,772 35,525 6,820
Net cash (used in) provided by investing activities (88,178) (21,772) 81,029
Cash flows from financing activities:
Net proceeds from issuance of Series A preferred shares 110,896 — —
Net proceeds from issuance of Series B preferred shares 83,335 — —
Repayment of Exchangeable Notes (136,900) — —
Net proceeds from 2010 Term Loan and Revolving Facility — — 590,000
Shares of beneficial interest issued 1,788 533 162,113
Net repayment of 2003 Credit Facility — — (486,000)
Repayment of senior unsecured 2008 Term Loan — — (170,000)
Repayment of 2010 Term Loan (58,000) (7,200) (172,800)
Net repayment of Revolving Facility (95,000) (5,000) (70,000)
Proceeds from mortgage loans 467,750 27,700 64,500
Repayment of mortgage loans (320,731) (58,032) (75,450)
Principal installments on mortgage loans (20,311) (21,249) (20,748)
Payment of deferred financing costs (1,753) (4,109) (17,367)
Dividends paid to common shareholders (35,735) (33,384) (31,584)
Dividends paid to preferred shareholders (7,324) — —
Distributions paid to Operating Partnership unit holders and noncontrolling interest (1,459) (1,395) (1,365)
Shares issued under equity incentive plans, net of shares retired (6,510) (1,883) (1,035)
Net cash used in financing activities (19,954) (104,019) (229,736)
Net change in cash and cash equivalents 12,192 (20,529) (31,916)
Cash and cash equivalents, beginning of year 21,798 42,327 74,243
Cash and cash equivalents, end of year $ 33,990 $ 21,798 $ 42,327
See accompanying notes to consolidated financial statements.
PENNSYLVANIA REAL ESTATE INVESTMENT TRUST 2012 ANNUAL REPORT 19NOTES TO CONSOLIDATED FINANCIAL STATEMENTS
For the Years Ended December 31, 2012, 2011 & 2010
1. Organization and Summary of Significant Accounting Policies with regard to the nature of our properties and the nature of our tenants
and operational processes, as well as long-term financial performance.
NATURE OF OPERATIONS Pennsylvania Real Estate Investment Trust In addition, no single tenant accounts for 10% or more of consolidated
(“PREIT”), a Pennsylvania business trust founded in 1960 and one of the revenue, and none of our properties are located outside the United States.
first equity real estate investment trusts (“REITs”) in the United States,
has a primary investment focus on retail shopping malls located in the CONSOLIDATION We consolidate our accounts and the accounts of the
eastern half of the United States, primarily in the Mid-Atlantic region. As Operating Partnership and other controlled subsidiaries, and we reflect
of December 31, 2012, our portfolio consisted of a total of 49 properties the remaining interest in such entities as noncontrolling interest. All sig-
in 13 states, including 38 shopping malls, eight strip and power centers nificant intercompany accounts and transactions have been eliminated in
and three development properties, with two of the development properties consolidation.
classified as “mixed use” (a combination of retail and other uses), and
Certain prior period amounts have been reclassified to conform with the
one of the development properties classified as “other.” In January and
current year presentation.
February 2013, we sold two of our mall properties and one of our power
centers, and we have entered into an agreement to sell one additional PARTNERSHIP INVESTMENTS We account for our investments in part-
power center in 2013. As a result, as of December 31, 2012, we classified nerships that we do not control using the equity method of accounting.
these four properties as held for sale and have recorded the results of These investments, each of which represents a 40% to 50% noncon-
these properties as “discontinued operations.” trolling ownership interest at December 31, 2012, are recorded initially at
our cost and subsequently adjusted for our share of net equity in income
We hold our interest in our portfolio of properties through our operating
and cash contributions and distributions. We do not control any of these
partnership, PREIT Associates, L.P. (“PREIT Associates” or the “Operating
equity method investees for the following reasons:
Partnership”). We are the sole general partner of the Operating Partnership
and, as of December 31, 2012, held a 96.1% controlling interest in the Q
Except for two properties that we co-manage with our partner, the other
Operating Partnership, and consolidated it for reporting purposes. The entities are managed on a day-to-day basis by one of our other partners
presentation of consolidated financial statements does not itself imply that as the managing general partner in each of the respective partnerships.
the assets of any consolidated entity (including any special-purpose entity In the case of the co-managed properties, all decisions in the ordinary
formed for a particular project) are available to pay the liabilities of any course of business are made jointly.
other consolidated entity, or that the liabilities of any consolidated entity Q
The managing general partner is responsible for establishing the oper-
(including any special-purpose entity formed for a particular project) are
ating and capital decisions of the partnership, including budgets, in the
obligations of any other consolidated entity.
ordinary course of business.
Pursuant to the terms of the partnership agreement of the Operating Q
All major decisions of each partnership, such as the sale, refinancing,
Partnership, each of the limited partners has the right to redeem such
expansion or rehabilitation of the property, require the approval of all
partner’s units of limited partnership interest in the Operating Partnership
partners.
(“OP Units”) for cash or, at our election, we may acquire such OP Units in
exchange for our common shares on a one-for-one basis, in some cases Q
Voting rights and the sharing of profits and losses are in proportion to the
beginning one year following the respective issue date of the OP Units ownership percentages of each partner.
and in other cases immediately. If all of the outstanding OP Units held by
STATEMENTS OF CASH FLOWS We consider all highly liquid short-term
limited partners had been redeemed for cash as of December 31, 2012,
investments with an original maturity of three months or less to be cash
the total amount that would have been distributed would have been $40.6
equivalents. At December 31, 2012 and 2011, cash and cash equiva-
million, which is calculated using our December 31, 2012 closing share
lents totaled $34.0 million and $21.8 million, respectively, and included
price on the New York Stock Exchange of $17.64 multiplied by the number
tenant security deposits of $4.2 million and $4.3 million, respectively.
of outstanding OP Units held by limited partners, which was 2,300,932 as
Cash paid for interest, including interest related to discontinued opera-
of December 31, 2012.
tions, was $112.5 million, $124.1 million and $131.5 million for the years
We provide management, leasing and real estate development services ended December 31, 2012, 2011 and 2010, respectively, net of amounts
through two of our subsidiaries: PREIT Services, LLC (“PREIT Services”), capitalized of $1.5 million, $2.0 million and $2.6 million, respectively.
which generally develops and manages properties that we consolidate for
SIGNIFICANT NON-CASH TRANSACTIONS In December 2012, we sold
financial reporting purposes, and PREIT-Rubin, Inc. (“PRI”), which gen-
our remaining interest in Northeast Tower Center in exchange for the can-
erally develops and manages properties that we do not consolidate for
cellation of a $3.8 million note payable to the buyer. We recorded a gain of
financial reporting purposes, including properties owned by partnerships
$0.9 million from this sale in 2012.
in which we own an interest and properties that are owned by third par-
ties in which we do not have an interest. PREIT Services and PRI are In connection with the June 2011 amendment to the 2010 Credit Facility,
consolidated. PRI is a taxable REIT subsidiary, as defined by federal tax we reduced the amount outstanding under the 2010 Term Loan by $100.0
laws, which means that it is able to offer an expanded menu of services to million and increased the amount outstanding under the 2010 Revolving
tenants without jeopardizing our continuing qualification as a REIT under Facility by $100.0 million.
federal tax law.
Accrued construction costs decreased $0.3 million, $0.1 million and $5.6
We evaluate operating results and allocate resources on a million in the years ended December 31, 2012, 2011 and 2010, respec-
property-by-property basis, and do not distinguish or evaluate consoli- tively, representing non-cash decreases in construction in progress.
dated operations on a geographic basis. We do not have any significant
revenue or asset concentrations, and thus the individual properties have ACCOUNTING POLICIES USE OF ESTIMATES The preparation of
been aggregated into one reportable segment based upon their similarities financial statements in conformity with accounting principles generally
20 NOTES TO CONSOLIDATED FINANCIAL STATEMENTSaccepted in the United States of America requires our management to gered. The effect of cotenancy clauses is applied on a prospective basis to
make estimates and assumptions that affect the reported amounts of recognize the new rent that is in effect.
assets and liabilities and disclosure of contingent assets and liabilities at
Payments made to tenants as inducements to enter into a lease are treated
the date of the financial statements, and the reported amounts of rev-
as deferred costs that are amortized as a reduction of rental revenue over
enue and expense during the reporting periods. Actual results could differ
the term of the related lease.
from those estimates. We believe that our most significant and subjective
accounting estimates and assumptions are those relating to fair value, The effect of lease modifications that result in rent relief or other credits to
asset impairment and account receivable reserves. tenants, including any retroactive effects relating to prior periods, is recog-
nized in the period when the lease modification is signed.
Our management makes complex or subjective assumptions and judg-
ments in applying its critical accounting policies. In making these Lease termination fee revenue is recognized in the period when a termi-
judgments and assumptions, our management considers, among other nation agreement is signed, collectibility is assured and we are no longer
factors, events and changes in property, market and economic conditions, obligated to provide space to the tenant. In the event that a tenant is in
estimated future cash flows from property operations, and the risk of loss bankruptcy when the termination agreement is signed, termination fee
on specific accounts or amounts. income is deferred and recognized when it is received.
REVENUE RECOGNITION We derive over 95% of our revenue from We also generate revenue by providing management services to third
tenant rent and other tenant-related activities. Tenant rent includes base parties, including property management, brokerage, leasing and develop-
rent, percentage rent, expense reimbursements (such as reimbursements ment. Management fees generally are a percentage of managed property
of costs of common area maintenance (“CAM”), real estate taxes and revenue or cash receipts. Leasing fees are earned upon the consumma-
utilities), amortization of above-market and below-market intangibles (as tion of new leases. Development fees are earned over the time period of
described below under “Intangible Assets”) and straight-line rent. We the development activity and are recognized on the percentage of comple-
record base rent on a straight-line basis, which means that the monthly tion method. These activities are collectively included in “Other income” in
base rent revenue according to the terms of our leases with our tenants is the consolidated statements of operations.
adjusted so that an average monthly rent is recorded for each tenant over
the term of its lease. When tenants vacate prior to the end of their lease, FAIR VALUE Fair value accounting applies to reported balances that
we accelerate amortization of any related unamortized straight-line rent are required or permitted to be measured at fair value under existing
balances, and unamortized above-market and below-market intangible accounting pronouncements.
balances are amortized as a decrease or increase to real estate revenue, Fair value measurements are determined based on the assumptions that
respectively. The straight-line rent adjustment increased revenue by $2.2 market participants would use in pricing the asset or liability. As a basis for
million, $0.3 million and $1.5 million in the years ended December 31, considering market participant assumptions in fair value measurements,
2012, 2011 and 2010, respectively. The straight-line rent receivable bal- these accounting requirements establish a fair value hierarchy that distin-
ances included in tenant and other receivables on the accompanying guishes between market participant assumptions based on market data
balance sheet as of December 31, 2012 and 2011 were $27.7 million and obtained from sources independent of the reporting entity (observable
$25.5 million, respectively. inputs that are classified within Levels 1 and 2 of the hierarchy) and the
Percentage rent represents rental income that the tenant pays based on reporting entity’s own assumptions about market participant assumptions
a percentage of its sales, either as a percentage of its total sales or as a (unobservable inputs classified within Level 3 of the hierarchy).
percentage of sales over a certain threshold. In the latter case, we do not Level 1 inputs utilize quoted prices (unadjusted) in active markets for iden-
record percentage rent until the sales threshold has been reached. tical assets or liabilities that we have the ability to access.
Revenue for rent received from tenants prior to their due dates is deferred Level 2 inputs are inputs other than quoted prices included in Level 1 that
until the period to which the rent applies. are observable for the asset or liability, either directly or indirectly. Level
In addition to base rent, certain lease agreements contain provisions that 2 inputs might include quoted prices for similar assets and liabilities in
require tenants to reimburse a fixed or pro rata share of certain CAM costs, active markets, as well as inputs that are observable for the asset or liability
real estate taxes and utilities. Tenants generally make expense reimburse- (other than quoted prices), such as interest rates, foreign exchange rates,
ment payments monthly based on a budgeted amount determined at the and yield curves that are observable at commonly quoted intervals.
beginning of the year. During the year, our income increases or decreases Level 3 inputs are unobservable inputs for the asset or liability, and are
based on actual expense levels and changes in other factors that influence typically based on an entity’s own assumptions, as there is little, if any,
the reimbursement amounts, such as occupancy levels. As of December related market activity.
31, 2012 and 2011, our accounts receivable included accrued income of
$4.0 million and $2.4 million, respectively, because actual reimbursable In instances where the determination of the fair value measurement is
expense amounts eligible to be billed to tenants under applicable con- based on inputs from different levels of the fair value hierarchy, the level in
tracts exceeded amounts actually billed. the fair value hierarchy within which the entire fair value measurement falls
is based on the lowest level input that is significant to the fair value mea-
Certain lease agreements contain cotenancy clauses that can change the surement in its entirety. Our assessment of the significance of a particular
amount of rent or the type of rent that tenants are required to pay, or, in input to the fair value measurement in its entirety requires judgment, and
some cases, can allow a tenant to terminate their lease, in the event that considers factors specific to the asset or liability. We utilize the fair value
certain events take place, such as a decline in property occupancy levels hierarchy in our accounting for derivatives (Level 2) and financial instru-
below certain defined levels or the vacating of an anchor store. Cotenancy ments (Level 2) and in our reviews for impairment of real estate assets
clauses do not generally have any retroactive effect when they are trig- (Level 3) and goodwill (Level 3).
PENNSYLVANIA REAL ESTATE INVESTMENT TRUST 2012 ANNUAL REPORT 21FINANCIAL INSTRUMENTS Carrying amounts reported on the balance considered recoverable based on evaluation of the severity and duration of
sheet for cash and cash equivalents, tenant and other receivables, accrued the decline in value. To the extent impairment has occurred, the excess
expenses, other liabilities and the 2010 Term Loan and Revolving Facility carrying value of the asset over its estimated fair value is recorded as a
approximate fair value due to the short-term nature of these instruments. All reduction to income.
of our variable rate debt is subject to interest rate swaps that have effectively
We conduct an annual review of our goodwill balances for impairment
fixed the interest rates on the underlying debt. The estimated fair value for
to determine whether an adjustment to the carrying value of goodwill
fixed rate debt, which is calculated for disclosure purposes, is based on
is required. We have determined the fair value of our properties and the
the borrowing rates available to us for fixed rate mortgage loans with similar
amount of goodwill that is associated with certain of our properties, and we
terms and maturities.
have concluded that goodwill was not impaired as of December 31, 2012.
IMPAIRMENT OF ASSETS Real estate investments and related intangible Fair value is determined by applying a capitalization rate to our estimate
assets are reviewed for impairment whenever events or changes in circum- of projected income at those properties. We also consider factors such as
stances indicate that the carrying amount of the property might not be property sales performance, market position and current and future oper-
recoverable, which is referred to as a “triggering event.” In connection with ating results. This amount is compared to the aggregate of the property basis
our review of our long-lived assets for impairment, we utilize qualitative and and the goodwill that has been assigned to that property. If the fair value is
quantitative factors in order to estimate fair value. The significant qualitative less than the property basis and the goodwill, we evaluate whether impair-
factors that we use include age and condition of the property, market con- ment has occurred.
ditions in the property’s trade area, competition with other shopping centers
REAL ESTATE Land, buildings, fixtures and tenant improvements are
within the property’s trade area and the creditworthiness and performance
recorded at cost and stated at cost less accumulated depreciation.
of the property’s tenants. The significant quantitative factors that we use
Expenditures for maintenance and repairs are charged to operations as
include historical and forecasted financial and operating information relating
incurred. Renovations or replacements, which improve or extend the life of
to the property, such as net operating income, occupancy statistics, vacancy
an asset, are capitalized and depreciated over their estimated useful lives.
projections and tenants’ sales levels. Our fair value assumptions relating to
real estate assets are within Level 3 of the fair value hierarchy. For financial reporting purposes, properties are depreciated using the
straight-line method over the estimated useful lives of the assets. The esti-
If there is a triggering event in relation to a property to be held and used, we
mated useful lives are as follows:
will estimate the aggregate future cash flows, less estimated capital expen-
ditures, to be generated by the property, undiscounted and without interest Buildings 20-40 years
charges. In addition, this estimate may consider a probability weighted cash Land improvements 15 years
flow estimation approach when alternative courses of action to recover the Furniture/fixtures 3-10 years
carrying amount of a long-lived asset are under consideration or when a Tenant improvements Lease term
range of possible values is estimated.
The determination of undiscounted cash flows requires significant estimates We are required to make subjective assessments as to the useful lives of our
by our management, including the expected course of action at the bal- real estate assets for purposes of determining the amount of depreciation
ance sheet date that would lead to such cash flows. Subsequent changes in to reflect on an annual basis with respect to those assets based on various
estimated undiscounted cash flows arising from changes in the anticipated factors, including industry standards, historical experience and the condition
action to be taken with respect to the property could affect the determination of the asset at the time of acquisition. These assessments affect our net
of whether an impairment exists and whether the effects of such changes income. If we were to determine that a different estimated useful life was
could materially affect our net income. If the estimated undiscounted cash appropriate for a particular asset, it would be depreciated over the newly
flows are less than the carrying value of the property, it is written down to estimated useful life, and, other things being equal, result in changes in
its fair value. annual depreciation expense and annual net income.
In determining the estimated undiscounted cash flows of the properties Gains from sales of real estate properties and interests in partnerships gen-
that are being analyzed for impairment of assets, we take the sum of the erally are recognized using the full accrual method, provided that various
estimated undiscounted cash flows, assuming a holding period of ten criteria are met relating to the terms of sale and any subsequent involvement
years, plus a terminal value calculated using the estimated net operating by us with the properties sold.
income in the eleventh year and terminal capitalization rates, which in 2012 REAL ESTATE ACQUISITIONS We account for our property acquisitions by
ranged from 6.25% to 12.0%. In 2012, one property had a triggering event allocating the purchase price of a property to the property’s assets based
that required further review for impairment. The fair value of the property on management’s estimates of their fair value. Debt assumed in connection
(Phillipsburg Mall) was determined based on the sale price of the property with property acquisitions is recorded at fair value at the acquisition date,
as further discussed in note 2. In 2011, after two properties had triggering and the resulting premium or discount is amortized through interest expense
events that required further review for impairment, we estimated the fair over the remaining term of the debt, resulting in a non-cash decrease (in
value of the properties that experienced impairment of assets using discount the case of a premium) or increase (in the case of a discount) in interest
rates applied to estimated cash flows ranging from 13% to 14%. expense. The determination of the fair value of intangible assets requires
Assessment of our ability to recover certain lease related costs must be significant estimates by management and considers many factors, including
made when we have a reason to believe that a tenant might not be able to our expectations about the underlying property, the general market condi-
perform under the terms of the lease as originally expected. This requires us tions in which the property operates and conditions in the economy. The
to make estimates as to the recoverability of such costs. judgment and subjectivity inherent in such assumptions can have a signifi-
cant effect on the magnitude of the intangible assets or the changes to such
An other than temporary impairment of an investment in an unconsolidated assets that we record.
joint venture is recognized when the carrying value of the investment is not
22 NOTES TO CONSOLIDATED FINANCIAL STATEMENTSYou can also read