Thornbury High Street changes consultation output report - Corporate Research & Consultation Team South Gloucestershire Council
←
→
Page content transcription
If your browser does not render page correctly, please read the page content below
Thornbury High Street
changes consultation
output report

Corporate Research & Consultation Team
South Gloucestershire Council
May 2021

Thornbury High Street Consultation Output Report V2   1
Contents
1.0 Key findings ...................................................................................................................... 3
2.0 Consultation purpose, methodology and response........................................................... 7
3.0 Survey analysis .............................................................................................................. 10
   3.1 Respondent profile ...................................................................................................... 10
   3.2 Travel .......................................................................................................................... 13
   3.3 Use of the High Street (Prior to Covid-19) .................................................................. 19
   3.4 Views on the changes ................................................................................................. 23
   3.5 Views on pedestrianisation ......................................................................................... 31
   3.6 Future Vision ............................................................................................................... 39
4.0 Focus group findings ...................................................................................................... 49
   4.1 High Street Catalyst Project ........................................................................................ 49
5.0 Other representations ..................................................................................................... 76
   5.1 Emails and Letters ...................................................................................................... 76
   5.2 Full comments............................................................................................................. 90
   5.3 Consultation events and meetings .............................................................................. 90
Appendix – Copy of consultation survey ............................................................................... 91

Thornbury High Street Consultation Output Report V2                                                                                      2
1.0 Key findings
Respondent profile

   •   2,890 responses were received to the consultation survey, with 2,147 (74%) stating
       they were residents of Thornbury, and 639 from the wider South
       Gloucestershire/Bristol area.

   •   5% of respondents were from a Black, Asian and Minority Ethnic group or white non-
       British other ethnic group.

   •   318 people stated they had a disability, representing 12% of the survey population. Of
       these, 170 (53%) stated they had a physical impairment with 141 (44%) having a
       longstanding illness or health condition.

Travelling to Thornbury High Street before Covid-19

   •   Car was the most popular form of transport with 83% of respondents using a car
       whilst 64% also stated they walk.

   •   Buses were used by 9% respondents with bus usage highest amongst younger
       people, disabled people and those from a BAME background. Whilst 61% of
       respondents said they wouldn’t not uses buses more (largely because they were local
       to the High Street), 19% of car drivers said they would use the buses more if there
       were better facilities.

   •   84% of those with a disability travelled by car to Thornbury, increasing to 96% for
       those with a physical impairment.

   •   Walking to the High Street was popular with a large percentage of respondents
       (alongside other forms of transport). 44% of those with a disability also stated they
       walk to the High Street.

   •   The free short and long stay car parks are well used with 95% of car users using the
       free short stay car at least 1 to 3 times a month with 71% using it at least once a
       week.

   •   118 car users with a stated disability (51%) used the blue badge parking on the High
       Street double yellow lines at least once a week,

   •   Accessing the High Street and the ability to park closer to shops was the biggest
       concern for those with a disability, with 25% of those with a disability not having
       visited the High Street since the closure of 8 June 2021.

Thornbury High Street Consultation Output Report V2                                            3
Use of the High Street (Prior to Covid-19)
• Shopping was the main reason most respondents visited the High Street, with 8 out of
10 people visiting weekly for shopping and 97% of respondents shopped there at
least once a month.
• Older residents and those with a disability were most frequent users of the High Street
for shopping, though less popular with the younger age groups, including (25 to 34
year olds). 91% of over 75s used Thornbury High Street at least once a week for
shopping.
• Respondents with a disability were also more likely to use the High Street once a
week (84%) compared to those without a disability (79%).
• Younger people (16-24), people aged 55-64, disabled people and those from a BAME
background were more likely than average to access the High Street for paid work.
• 45% of local residents used a café or restaurant at least once a week with another
40% using 1 to 3 times a month. This was slightly more popular with women who
regular use the High Street to meet up with family and friends.
• Younger age groups were also the biggest users of fast-food, takeaways and pubs.
• Attending groups or classes was also particularly popular with women (34% of women
said they attend a group or exercise class at least once a month compared to 17% of
men) and also those with a disability (29%) whilst over a third of the over 75s (35%)
visited at least once a month to attend a group or class.
• Libraries were also well used with highest usage amongst females, older age groups,
and people from a Black, Asian and Minority Ethnic background with 40% saying they
use at least once a month compared to 27% of white respondents.
Views on the changes
• There was 80% agreement from respondents for a 20mph speed limit to be
introduced.
• There was less agreement for the implementation of a permanent pedestrian and
cycle zone with 29% agreeing. However, this did increase to 47% for those who had
visited at least once a week since the changes were implemented. Those with a
disability were least likely to agree (70% disagreed). Cyclists were most likely to agree
with the changes.
• Opinions were divided on parking and loading access with more frequent visitors
since the changes more positive (47% agree) compared to 29% overall. 31% agreed
with the current one-way system for vehicle loading and access (with agreement
lowest with car users).
Thornbury High Street Consultation Output Report V2 4• 59% thought that buses should be allowed through the one –way system.
Views on pedestrianisation
• There was a significant level of disagreement with the pedestrianisation as it stands,
but also a notable amount of support.
• There was a significant difference in opinion between respondents who had visited
the High Street more frequently compared to those who had visited less than once a
month or not at all since 8 June 2021.
• Since the closure, 1037 (38%) of respondents had visited at least once a week with
two-thirds visiting at least once a month. 85% of those visiting most regularly were
residents local to Thornbury with 93% of who walk, visiting once a week.
• Regular visitors to the High Street rated the easy of keeping social distancing, less air
pollution more highly than respondents who visited less regularly.
• Frequent visitors were generally more positive about the changes, and this increased
within the younger age brackets, particularly the 25 to 34 groups, cyclists and families.
• There was a general feeling that it was less convenient to access the shops with
disabled respondents most likely to give this a low score.
• 64% of respondents who visited at least once a week rated ‘less air pollution’ as ‘Very
Good’ or ‘Good’ with those in the 25 to 34 age group rating it most positively with
72%. In contrast, only 32% in the same age group who had visited less than once a
month rated this positively.
• Young people and people from BAME backgrounds were more likely to say that the
experiences of eating and drinking on the High Street has been more positive.
• People aged 25 to 34 were more likely to say the High Street was a more pleasant
place to be (65% of regular visitors giving a positive rating).
• Feeling safe is an important factor and some respondents felt that there was an
increase in anti-social behaviours since there was more eating and drinking on the
High Street. Some respondents also stated that cyclists riding at speed or without
consideration for pedestrians created a hazard when walking around in a
pedestrianised zone. Women, the over 65s and those with a disability were less likely
to feel safe compared to other groups using the High Street.
Future Vision
• Frequent visitors since 8 June 2021 were positive about what the changes could
bring, whilst people who had not visited were much more opposed to
pedestrianisation and would like to see the High Street returned to how it was before,
or with one-way traffic as a minimum.
Thornbury High Street Consultation Output Report V2 5• A significant element of this was being able to park close to shops – particularly for
those with a disability – and some people felt that the High Street was lacking in
vibrancy without traffic driving through. Others felt that there was a good amount of
parking with the free car parks and the benefits of the High Street being a
pedestrianised zone outweighed the benefits of traffic and parking congestion through
the High Street.
• Regular visitors to the High Street since the closure were more likely to have enjoyed
the pedestrianisation citing that it felt safer, was a more pleasant place to be and
presented an opportunity to develop the High Street into a fully accessible,
pedestrianised area – recognising that at the moment it is a road that is closed and
will need improvements to its infrastructure and layout.
• Respondents said that ‘quality paving’, ‘more bins’ and ‘benches’ along with ‘dropped
kerbs or ramps for crossing’ were most important in improving the features of the High
Street. Access to toilets was also mentioned in the comments.
• More choice of shops and better choice of non-essential shops were the factors that
respondents felt would benefit the High Street and encourage them to visit more
frequently.
Thornbury High Street Consultation Output Report V2 62.0 Consultation purpose, methodology and response Background and research objectives On the 9 May 2020 the Department for Transport issued statutory guidance of the reallocation of road space to encourage cycling and walking and enable social distancing. Measures needed to be taken quickly and South Gloucestershire Council put in place a Temporary Traffic Regulation Notice to close Thornbury High Street to traffic from Sunday 7 June. This was done using temporary traffic management (barriers, cones and signs) with support from a security company to ensure pedestrian safety. This immediately enabled pedestrians to use the road and footway to socially distance when walking and queuing. During this initial closure period, the Council listened to the views of residents and organisations on how the emergency changes were working and made changes based on this feedback. This included allowing delivery vehicles to enter through a three-metre gap in the soft closure using a one-way system to aid the shops in receiving their deliveries and access to properties. The pedestrian and cycle zone was extended further south, near the junction with Chapel Street to accommodate a wider footway and seating outside the Maltings Public House. The speed limit was reduced to 20mph to ensure the safety of pedestrians and cyclists. An Experimental Traffic Regulation Order (ETRO) was put in place and the Council started a six-month public consultation on whether these or other changes should be made permanent. The purpose of the consultation was to hear from all the different groups, including residents, businesses and people who work in Thornbury High Street to hear how these changes affect them and how they want the high street to work in the future. Methodology Process The consultation process was supported by a dedicated consultation webpage which hosted all consultation documents, an online survey and a paper survey to download. The online consultation system sent out a notification to registered users informing them of the consultation and providing links to this information: https://consultations.southglos.gov.uk/PT.6609_Thornbury_High_St._E.T.O/consultationHome As part of the consultation we also welcomed comments made online and by letter, email and over the phone and these contact methods were promoted on consultation literature. Consultation information was sent to Town and Parish Councils, South Gloucestershire councillors and local voluntary and community organisations. Notifications were also sent to a range of other stakeholders and interested parties. Thornbury High Street Consultation Output Report V2 7
Due to the restrictions in place with Covid-19, all consultation work was held online, however
paper copies of the survey were made available to all who requested them, and every effort
was made to engage residents through a range of different methods such as online
meetings, offering offline response options etc.

Engagement methods
Consultation meetings
Representatives attended meetings and activities to promote and discuss the consultation.
This includes a variety of community groups, organisations and partnership meetings. A full
list of meetings attended is available on request.

Focus groups
An external partner, Atkins, ran nine focus groups as part of the consultation. Levels of
participation were as follows:
   • Chamber of Commerce - 17 participants
   • Businesses not represented by the Chamber - 2 participants
   • Hospitality businesses - 1 participant
   • Town and Ward Councillors - 4 participants
   • Seldom heard groups- 3 participants
   • Residents group 1 - 20 participants
   • Residents group 2 - 12 participants
   • Residents group 3 - 14 participants
   • High Street residents - 7 participants
Findings from the focus groups are discussed in section 4 of this report.

Consultation survey
The survey was open from 21 July 2020 until [7 February 2021*
*Due to an administrative error, the survey was closed a day earlier than the original closing date of midnight on
the 28 January 2021 which meant consultees were unable to access the survey. The survey was reopened and
the consultation was extended by an additional week until the 7th February 2021. We received an additional 335
responses during this period.

Other response methods
14 emails and three letters were received in response to the consultation. The responses
were from Town and Parish Councils, the local Member of Parliament, members of the
public, an interest group representative about transport, and one internal council team:

Response to survey
A total number of 2,890 survey responses were received, with 2,674 people completing the
questionnaire online or via smartphone, and 216 people completing a paper version of the
questionnaire and returning it in the post.

General caveats
The results of this consultation are not statistically representative of the views of South
Gloucestershire residents due to the nature of the consultation methodology used. The level
of response, information gathered and views obtained still provide a useful indicator of wider
opinion and any important issues that will need to be considered.

Thornbury High Street Consultation Output Report V2                                                             8
Due to the software used and the different response options open to respondents, it was possible for people to submit more than one response. This has been monitored during the consultation period and analysis and it does not appear to have been abused or be a significant issue affecting the response. Any obvious duplicate comments, personal information and comments that can identify individuals, have been removed from the comments analysis. Percentages used in this report have been rounded and may not add up to exactly 100%. For some survey questions, respondents could select more than one response which also means that percentages or number of responses, if added together, can total more than 100% or more than the number of responses received. We have included all responses received direct to us as part of this consultation report, however we are aware of other comments made particularly via social media, in comments made to news articles online and in letters to the press that we have not been able to practically include. A full list of all comments made is available on request; there were 7,980 individual comments made so it has not been possible to include the full text of all comments within the main body of this report. Further Information This report was produced by South Gloucestershire Council’s Insights and Engagement Team. Further information about this report is available from the Corporate Consultation Officer: 01454 866895 consultation@southglos.gov.uk www.southglos.gov.uk South Gloucestershire Council, Corporate Research and Consultation Team, Council offices, Badminton Road, Yate, Bristol, BS37 5AF Thornbury High Street Consultation Output Report V2 9
3.0 Survey analysis
3.1 Respondent profile

2890 people responded to the online survey.

    •   2147 (74%) of these were residents of Thornbury.
    •   639 (22%) were from the wider South Gloucestershire/Bristol area.
    •   77 people (3%) were an employee of a business in Thornbury.
    •   72 people (2%) said they were an owner of manager of business in Thornbury.
We also received responses from 27 people who work for a voluntary or community sector
organisation and 9 parish or town councillors. (NB: respondents could select more than one
option).

Age and gender
There was a higher proportion of women to men who responded to the survey, with 56%
female and 44% male. 5 respondents identified themselves as ‘other’. The highest
representation was from the 65 to 75 age category and the lowest in the 16 to 24 age group.
In total, 70% of those responding were over the age of 45.

Chart 1: Age profile of respondents
 25%

 20%

 15%

 10%                                                                 21%
                                               18%        19%

                                    14%
                                                                                12%
  5%
                          9%

             2%
  0%
           16 to 24     25 to 34   35 to 44   45 to 54   55 to 64   65 to 75   Over 75

Base: All respondents (2643)

The disparity between male and female respondents increased with the lower age groups,
with a significantly higher proportion of women than men responding to the survey.

Thornbury High Street Consultation Output Report V2                                      10
Chart 2: Gender/Age profile of respondents
80%
71%
70%
62% 62%
58%
60% 53% 52%
48% 49% 51%
50% 47%
42%
40% 36% 37%
30% 26%
20%
10%
0%
16 to 24 25 to 34 35 to 44 45 to 54 55 to 64 65 to 75 Over 75
Female Male Other Prefer not to say
Base: All respondents (2627)
Ethnicity
5% of respondents stated they were from a Black, Asian and Minority Ethnic background,
which is consistent with the profile across South Gloucestershire (data from Census 2011).
This was fairly consistent across the age groups, with the highest representation being 8% in
the 35 to 44 age category.
Table 1: Ethnicity
Age
Prefer
Respondents 16 to 25 to 35 to 45 to 55 to 65 to Over not to
Base 24 34 44 54 64 75 75 say
Total 2496 59 224 360 467 480 552 314 40
Ethnicity
Black, Asian and Minority 115 3 12 28 19 21 14 13 5
Ethnic + White Non-British or 5% 5% 5% 8% 4% 4% 3% 4% 13%
Other ethnic group
White British 2381 56 212 332 448 459 538 301 35
95% 95% 95% 92% 96% 96% 97% 96% 88%
Base: All respondents – see base totals
Disability
318 people stated they had a disability- equating 12% of survey respondents. Whilst the
highest population of those with a disability came from those over 65 (52%), proportionally
there was representation from all age groups – as illustrated in the table below. 19% of
respondents over the age of 65 (165 people) said they had a disability.
Thornbury High Street Consultation Output Report V2 11Table 2: Disability/Age of Respondents
Age
Prefer
35 to 45 to 55 to 65 to Over not to
16 to 24 25 to 34 44 54 64 75 75 say
Base 2600 60 226 373 489 505 569 314 64
Disability
Not disabled 2282 47 211 351 444 461 493 225 50
88% 78% 93% 94% 91% 91% 87% 72% 78%
Disabled 318 13 15 22 45 44 76 89 14
12% 22% 7% 6% 9% 9% 13% 28% 22%
Base: All respondents – see base totals
Over half of respondents stating they had a disability (53%, 170 people) stated they had a
physical impairment, with 141 (44%) people having a long standing illness or health
condition.
12% of those over 65 said they had a physical disability, increasing to 19% for those over 75.
Chart 3: Type of disability
60%
53%
50%
44%
40%
30%
20%
12%
10% 8%
4% 3%
0%
Physical Long standing Mental health Sensory Other Learning
impairment illness or health condition impairment disability/
condition difficulty or
cognitive
impairment
Base: Respondents stating a disability (n=318)
Families
885 respondents (around a third of total respondents) said they had children living in their
household aged up to 21, with 62% saying they did not have any children living in their
household.
35 to 44 year olds were most likely to have children living at home, with 85% having a child
or young adult up to the age of 21 living at home. This was followed by 45 to 54 year olds
with 72% having a child or young adult up to the age of 21 living at home. Nearly half (47%)
of respondents in the 25 to 34 year age bracket said they did not have children:
Thornbury High Street Consultation Output Report V2 12Table 3: Q25 Are there any children in the following age categories living in your household?
Respondent Age
16 to 24 25 to 34 35 to 44 45 to 54 55 to 64 Over 65
Base 56 223 369 486 501 882
% with Children in Household 54% 55% 85% 72% 20% 3%
0 to 4 10 88 116 38 22 18
18% 39% 31% 8% 4% 2%
5 to 11 2 38 188 74 8 3
4% 17% 51% 15% 2% 0%
12 to 16 10 8 83 162 21 4
18% 4% 22% 33% 4% 0%
17 to 21 11 3 19 160 51 4
20% 1% 5% 33% 10% 0%
Base: See individual columns
Businesses and organisations
72 people responded as a business manager or owner. 24 worked in retail, 13 food and
beverage, 7 offices, and 6 in health and social care, along with representation from
training/education (2), manufacturing (2) and leisure.
42 classified themselves as local businesses, 9 regional, 9 national, and 4 operating
internationally.
3.2 Travel
Respondents were asked how they travelled to and from Thornbury and how they accessed
facilities, such as the car parks, buses, disabled bays, and cycle lanes when visiting the high
street.
Whilst car use was the primary use of transport, it was clear that people access the high
street in several different ways with a high population also walking.
Mode of transport
• Most respondents (83%) used a car to travel to Thornbury High Street, whilst 64%
also say they walk.
• Buses were used by 9% of respondents (256 people). 54% of bus users were over
the age of 65.
Thornbury High Street Consultation Output Report V2 13Chart 4: Q3 How did you access Thornbury High Street before Covid-19 (multiple response)
Car (driver or passenger) 83%
Walk 64%
Cycle 12%
Bus 9%
Motorbike 2%
Taxi 1%
Mobility Scooter 1%
0% 10% 20% 30% 40% 50% 60% 70% 80% 90%
Base: All respondents who provided their age (
The highest car usage (either as a driver or passenger) is amongst those in the 35-44 age
group (88%), however 70% of this age group also walk to the high street (see table 5).
Bus usage was the highest amongst the 16-24 age group and the over 65s, who
accounted for nearly half of all those respondents (125) out of the 256 people who
said they use the bus.
Chart 5: Transport usage by age
Age
16 to 24 25 to 34 35 to 44 45 to 54 55 to 64 65 to 75 Over 75
Base 62 239 383 501 522 587 327
Walk 46 152 268 332 334 388 185
74% 64% 70% 66% 64% 66% 57%
Bus 15 9 28 31 25 73 52
24% 4% 7% 6% 5% 12% 16%
Cycle 7 31 61 60 73 59 22
11% 13% 16% 12% 14% 10% 7%
Car (driver or passenger) 47 197 336 428 419 476 263
76% 82% 88% 85% 80% 81% 80%
Motorbike 2 1 12 16 15 8 2
3% 0% 3% 3% 3% 1% 1%
Mobility Scooter - 1 2 2 6 10 7
- 0% 1% 0% 1% 2% 2%
Taxi - 1 7 1 2 2 2
- 0% 2% 0% 0% 0% 1%
Base: All Q3 respondents who provided their age (n=2,621)
Thornbury High Street Consultation Output Report V2 14Disability
Chart 6: Transport mode for those with a disability
90% 84%
80%
70%
60%
50% 44%
40%
30%
20% 14%
8% 6%
10% 1% 1%
0%
Car Walk Bus Mobility Cycle Motorbike Taxi
Scooter
Base: Respondents with a disability(n=318)
For those with a disability, 84% (268 respondents) travel by car, this increased to 96%
for those with a physical impairment.
44% also stated they walk to the high street (33% for those with a physical impairment). 14%
(43 people) say they use the bus – compared to 8% of those without a disability. 67% of
people who had a sensory impairment, mental health condition or learning disability stated
they walk to the high street (alongside other forms of transport).
Q23. [Asked to those who stated they had a disability] – Please tell us how the proposals
may impact you or how we could improve accessibility to the High Street for you:
Whilst some people enjoyed the environment with a lack of traffic, the main concern for
those with a disability, was the ability to park conveniently or close enough to where they
needed to be. This was also one of the main contributing factors for those with a disability
who had not been to the High Street since June 8.
“With the temporary High St restrictions, it is not possible to access businesses
directly. I am disabled and have musculoskeletal and balance problems. I use a
walking stick and cannot carry large or heavy loads. The disabled parking bays
have been occupied when I have attempted to use them. Parking outside a
business for access would solve this.”
“Losing car access to the high street means I can’t pick up my medications or
visit the area as the car parks are too far away for me.”
Thornbury High Street Consultation Output Report V2 15Theme Number of
respondents
Not enough parking need more/disabled spaces 83
Negative effect on people (inaccessible, health issues) 55
No longer visiting High Street (inaccessibility) 32
Open High Street to traffic/parking 22
Miscellaneous 9
Need improved pavements for mobility scooters, prams etc. 8
No impact 7
Need to be able to drop off 5
Should be one way traffic system 5
No traffic (less pollution, safer) 4
Access to public toilets 3
Regulate cyclists (specific cycle lane) 3
Better bus services 2
Agree with proposals 2
Better access for customers 2
Prevent traffic in pedestrianised areas 2
Put more money into High Street 2
Disagree with proposed changes 1
More seating facilities 1
More space for pedestrians/better access 1
Hazardous for pedestrians 1
Reduce speed limit 1
Increased bus routes 1
Too many new homes built 1
Need more infrastructure (GP's, schools) 1
Pedestrianisation is not suitable 1
More access routes for pedestrians 1
Accessing the High Street
The free car parks were well used by all respondents.
• 95% of car users used the ‘Free Short Stay Car Park’ at least 1 to 3 times a month,
with 71% using it at least once a week – 22% would use it 1 to 3 times a month.
• 81% of car drivers with a stated disability also used this car park at least 1 to 3 times
a month, with 69% using it at least once a week.
• The ‘Free Long Stay Car Park’ was used by 69% of car users at least 1 to 3 times a
month, with 44% using it weekly.
• Those with a disability used the long stay car park less frequently, with 52% using it at
least once a month and 41% saying they use it at least once a week.
Thornbury High Street Consultation Output Report V2 16• 118 car users with a stated disability (51%) used the Blue badge parking on the High
Street double yellow lines ‘once a week or more often’. 50 respondents without a
disability also used the blue badge parking.
• 26% of cyclists used the cycle parking at least once a month and 31% did so 1 to 3
times a month.
Chart 7: Use of transport facilities in Thornbury up to March 2020
Use of transport facilities up to March 2020
90%
80%
70%
60%
50%
40%
30%
20%
10%
0%
Bus Stop (n=2,321) Freeshort stay car parks Free long stay car parks Cycle parking (n=2,031) Blue badge parking on
(n=2,726) (n=2,485) double yellow lines
(n=2,104)
Once a week or more often 1 to 3 times a month A few times a year or less Never
Base: All respondents – base number shown for each question
Bus usage
Respondents were asked what would encourage them to visit the high street more often by
bus. Whilst 61% did not feel they would use the bus, there were some factors that were felt
to make it more likely to encourage respondents to use the bus: 20% said that better bus
stop facilities, 19% said more frequent services, and 13% said more evening and weekend
services, would be a factor to encourage them to use buses more often.
Thornbury High Street Consultation Output Report V2 17Chart 8: Q20 What changes would make you more likely to visit the high street by bus?
70%
61%
60%
50%
40%
30%
19% 20%
20%
13%
8% 7%
10%
0%
More evening More frequent Better bus stop Newer / cleaner None of the Other (please
and weekend services facilities e.g. buses above / would specify below)
services shelters, real not use bus
time information,
raised kerbs
Base: All respondents (n=2,642)
76% of respondents who said they would not use the bus are residents of Thornbury (many
who live in walking distance), compared to 26% from the wider South Gloucestershire/Bristol
area, with 28% of these stating they wanted to see more frequent services.
422 respondents who currently travel by car (19% of car drivers) said that better bus
stop facilities would be a factor in encouraging increased bus use, followed by more
frequent services. 58% of current bus users and 23% of those who walk also wanted to see
better bus stop facilities. Current bus users also wanted to see more frequent services (39%)
and more evening and weekend services (32%).
Q20. What changes would make you more likely to visit the High Street by bus?
Respondents who commented on this generally stated they did not use the bus because
they were close enough to the High Street to walk, or there were no bus services that were
convenient due to their location.
“Live too close to High Street no need for bus. Would use bus to travel to
Bristol.”
Theme Number of
respondents
Don't use buses (walk, car, disability) 138
No buses available from local area 52
Need a bus stop on High Street 31
More frequent services 27
Cheaper fares 24
Miscellaneous 22
Open High Street 16
Bus services are adequate 15
Thornbury High Street Consultation Output Report V2 18Buses available from more areas 14
More bus stops/shelters 12
Buses too infrequent 11
Better links to other areas of Bristol 9
N/A 9
Rock St bus stop inconvenient 8
More reliable with timings 7
Not using due to Covid-19 5
Quicker routes 5
Electronic notice boards at bus stops 5
Disabled parking 3
Poor bus service 2
No buses on High Street 2
Easier to use bus timetables 2
Better safety 2
Less pollution 2
More efficient/modern 2
Re-stablish bus service for Park Farm Estate 2
More environmentally conscious buses 1
Ban non-service buses 1
Reintroduction of 'hail & ride' bus 1
Easier access (prams, children, disability) 1
Money incentives 1
Armstrong hall 1
Specific bus/deliveries lane 1
3.3 Use of the High Street (Prior to Covid-19)
Respondents were asked how they used the high street in the year up to March 2020.
People most frequently visited the high street for shopping and using local businesses, such
as pharmacies, hair salons, banks etc. 8 out of 10 people were weekly visitors to the high
street for their shopping and 97% of all respondents shopped there at least once a month.
Older residents and those with a disability were most frequent users of the high street for
shopping, though less popular with the younger age groups, including the 25 to 34 year olds.
Those from the wider South Gloucestershire/Bristol area would visit less frequently (62%
once a week, 29% 1 to 3 times a month), but shopping was still their primary purpose, along
with using other facilities during their visit.
The high street is also an important place for social interaction and respondents frequently
visited to meet up with family and friends. 81% said they use the cafes and restaurants on
the high street at least once a month.
Shopping
• Overall, 2828 (99%) of respondents used Thornbury High Street for shopping, with
97% of these using it at least once a month and 79% at least once a week.
Thornbury High Street Consultation Output Report V2 19• 99% of local residents use it for shopping at least once a month, with 91% of
residents from the wider South Gloucestershire/Bristol area also visiting at least once
a month for shopping.
• Older age groups were most likely to use Thornbury High Street for shopping at least
once a week, with 87% using it at least once a week, rising to 91% for the over 75s.
• 264 of the 315 disabled respondents (84%) were also using it once a week compared
to 79% without a disability.
• Respondents in the 25 to 34 age group were less likely to use it weekly for shopping
(65%) as compared to other age groups.
Using a local business (e.g. post office, pharmacy, bank, hairdresser)
• 92% of respondents used a local business at least once a month.
• 60% of residents use a local business at least once a week, and 35% 1 to 3 times a
month. 84% of visitors from the wider South Gloucestershire/Bristol area were using
local businesses at least once a month, with 43% visiting weekly.
• Weekly usage was highest in the older age groups, 64% in the 65 to 75 age group
increasing to 74% for those over 75. This dropped to 47% for the 16 to 24s and 39%
for the 25 to 34s. However, 83% of the 16 to 24s and 85% of the 25 to 34s were using
it at least once a month.
• 65% of disabled respondents used a local business at least once a week compared to
54% of those without a disability.
Paid work and volunteering
• 51 of the 63 respondents who stated they were an owner or manager of a business
(81%) visited the high street at least once a week for paid work, as did 66% of
employees of a business in Thornbury.
• A quarter (25%) of respondents in the 16 to 24 age group visited at least once a
week for paid work.
• 18% of BAME and white non-British respondents also worked once a week compared
to 9% of white respondents.
• 11% visited at least once a month for volunteering.
• 69% of those volunteering at least once a week were over the age of 65.
Meeting family or friends
• 40% of respondents used the high street at least once a week to meet with family and
friends, with 78% visiting at least once a month for this purpose.
• This was higher for women than men, with 46% meeting up with family or friends at
least once a week compared to a third of men (33%).
Thornbury High Street Consultation Output Report V2 20• The youngest and oldest age groups were most likely to do this regularly, with 50% of
16 to 24 year olds and 49% of the over 75s meeting at least once a week. This
compared to 40% of the 25 to 34s and 36% of those 35 to 44. However, those in the
25 to 34 age bracket were more likely to visit 1 to 3 times a month (46%).
• 85% of those with children younger than 4 and 84% with children aged 5 to 11 also
visited at least once a month to meet with family or friends.
• 78% of white respondents also stated they would visit to meet up with family/friends
compared to 73% of those from a Black, Asian or Minority Ethnic background.
• 46% of those with a disability visited weekly for this reason, compared to 39% of
those without a disability.
Eating and drinking
• 45% of local residents stated they used a café or restaurant at least once a week, with
a further 40% 1 to 3 times a month.
• Those living slightly further afield, but within the South Gloucestershire/Bristol area
were less frequent visitors (29% weekly), but still 70% used a café or restaurant at
least once a month.
• As with ‘Meeting family or friends,’ women were also more likely to use cafés or
restaurants more frequently than men (45% weekly compared to 37% of men), with
this being more balanced for those visiting 1 to 3 times a month (40% women and
41% men). Men were more likely to say they visit a café or restaurant a few times a
year (20%) compared to 14% of women.
• 92% of 16- to 24-year-olds use a café at least once a month, with 47% doing so
weekly. 80% of over 75s also used these facilities at least once a month with nearly
half (49%) making this a weekly occasion.
• 86% of those with children aged under 11 also used a café or restaurant at least once
a month.
• 48% of people with a disability also responded they visited weekly compared to 40%
of those without a disability.
• The most frequent users of pubs were 16 to 24 year olds (41% weekly), with men
more likely to make a regular trip of at least once a week (27%) compared to 19% of
women. Nearly two thirds of men (58%) visit a pub at least once a month compared to
(49%) of women.
• People travelling from outside of Thornbury were less likely to be visiting the pub, with
just over a third (32%) visiting at least once a month compared to 58% of those who
are local residents.
• Younger age groups were also the biggest users of fast food and takeaways. 93% of
16 to 24 year would visit to use these monthly and nearly half 48% weekly (see chart
9).
Thornbury High Street Consultation Output Report V2 21Chart 9: Use of pubs/restaurants and takeaways - by age profile
At least once a month
100% 93% 92%
90% 86%
81% 82% 81% 80%
77% 79%
80% 75%
71%
68%
70% 64% 64%
60% 55% 53% 53% 53% 51%
50% 46%
41%
40%
30%
20%
10%
0%
16 to 24 25 to 34 35 to 44 45 to 54 55 to 64 65 to 75 Over 75
Fast Food/takeaway Pub Café or Restaurant
Base: All respondents
Other leisure activities
Exercise
• A quarter of respondents (25%) visited the high street for exercise at least once a
week. This was highest amongst cyclists (36%), with 56% using it at least once a
month for exercise. 37% of car drivers used it once a month for exercise compared to
45% of walkers and 43% of bus users.
• 25 to 34 year olds were least likely to use it for exercise, with 29% saying they would
use it once a month compared to at least 40% in all other age groups.
Attending a group or class
• Women were more likely than men to visit weekly to attend a group or class, with
nearly a quarter of women (23%) compared to 9% of men saying they visit for this
reason. Just over a third (34%) of women said they attend a group or exercise class
at least once a month compared to just 17% of men.
• 29% of those with a disability also attended a group or class at least once a
month, and White respondents (27%) were more likely to visit at least once a month
than those from a Black, Asian and Minority Ethnic background (18%).
• 26% of respondents in the 65 to 75 age group also visited at least once a month to
attend a class, and 35% of those over 75.
• Over half of those aged over 75 attended a group or class at least once a month. This
is significantly higher than other age groups.
Thornbury High Street Consultation Output Report V2 22Table 4: Attending a group or class by age
Age
Respondents 16 to 24 25 to 34 35 to 44 45 to 54 55 to 64 65 to 75 Over 75
Base 59 219 334 414 370 371 184
% At least once a month 17% 19% 20% 18% 22% 39% 51%
Attending a group or class
Once a week or more often 4 30 36 48 53 97 65
7% 14% 11% 12% 14% 26% 35%
1 to 3 times a month 6 12 32 26 30 48 29
10% 5% 10% 6% 8% 13% 16%
A few times a year or less 8 37 69 71 45 33 21
14% 17% 21% 17% 12% 9% 11%
Never 41 140 197 269 242 193 69
69% 64% 59% 65% 65% 52% 38%
Base: All respondents (n=see column totals)
Libraries
• 29% of Thornbury residents use a library at least once a month, with a third (31%)
using it a few times a year.
• Over 75s were the biggest users, with 51% using the library at least once a month
and a quarter (25%) using it once a week or more often. 40% of those aged 65 to 75
years also use it at least once a month.
• There was also a higher usage of the library amongst respondents from a Black,
Asian and Minority Ethnic background, with 40% stating they use at least once a
month compared to 27% of white respondents.
3.4 Views on the changes
There were a number of changes that were put in place under the Experimental Traffic
Regulation Order (ETRO). These included:
• Vehicle access to off-street premises and loading restricted to the area of the high
street between Chapel Street and The Close.
• Southbound one-way system for motor vehicle loading and access to off-street
premises on the high street between the junction with Castle Court and the junction
with The Close.
• South bound bus stop relocation to Rock Street with a new shelter.
• Pedestrian and cycle zone along Thornbury High Street between Castle Court and
Chapel Street.
• 20mph speed limit on Castle Court, The Close, the high Street and part of Chapel
Street.
Thornbury High Street Consultation Output Report V2 23• No parking in the pedestrian and cycle zone (including waiting, drop-off and pick-up)
• Introduction of parking for blue badge holders at each end of the scheme.
It was important to understand peoples’ views on these, and they were asked to rate what
they felt about these changes being made permanent.
Experimental Traffic Regulation Order (ETRO) feedback
20mph speed limit pedestrian/cycle zone
• 80% of respondents agreed to the principle of a 20mph speed limit on Castle Court,
The Close, High Street and the part of Chapel Street (either as it is or with a change
of the size of the zone), with 13% disagreeing.
Pedestrian/cycle zone
• 29% agreed with making the pedestrian and cycle zone permanent, with 65%
disagreeing. Those in agreement increased to 47% for those who have visited once a
week or more since the changes were implemented.
• 50% of those who disagreed had visited less than once a month.
• Those with a disability were even less likely to agree, with 70% disagreeing and 25%
agreeing that it should be made permanent.
• When looking just at responses from those who had visited Thornbury High Street at
least once a week since the ETRO was put in place, the numbers are more positive.
45% agree overall, with 62% of cyclists agreeing. By contrast, those who had visited
less than once a month were much likely to disagree – 79% disagreeing overall,
including 73% of cyclists.
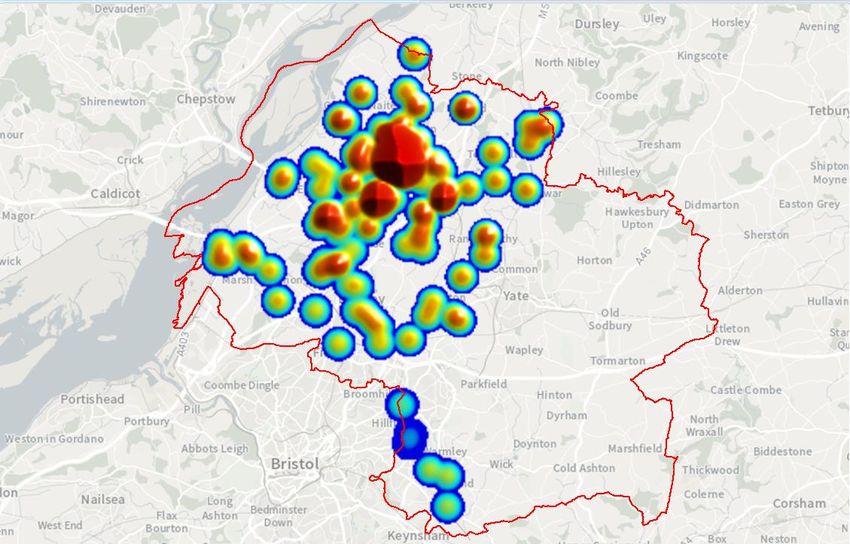
Analysis was undertaken to determine the home location of those respondents who agreed
and disagreed with the pedestrian and cycle zone along Thornbury High Street between
Castle Court and Chapel Street, see images 1 and 2 below.
Overall the pattern of home locations was similar between the two sets of respondents, with
no clear variations in geography.
Thornbury High Street Consultation Output Report V2 24Image 1: Respondents agreeing with the pedestrian and cycle zone Base size: Respondents agreeing who provided a valid postcode (n=879) Image 2: Respondents disagreeing with the pedestrian and cycle zone Base size: Respondents disagreeing who provided a valid postcode (n=1598) Thornbury High Street Consultation Output Report V2 25
Parking and loading
   • Just under a third (29%) of respondents agreed there should be no parking except for
      loading within the pedestrianised zone – which included no waiting or drop-offs – with
      65% disagreeing.

    •   More frequent visitors (those who visited at least once a week) since the changes
        were made were likely to be more positive, with a split of 47% agreeing and 47%
        disagreeing.

    •   37% agreed that two-way traffic for loading and access to off-street premises should
        be made permanent, with 45% disagreeing.

One-way system
  • 31% agreed with the current one-way system for vehicle loading and access to off-
     street premises only. This was lowest with car drivers and passengers where just over
     a quarter (26%) agreed, as compared to cyclists (44%) who were more likely to agree.

    •   Only 8% thought it should be changed to a north bound one-way system.

    •   49% disagreed with the one-way system completely, highest disagreement was
        amongst car users (54%) and motorcyclists (67%).

Bus access
59% thought that buses should be allowed through the one-way system, with highest
agreement levels amongst bus users themselves (74%), whilst overall 28% of respondents
disagreed.

Chart 10: Q10- Would you agree or disagree with buses being allowed through the one-way
system in future?
 70%

 60%

                    59%
 50%

 40%

 30%

                                          28%
 20%

 10%
                                                                      13%

  0%
                    Agree                Disagree       Neither agree nor disagree / don't
                                                                      know
Base: All respondents (n=2,843)

Thornbury High Street Consultation Output Report V2                                          26
Access for loading goods
The most popular first choice/preference was for ‘Unrestricted loading’ with 76% of
respondents choosing this option, followed by restricting hours to before 9am and after 5pm
which 67% stating it as their first choice.
There were mixed views, however, on the best way of managing deliveries to businesses
and shops. Those who had strong feelings that the High Street should not be pedestrianised
felt that deliveries should continue as they are, whilst other felt that a compromise could be
made to restrict the timing of deliveries.
Having a hybrid option was also a concern for some in that if it was pedestrianised, but large
vehicles were still able to access, this could be a hazard.
“Local businesses need to be supported by easier deliveries to keep
shops supplied. Too tight a restriction might hamper their business.
One way system would make this safer.”
“It seems sensible to allow loading to take place when shop
and other premises are open for normal business hours rather
than outside normal hours causing the shop keepers even
more inconvenience.”
“Any traffic through a pedestrianised area will be a hazard, so limit
the loading time and make it early so that businesses can still thrive
but pedestrians will feel safer especially after midday.”
Q11 ‘Other’ responses to managing deliveries
Theme Number of
comments
High Street should be open/shouldn't be closed 278
Should be supporting needs of businesses 159
Restricted loading/deliveries outside of busy times (9-5) 133
Unrealistic to stick to set/restricted delivery times 105
Pedestrian safety 96
One way system preferred 89
Businesses would suffer/be restricted 79
Miscellaneous 70
If High Street is pedestrianised there should be no traffic 53
Traffic in High Street hazardous to pedestrians 48
Make it pedestrianised 42
Reduce traffic 40
Less traffic (congestion, pollution) 31
Loading/deliveries in morning preferred 25
Thornbury High Street Consultation Output Report V2 27Needs to be parking in street 25 Vehicles should have access to load/park 24 Local High Street decline 22 Not affected 20 Loading/deliveries allowed at anytime 18 Loading/deliveries in the afternoon preferred 15 Make High Street thrive/community space 14 Reduce pollution (noise, air) 13 Speed limit enforced 12 Create delivery/collection bays 11 Limiting for elderly/disabled 11 Dropping off/parking is an issue blocking road 11 Should be up to businesses to decide 7 Better access/convenience 7 No cyclists allowed/causing danger 7 No comment 7 Should have wider range of delivery times 6 Disagree with one way system 5 Need more info to make decision 5 Avoid peak pedestrian hours 4 No loading at weekends 4 Less disruption to traders 2 Increased costs to consumers/residents 2 Alternative access route 2 Add cycle path 2 Limit vehicle access/time limit 2 Compromise between deliveries/public use 2 Too many deliveries 2 More infrastructure 2 Extended loading hours would benefit businesses 1 Living on High Street 1 Road too narrow for cars and deliveries 1 Waste of money 1 Spacing between deliveries 1 Extend time of vehicle access 1 Impractical to limit hours 1 High Street gets crowded 1 Enforce engine off policy 1 Meet commercial needs 1 Business owners/managers were also asked if there was anything preventing them from arranging deliveries outside of retail hours: Q29. If there is anything that prevents you from arranging deliveries outside of retail hours, please let us know: One of the main issues is that courier services and deliveries cannot be scheduled for specific times (e.g. only AM or PM), and they operate at the same hours as shops and businesses. Thornbury High Street Consultation Output Report V2 28
“Small business like myself and most of the High Street have
  deliveries by courier, which cannot be time booked as they operate
  the same hours as the shops! Also the whole of the left side (looking
  down) have no rear access, all deliveries have to come through the
  front door.”

 Theme                                                   Number of
                                                       respondents
 Couriers not operating outside core hours                       15
 Staffing costs                                                   5
 No staff available                                               3
 Unable to stay outside of retail hours                           2
 No rear access                                                   2
 Parking near to business is essential                            1
 Upset neighbours                                                 1
 Disabled parking bays outside business                           1

Q15. If the changes to the Experimental Traffic Regulation Order are not made permanent,
what other traffic management measures (if any) would you want to see along the High
Street?

             “I would like to see a range of options presented for consultation and
             comment by the people of Thornbury. Other options should include: revert
             to the previous arrangement; revert, with some modifications, such as better
             access and parking for disabled; a one-way, single-lane High Street, with a
             cycle lane and traffic calming. All options should include consideration of the
             implications for the wider area (e.g. hazards in Rock Street).”

The implementation of a one-way system – supported with a 20mph speed limit – was
frequently stated. Many people wanted to see improved access for parking, but there were
also those that felt that parking could be a problem and cause congestion.

     “If you are looking to minimize traffic in High Street make it a one way
     system - allowing buses to travel up the High street (the Bus stop is
     there and a lot of money spent on improving it in 2019/2020) also
     parking in High street limited to allow collection of Takeaways and Shop
     purchases- at the moment access to High street is extremely limited -
     only St Mary’s arcade way through - - open up the old street by old
     Police station etc - at the moment when it’s a chilly day and wet - not
     good.”

Thornbury High Street Consultation Output Report V2                                            29
“I would be much less opposed to a one way system through high street and
Rock Street. This could eliminate the roundabout and elevate traffic as well as
allowing extra parking/bus stops.”
“I think making this permanent would be great, but accept that a compromise
could be making the high street one way, with access for buses, taxis,
businesses and blue badge holders, with some parking on the high street for
the above vehicles. I think this would give more pedestrian space whilst
catering for the concerns of businesses and residents.”
Theme Number of comments
One way system 860
None (restore to how it was) 367
Speed limits 338
Parking in High Street (including disabled) 318
Miscellaneous 101
Wider pavements (outside seating) 94
Limit parking (e.g. times ,spaces) 85
Enforcing of illegal parking 78
Traffic calming measures 69
Restricted loading/drop off 45
Cycle facilities 38
Restore bus route through 37
No traffic at all (only pedestrians) 27
More crossings 27
Limit pedestrianisation (e.g. weekends/events) 22
Dedicated drop off areas 17
No buses 7
Restricted cyclists 7
Better road markings 6
No heavy goods vehicles 5
Better path/road maintenance 5
No outside seating 3
Additional routes for traffic 3
Pedestrianised 2
Closed on weekend 2
Parking permit for residents only 2
Only shut High Street for events 2
Shared space between cars and pedestrians 2
Electrical vehicle charging points 2
Reduced pollution 1
Removal of flower boxes 1
Restricted driving times 1
Thornbury High Street Consultation Output Report V2 303.5 Views on pedestrianisation
To understand the complete picture of how they felt about the changes, respondents were
asked on how their visiting habits to the High Street had changed since the ETRO was put in
place, to understand the context in which they were answering the question.
There was a notable pattern that views on the changes and the success of the
pedestrianisation were more positive with those who had visited regularly since June 8 (at
least once a month), as compared to those who had visited less than once a month or not at
all.
Frequency of visits since the Emergency Traffic Regulation Order was put in place on
Monday 8 June 2021
Chart 11: Q6 On average, how often have you visited Thornbury High Street since Month 8
June (when we put in place the Emergency Traffic Order to pedestrianise the road)?
40% 38%
35%
29%
30%
24%
25%
20%
15%
10%
10%
5%
0%
Once a week or more often 1 to 3 times a month Less than once a month Have not visited the High
Street since 8th June
Base: All respondents (N=2873)
• 1087 (38%) of respondents had visited the high street at least once a week since the
ETRO was put in place on June 8 2021, with two-thirds (62%) visiting at least once a
month.
• 85% of those visiting at least once a week were local residents of Thornbury. 12%
were from the wider South Gloucestershire/Bristol area.
• 93% of those visiting once a week since 8 June were also residents of Thornbury who
stated they walk to the High Street. 81% of car drivers were also Thornbury residents,
with 16% of car drivers visiting from the wider South Gloucestershire or Bristol area
(though 93% of these respondents travelled by car).
• 85% of Thornbury residents who visited at least once a week walked to the high
street, as compared to 69% who travelled by car. 76% of those with a disability also
walked to the high street as compared to 64% (54 of 84 people) using a car.
• 62% visited at least once a month, and 289 people (10%) of respondents had not
visited at all since 8 June.
Thornbury High Street Consultation Output Report V2 31• Of the 289 that did not visit, 78 (27%) of those were disabled, which represents 25%
of the disabled respondents.
Respondent views on the impact of pedestrianisation
• When asked to rate how they thought different aspects of the pedestrianisation had
worked so far, those respondents who had regularly visited since the changes (at
least once a month), were more likely to give a positive rating than those who had
visited less than once a month or not at all.
• Of those who had visited at least once a month, ‘Easy to keep social distancing’
(59%), less air pollution (57%) and lack of traffic congestion (52%) were the highest
scoring options, with a majority of respondents selecting a positive response for each.
• The lowest scoring (with the most negative ratings) of those who visited regularly
were ‘Convenient access to shops’ (40%) and ‘a more pleasant place to be’ (39%).
• For those who had visited less than once a month or not at all, the most positive rating
was ‘Easy to keep social distancing’ (25%), ‘Less air pollution’ (24%) and ‘Lack of
traffic congestion (22%). The lowest scoring was ‘Convenient access to shops’ (82%
rating quite poor or poor – with 72% rating ‘very poor’), ‘A more pleasant place to be’
(73%) and ‘A space to spend time with friends and family’ (61%).
Chart 12: Q12 - How well has the pedestrianised High Street working in the following
aspects so far? Rated by frequent visitors since 8 June 2021
Those who visited at least once a month since 8 June 2020
Feeling safe whilst using the High Street (1634) 19% 11% 25% 13% 32%
A more pleasant place to be (1650) 28% 11% 17% 10% 34%
Being able to eat/drink on High Street (1525) 18% 11% 26% 16% 30%
A space to spend time with friends and family (1514) 17% 11% 30% 13% 29%
Lack of traffic congestion (1601) 21% 6% 20% 15% 37%
Convenient access to shops (1671) 30% 10% 18% 13% 29%
Easy to keep social distancing (1639) 7% 7% 27% 21% 38%
Less air pollution (1378) 10% 29% 24% 33%
0% 50% 100%
Very Poor Quite Poor Neither good nor poor Quite Good Very Good
Base: Respondents who visited once a week or more often and ‘1 to 3 times a month’ (excludes Don’t know/Not Applicable)
– individual base numbers in brackets
The above chart shows the distribution of responses for those who stated they visited the
High Street at least once a month since 8 June 2021, as compared to the below chart
which shows the distribution of responses for those who stated they visited the High Street
less than once a month since 8 June 2021. The green bars show the positive responses,
and it can be seen in comparison that the results from those who visited at least once a
month gave more positive ratings overall.
Thornbury High Street Consultation Output Report V2 32You can also read