Time Series Predictive Analysis of Bitcoin Price - Atlantis Press
←
→
Page content transcription
If your browser does not render page correctly, please read the page content below
Time Series Predictive Analysis of Bitcoin Price

                                        Ruihan Yan(B)

                      Xiamen University, Xiamen 351005, Fujian, China
                                2636442592@qq.com

       Abstract. As a great innovation in virtual currency, bitcoins have the possibil-
       ity to survive perpetually, although they are like gigantic bubbles. However, no
       matter whether bitcoins could survive or not, the technology used by bitcoins
       will exist and develop. There is a great possibility for bitcoins to be served in the
       intending currency, being issued, supported, and controlled by the government.
       Consequently, the research for bitcoins is meaningful. To explore the time rela-
       tionship of bitcoins and give a prediction about the future price based on the given
       data, ARIMA and GARCH models are used in this paper. Although both of the
       two models failed to provide the accurate forecasts at the end of this research, they
       still proved the correlation within time series of bitcoins.

       Keywords: Bitcoin · ARIMA · GARCH · Correlation · Time Series

1 Introduction
Bitcoin is a kind of virtual currency with the method of point to point, and some people
also call it “bitgold”. The concept of the bitcoin is put forward by a person named
“Satoshi Nakamoto”. In 2009, Satoshi Nakamoto issued a software using the imagination
to exchange a kind of electronic currency and named it “BitCoin” simply. BitCoins could
be exchanged to real currencies in most countries. Users could pay for virtual objects
in cyberspace, for instance, the clothes, equipments and privileges in Internet games.
As a result, bitcoins have advantages on their lower cost, rapidity, and anonymity, etc.
[2]. Another thing worth mentioning is that the largest difference between bitcoins and
other currencies is that the aggregate number of bitcoins is limited, which makes bitcoins
scarce. The gross amount of bitcoins has been constrained to 21 million perpetually [5].
And as a super speculation, bitcoins seem to have no impact on some stock markets,
which is unbelievable [9].
     From September 2020 to October 2021, the price of bitcoins has gone through the
roof from 10,000 dollars to 60,000 dollars, and now the price gets relatively stable at
nearly 40,000 dollars. The real appealing point of the bitcoin is its excessively high price.
However, why such a virtual currency that has no promise can value so much, whether
the trend in bitcoins could carry on and how its value will be, the exact answer is difficult
to find according to the pure theory. Therefore, the author explores the answer in virtue
of statistics and financial time series analysis in econometrics. The project assumes that
the price of bitcoins could be evaluated and forecasted by ARIMA and GARCH models.

© The Author(s) 2023
D. Qiu et al. (Eds.): ICBBEM 2022, AHIS 5, pp. 556–569, 2023.
https://doi.org/10.2991/978-94-6463-030-5_56
Time Series Predictive Analysis of Bitcoin Price     557

Using the concrete model to analyze bitcoins is the base of the project, and it is also
being regarded as a blank area after the new boom. In this study, more time characteristics
of bitcoins will be found, thus inspiring more profound research on exploring certain
models that could predict the price of bitcoins based on their time characteristics.

2 Prospect of Bitcoins

IT is hard to believe that bitcoins have a bright future, even if it is a hot topic at present
and the value of one bitcoin is equal to nearly 40,000 dollars. The reasons why the
prospect of bitcoins is not brilliant can be summarized as follows.
     First and foremost, the currencies like bitcoins which cannot be supervised are the
enemy of the government. If such a currency prevailed, the government would lose
control of seigniorage and financial engagements, which would trigger the titanic loss in
fiscal actions and authorities of the government. So before the world had all agreed, the
virtual currency could not be the mainstream of the monetary systems. To say the least,
even if the world had all agreed, its feature of deflating in the long run predetermines
that bitcoins are not suitable to be the fundamental currency.
     What is more, although bitcoins have decentralized in financial network, it is
not immune to the attack. In fact, the bitcoin has been attacked many times, for
example, events about the stealing of bitcoins are frequently reported in the website
(bitcoinpaperwallet.com), and the bitcoins are still in danger of being stolen [4].
     On the top of that, bitcoins are easily substituted by other centerfeints. In fact, the
design of bitcoins is not excellent, which causes the inefficiency of bitcoins [8]. And it
is sure that the bitcoins cannot satisfy the efficient market hypothesis [1]. Hitherto, the
biggest advantage of bitcoins is that there are masses of clients, and this can contribute to
diversification benefits or risk mitigation [10] to a certain extent. However, the advantage
can be easily broken, because it is only required to update the servers, the same as
to update the host. It is foreseeable that later, the servers will receive many kinds of
virtual currencies, just as people of different countries can exchange currencies in banks.
As a consequence, bitcoins are easily taken up. Actually the value of one bitcoin is
overwhelmingly high, an example can be that one only needs to pay 0.00001 bitcoins
for breakfast. It is inimical for the calculations and record, thus another virtual currency
which has a normal value will be more appealing.
     Another thing worth mentioning is that, on account of the resistance from the gov-
ernment, the large market of bitcoins is filled with shadow transactions [3]. In such an
incomplete market with less monitoring, however, bitcoins are prone to be operated by
someone to trigger the fluctuations.
     Last but not least, even if the value of bitcoins could have become stable with little
fluctuations, a currency which is not admitted by the mass society would not survive.
The reason why the currency could become the main currency is from the permission of
society. And the value of bitcoins derives from people’s confidence, without which the
value of bitcoins will plunge.
     In conclusion, it is hard to convince that bitcoins have an optimistic future. However,
it is for sure that the cryptocurrencies like bitcoins will play an important role in society
on account of their advanced technology investment motivation configuration [7].
558     R. Yan

3 Time Series Analysis on Price
3.1 Data Process

3.1.1 Original Data Analysis
The data is from Investing.com, which records the price of bitcoins from July 16th,
2010 to present. To make the study more efficient, the less meaningful part of the data
is abandoned. Eventually, the data from March 5th, 2011 to February 14th, 2022 is
chosen. According to the observations, it is obvious that the difference among the data
is overwhelming. Therefore, taking the log return is an excellent way to modify the data
(see Fig. 1 and Fig. 2).

 Fig. 1. The original data of bitcoin close price from March 5th, 2011 to February 14th, 2022.

                         Fig. 2. The log return of bitcoin close price.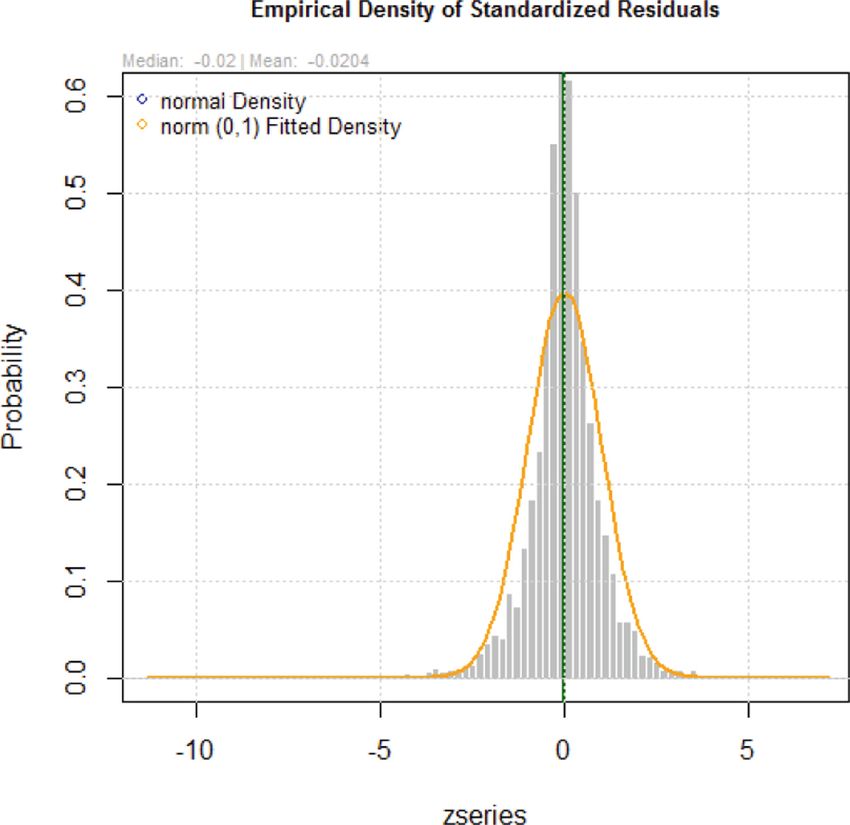
Time Series Predictive Analysis of Bitcoin Price   559

3.1.2 Data Feature Analysis
To comprehend the feature of the data more clearly, the plots of Autocorrelation Function
(ACF) and Partial Autocorrelation Function (PACF) are necessary.
    According to Fig. 3 and Fig. 4, the data is relevant to a great number of data in the
prior periods and the PACF shows a large difference, and the difference is made to offset
the ingredient of trend. As a consequence, the “ndiffs” in R is used to judge the steps of
differences in demand to make the series steady. Afterward, following the result given
by R—“1” to make the first difference and take the Augmented Dickey-Fuller (ADF)
test (Figs. 5 and 6).

                             Fig. 3. The plots of ACF of data.

                            Fig. 4. The plots of PACF of data.
560     R. Yan

                     Fig. 5. Time series after the first order difference.

                       Fig. 6. The ADF test for the the last sequence.

    According to the consequences of the ADF test, the p-value is near to 0, which means
refusing the original hypothesis and recognizing that the sequence is steady.

3.2 ARIMA Model
3.2.1 Establish ARIMA
To get the exact ARIMA model, the auto deference design is used, with which the
ARIMA (3, 1, 2) is chosen to tackle with the data. After that, the white noise tests to the
residual are taken from one to five times. As seen in Fig. 7, it shows that the p-value is
near to 1, which means it will not refuse the original hypothesis, and it recognizes that
the residual sequence belongs to the white noise (there is no dependency between the
residuals and steady). These prove that the sufficient information from the original time
series has been extracted.
    What is more, the Mean Squared Error (MSE) is calculated and it is found that the
MSE is 0.00339881, which means that the model makes an excellent fitting for the fitting
data.

3.2.2 Forecast the Data
The next step is the predetermination for the intended 365 times with the 80% confi-
dence intervals and 95% confidence intervals. Then, exploit the model to draw the plot.
According to Fig. 8, the darker part means the forecast of 80% confidence intervals, and
the shallower part is the expression of 95% confidence intervals. With the plot, it is easy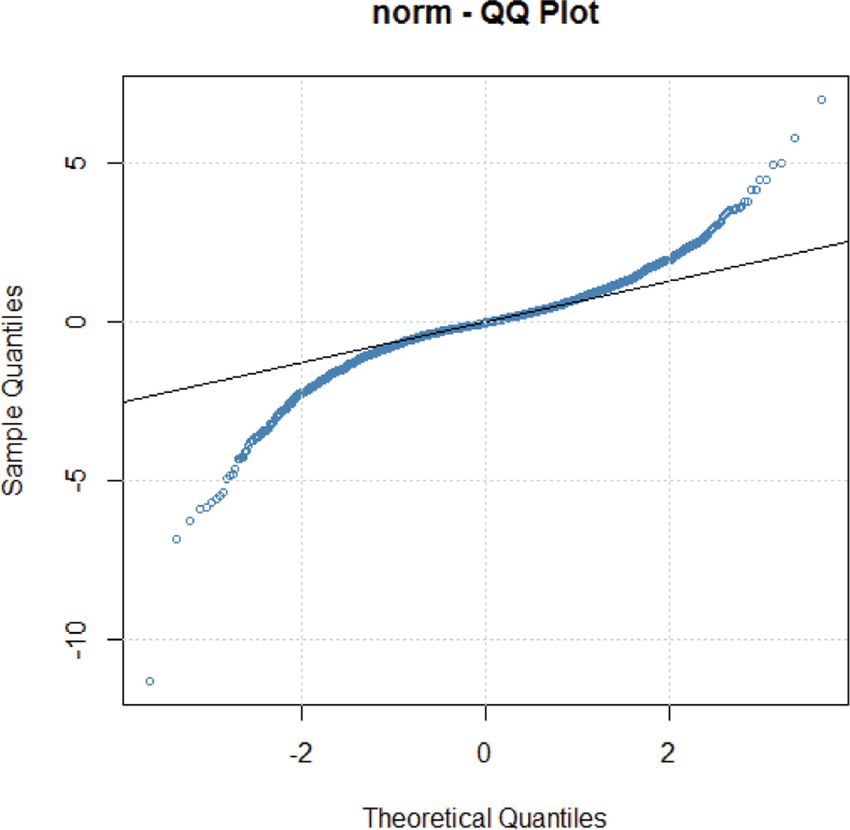
Time Series Predictive Analysis of Bitcoin Price   561

                                Fig. 7. The white noise test.

                      Fig. 8. Forecast from ARIMA (3, 1, 2) with drift.

to find that the range of prediction is overwhelmingly wide even if it is the log of data,
which means that the forecast from ARIMA (3, 1, 2) is less useful.

3.3 GARCH Model

Since the volatility of the stock price shifts with time, there is heteroscedasticity, which
violates the second assumption of the traditional econometric time series analysis: time
series volatility is of the same variance. Therefore, the author attempted to use the
GARCH model to capture the dependence of time series fluctuations on time.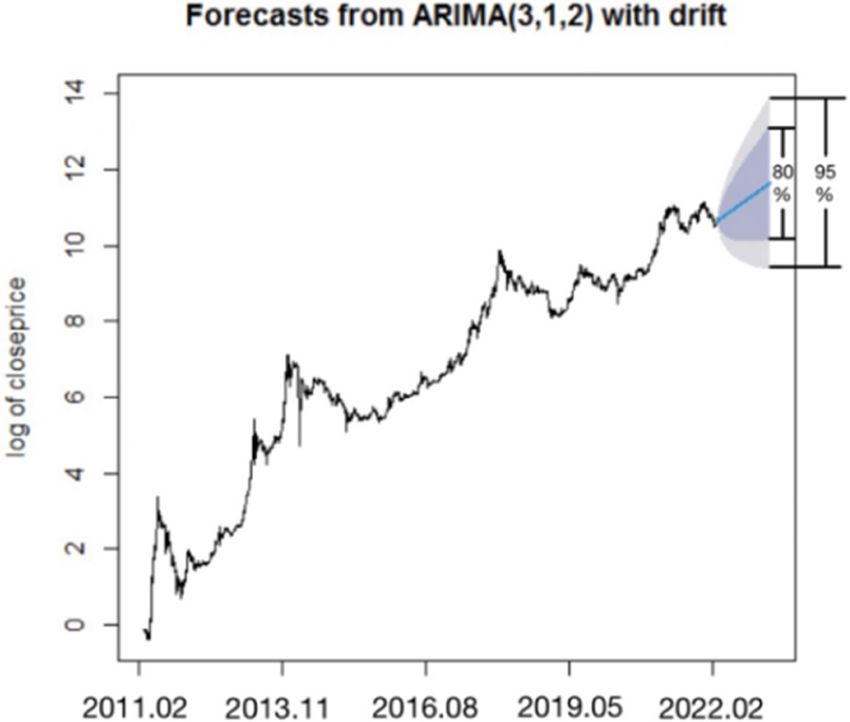
562 R. Yan
3.3.1 Test of Heteroscedasticity
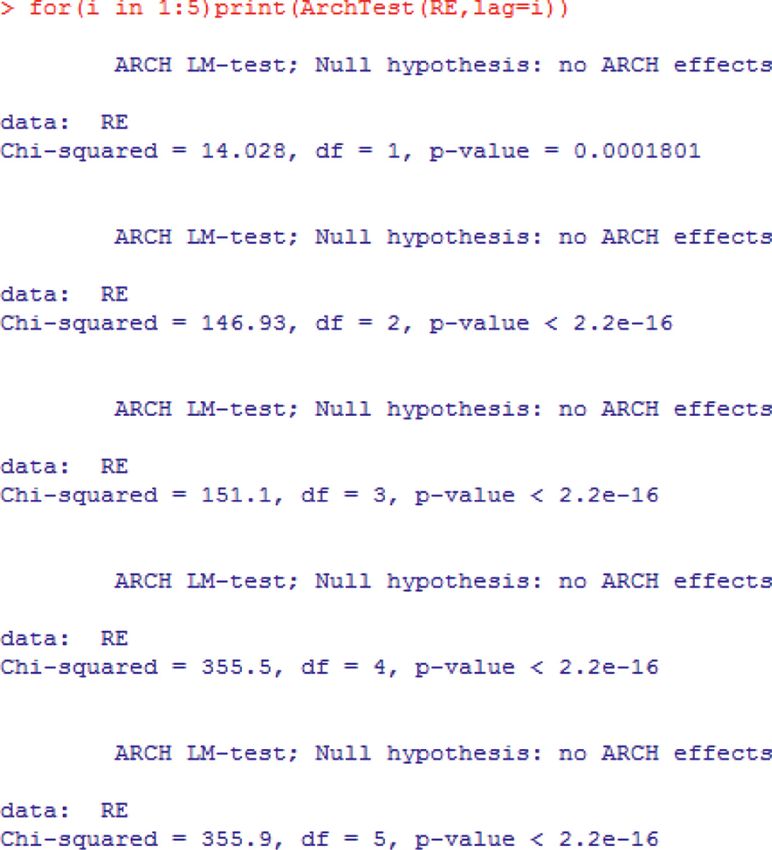
Before establishing the GARCH model, the tests about the series of residuals are in
demand. According to the volatility of the series of residuals and ArchTest, it is needed
to estimate whether there is the heteroscedasticity or not. Then, the Durbin Watson (DW)
test is used to check the autocorrelation in short run.
From the Figs. 9, 10 and 11 showed, the series of residuals is steady but fluctuate to
some extent, which means that the heteroscedasticity may exist. After that, according to
the ArchTest, the p-value is nearly zero, which means rejecting the null hypothesis and
recognizing that there is the heteroscedasticity.
Fig. 9. The figure of residuals.
Fig. 10. The ArchTest.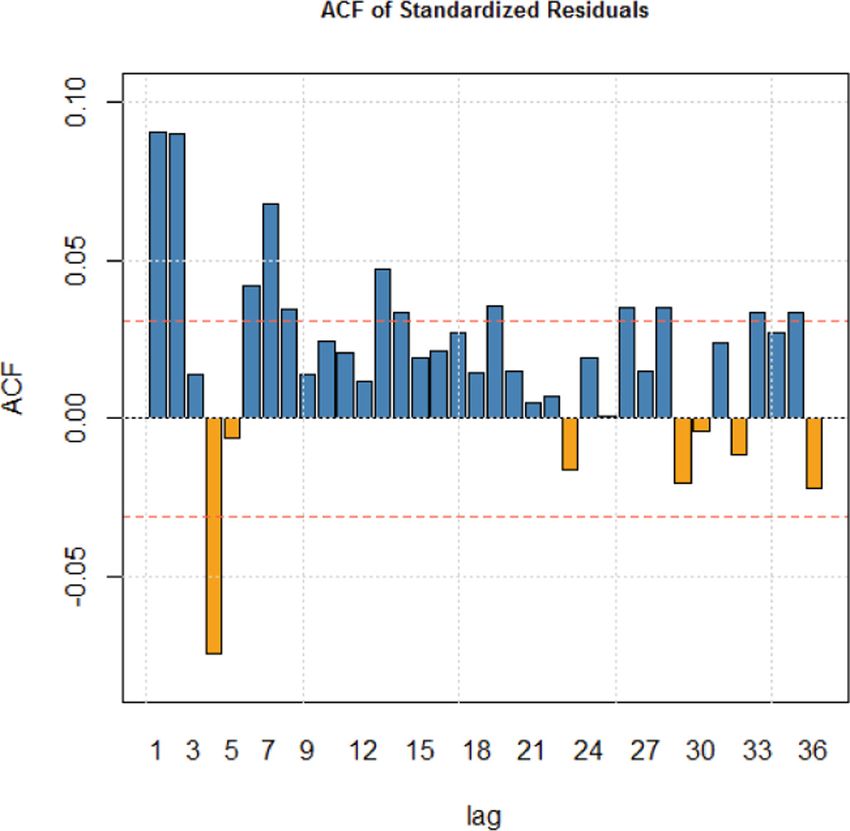
Time Series Predictive Analysis of Bitcoin Price       563

                                      Fig. 11. The DW test.

                          Table 1. The AIC of different GARCH model.

                      P              Q               AIC
                      0              1               −12713.04
                      0              2               −13450.35
                      1              1               −14002.60
                      1              2               −13987.78
                      2              1               −13997.11
                      2              2               −13922.37
                      1              0               −11379.06
                      2              0               −11373.21

                            Fig. 12. The prediction value time series.

   From the DW test, the p-value is over 0.05, which means that it could not reject the
hypothesis that the error is not autocorrelated.

3.3.2 Model Fitting and Checking
To get the accurate parameters for GARCH model, the circulation is used to test the P,
Q for (0, 1), (0, 2), (1, 1), (1, 1), (2, 1), (2, 2), (1, 0), (2, 0), and as it is shown in Table 1,
the Akaike Information Criterion (AIC) reaches minimum when the P equals to 1 and
Q equals to 1.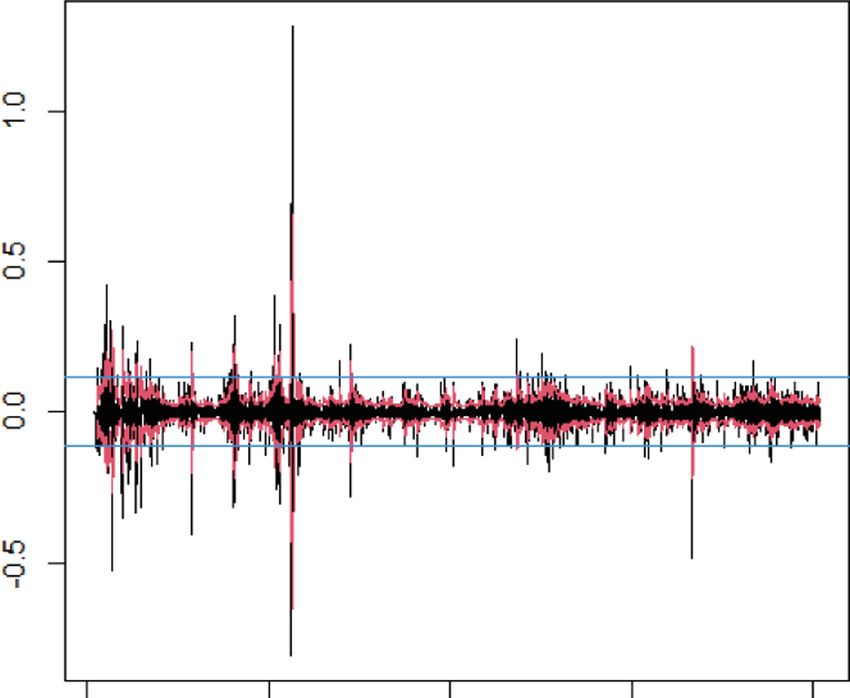
564     R. Yan

 Fig. 13. Residuals, prediction confidence intervals and prediction mean confidence intervals.

                        Fig. 14. The ACF of Standardized Residuals.

    As for the fitting effect, the conditional SD in Fig. 12 is almost close to the maximum
value. Figure 13 shows the time series of predicted residuals. The two pictures show that
the fitting is not excellent, because there are some parts of data exceeding the fitting
curves. To explore more, it is needed to study the derivative of GARCH model.

3.3.3 The Derivate of GARCH Model
According to the “ugarchfit”, the sGARCH (1,1) and ARFIMA (1,0,1) are chosen. As
to the residual correlation, the ACFs of standardized residuals and standardized squared
residuals can be obtained (Fig. 14 and Fig. 15). It can be found that the boundary is
exceeded only at the beginning, and the ACF no longer exceeds the boundary as time
soars. This illustrates that as the time interval becomes larger, the correlation among the
residuals decreases, which meets the requirements.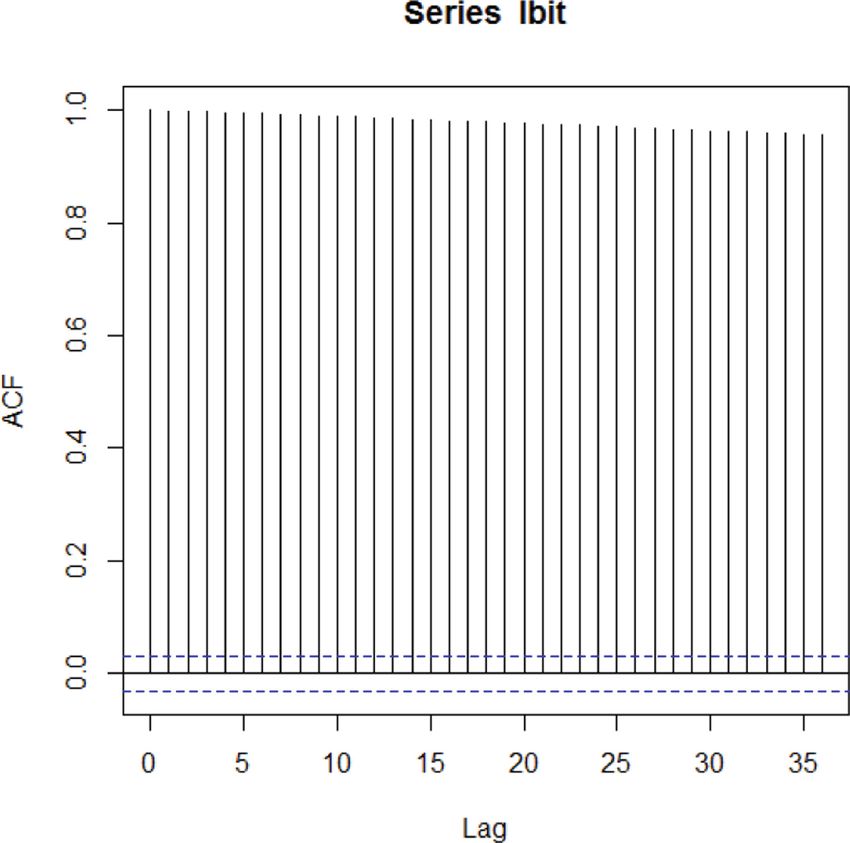
Time Series Predictive Analysis of Bitcoin Price   565

                   Fig. 15. The ACF of Squared Standardized Residuals.

                  Fig. 16. The empirical density of standardized residuals.

    With respect to residual normality, Fig. 16 shows the distribution of standard resid-
uals, which is roughly normally distributed to 0. Figure 17 is a QQ-plot of the standard
residuals, and it is found basically on a straight line, which means that it follows the
same distribution. The above results show the normality of the residuals.
566 R. Yan
Fig. 17. The standardized residual QQ-plot.
Fig. 18. News Impact Curve.
In Fig. 13 the residual line is black, while the confidence interval of its predicted
value and mean lines are red and blue respectively, so it can be seen to roughly matches.
Figure 18 is the news impact curve, which is roughly symmetric about 0, and the absolute
value of the shock increases exponentially, indicating that the bitcoin prices are sensitive
to both negative and positive shocks. Based on Fig. 19, the author tried to use Value at
Risk (VaR) curve which basically wraps the residual time series. In summary, it reveals
that the degree of fitting is still receivable.Time Series Predictive Analysis of Bitcoin Price 567
Fig. 19. Series with 1% VaR limits.
4 Overview and Discussion
In the project, the close price of bitcoins from March 5th, 2011 to February 14th, 2022 is
emphasized. It is meaningful to get more ideas about the price fluctuations of bitcoins,
which could be used to discern the development of such a new virtual currency. After
all, the virtual currency may be the mainstream in the near future and the project could
help to realize, receive or even predict the virtual currency when it happens.
Firstly, the project processed the price and adopted the form of log return to offset
the large difference in the data. Thereafter the first order difference is chosen and the
stability is tested.
Secondly, the data fitted the ARIMA model to the price, and it is found that by using
ARIMA model, it could get a successful forecast for the data in fitting period, while
the prediction for the intended period has the overwhelmingly wind confidence interval,
which is not prefect. Nevertheless, the consequence is receivable for us. If the forecasts
about the price of bitcoins could be gotten within such an easy endeavor, the research
would have been done many times. Fortunately, the prediction also gives a trend, which
could be taken into account as some success.
Since the stock prices for the most part have the characteristic of heteroscedastic-
ity, the project tested the heteroscedasticity. Therefore, the GARCH model is fitted to
capture the dependence of the residuals on time. The result is a success in the following
dimensions. (1) The GARCH (1,1) model remains independent of the correlation of the
residuals; (2) the normality of the residuals verifies that the residuals obey the same
distribution and are roughly normally distributed; (3) in regard to the fitting effect, the
project verifies that the confidence interval of the predicted value basically includes the
actual value, and as the bitcoin price is sensitive to shocks, the VaR curve which basically
includes the value is also adopted.568 R. Yan
5 Conclusion
To sum up, according to the study, using the ARIMA or GARCH model to fit the given
data is easy and successful. But when it comes to the prediction, the consequences are
less satisfactory. The considerably large section is got, which means it is impossible to
get much useful information for the price of bitcoins in the future. However, it does not
mean there is no models that could do the forecast successfully [6]. On the contrary, the
author believes that there must be one model which could finish the prediction of the
bitcoin price accurately. After all, people will give their own price for bitcoins based
on their evaluation, and the evaluation depends on the price of bitcoins in the past and
the situation of change, which means that the data in the past must lead the price in
the future. Future research can focus on exploring some models that could get rid of
abnormal change in the absolutely suitable and right way so that they could foresee the
price of bitcoins tomorrow substantially.
References
1. Urquhart, “The inefficiency of Bitcoin,” Economics Letters, 2016, pp. 80–82, doi: https://doi.
org/10.1016/j.econlet.2016.09.019.
2. Segendorf, “What is bitcoin,” Sevriges Riksbank Economic Review 2014, 2014, pp. 2–71.
3. G. Watt, S. Watt, “The Worlds of John Wick: The Year’s Work at the Continental Hotel,”
Indiana University Press, 2022, pp.146–168, ISBN: 978-0-253-06240-6.
4. Bradbury, “The problem with Bitcoin,” Computer Fraud & Security, vol. 2013, no. 11, 2013,
pp. 5–8, doi: https://doi.org/10.1016/S1361-3723(13)70101-5.
5. Velde, “Bitcoin: A primer,” Chicago Fed Letter, no. 317, Dec. 2013.
6. J. D. Hamilton, “Time series analysis,” Princeton University Press, 2020, ISBN-13: 978-0-
691-04289-3.
7. J. Mattke, C. Maier, L. Reis, T. Weitzel, “Bitcoin investment: a mixed methods study of
investment motivations,” Taylor & Francis, 2021, doi: https://doi.org/10.1080/0960085X.
2020.1787109
8. S. Nadarajah, J. Chu, “On the inefficiency of Bitcoin. Economics Letters,” 2017, pp. 6–9, doi:
https://doi.org/10.1016/j.econlet.2016.10.033.
9. V. C. Nguyen, “The impact of the COVID-19 Pandemic and Cryptocurrency Price on the
Stock Exchange Index-Evidence from Shanghai Stock Exchange,” VNU Journal of Science:
Economics and Business, [S.I.], vol. 38, no. 1, Feb. 2022, ISSN 2588-1108.
10. Y. Y. Huang, K. Duan, T. Mishra, “Is Bitcoin really more than a diversifier? A pre-and post-
COVID-19 analysis,” Finance Research Letters, 2021, doi: https://doi.org/10.1016/j.frl.2021.
102016Time Series Predictive Analysis of Bitcoin Price 569
Open Access This chapter is licensed under the terms of the Creative Commons Attribution-
NonCommercial 4.0 International License (http://creativecommons.org/licenses/by-nc/4.0/),
which permits any noncommercial use, sharing, adaptation, distribution and reproduction in any
medium or format, as long as you give appropriate credit to the original author(s) and the source,
provide a link to the Creative Commons license and indicate if changes were made.
The images or other third party material in this chapter are included in the chapter’s Creative
Commons license, unless indicated otherwise in a credit line to the material. If material is not
included in the chapter’s Creative Commons license and your intended use is not permitted by
statutory regulation or exceeds the permitted use, you will need to obtain permission directly from
the copyright holder.You can also read