Towards Bottom-Up Analysis of Social Food
←
→
Page content transcription
If your browser does not render page correctly, please read the page content below
Towards Bottom-Up Analysis of Social Food

                                                                                   Jaclyn Rich, Hamed Haddadi, Timothy M. Hospedales
                                                                                          School of Electronic Engineering and Computer Science
                                                                                                     Queen Mary University of London
arXiv:1603.04497v1 [cs.CY] 14 Mar 2016

                                         ABSTRACT                                                                                        a maximum of 30 hashtags to be attributed to a post. In-
                                         Social media provide a wealth of information for research                                       stagram also allows the user to geo-tag, or assign a geo-
                                         into public health by providing a rich mix of personal data,                                    graphical location, or point of interest to, their individual
                                         location, hashtags, and social network information. Among                                       images. Since its inception in October 2010, Instagram has
                                         these, Instagram has been recently the subject of many com-                                     grown to over 500 million monthly users, and an average
                                         putational social science studies. However despite Insta-                                       of 70 million photos uploaded daily; the rise in Instagram’s
                                         gram’s focus on image sharing, most studies have exclusively                                    popularity can be partially attributed to the rise in the us-
                                         focused on the hashtag and social network structure. In this                                    age of smartphones and the high quality cameras contained
                                         paper we perform the first large scale content analysis of                                      within them.
                                         Instagram posts, addressing both the image and the associ-                                         Food is an important part of all cultures. As individuals
                                         ated hashtags, aiming to understand the content of partially-                                   social interactions have moved more towards being digital,
                                         labelled images taken in-the-wild and the relationship with                                     their way of communicating about food has too. Document-
                                         hashtags that individuals use as noisy labels. In particular,                                   ing food intake has become a phenomenon, to the point of
                                         we explore the possibility of learning to recognise food image                                  inspiring parody. One such lampoon, “Eat It Don’t Tweet It
                                         content in a data driven way, discovering both the categories                                   (The Food Porn Anthem)” contains the lyrics, “its unthink-
                                         of food, and how to recognise them, purely from social net-                                     able to dine out and not record it”, which does not strike
                                         work data. Notably, we demonstrate that our approach to                                         too far from the truth for many social media users.1 Moti-
                                         food recognition can often achieve accuracies greater than                                      vations for documenting one’s consumption on social media
                                         70% in recognising popular food-related image categories,                                       include the desire to share their healthy habits and their in-
                                         despite using no manual annotation. We highlight the cur-                                       dulgences.2 Analysis of food images on Instagram can lead
                                         rent capabilities and future challenges and opportunities for                                   to further understanding of food from health, cultural, or
                                         such data-driven analysis of image content and the relation                                     marketing perspectives. Improving the world’s health is of
                                         to hashtags.                                                                                    the utmost importance, as 30% of the global population is
                                                                                                                                         overweight or obese. Urban areas are those that are seeing
                                                                                                                                         the greatest increase in obesity. These regions are also those
                                         Keywords                                                                                        that have the highest usage of Instagram, making them both
                                         Social Media; Instagram; Machine Learning; Image Recog-                                         the most in need of and accessible for intervention [11].
                                         nition                                                                                             Understanding nutritional content of our food is integral
                                                                                                                                         to good health. Many health programs take this a step
                                                                                                                                         further by requiring its participants to track and possibly
                                         1.      INTRODUCTION                                                                            record the nutritional information of the food and drink they
                                            Social networking has become a mainstay of modern life;                                      ingest. This is often done by manually entering each food
                                         79% of all online adults use at least one social media site [7].                                item. Consequently, an accurate and simple way of counting
                                         Usage of Instagram, especially, has become increasingly wide-                                   calories is important to guide and inform individuals food
                                         spread. Instagram is a social networking mobile phone ap-                                       choices. Additionally, work by Zepeda and Deal [22] found
                                         plication that allows users to upload and share photos and                                      that photographic food diaries were more effective than writ-
                                         videos. Using hashtags to describe one’s posts allows the                                       ten ones at prompting patients to truly understand their eat-
                                         user to attach sentimental or contextual information to the                                     ing habits and spur a change in their behaviour. Keeping
                                         pictures that appear on their timeline; Instagram permits                                       a visual food diary that also instantly provides nutritional
                                                                                                                                         content could make for a powerful approach to weight-loss.
                                         Permission to make digital or hard copies of all or part of this work for personal or
                                         classroom use is granted without fee provided that copies are not made or distributed
                                                                                                                                         Furthermore, Instagram food images will provide a more ac-
                                         for profit or commercial advantage and that copies bear this notice and the full citation       curate portrayal of people’s eating habits than self-reporting.
                                         on the first page. Copyrights for components of this work owned by others than the
                                         author(s) must be honored. Abstracting with credit is permitted. To copy otherwise, or
                                                                                                                                         1
                                         republish, to post on servers or to redistribute to lists, requires prior specific permission     Eat It Don’t Tweet It (Instagram Food Porn Anthem)
                                         and/or a fee. Request permissions from permissions@acm.org.                                     https://www.youtube.com/watch?t=93&v=WpNIt6UC8uo
                                         DH ’16, April 11 - 13, 2016, Montréal, QC, Canada                                               [Video file last accessed November 2015]
                                                                                                                                         2
                                          c 2016 Copyright held by the owner/author(s). Publication rights licensed to ACM.                10 Reasons Why People Post Food Pictures on Facebook,
                                         ISBN 978-1-4503-4224-7/16/04. . . $15.00                                                        available on https://www.psychologytoday.com [retrieved
                                         DOI: http://dx.doi.org/10.1145/2896338.2897734                                                  31 July 2015]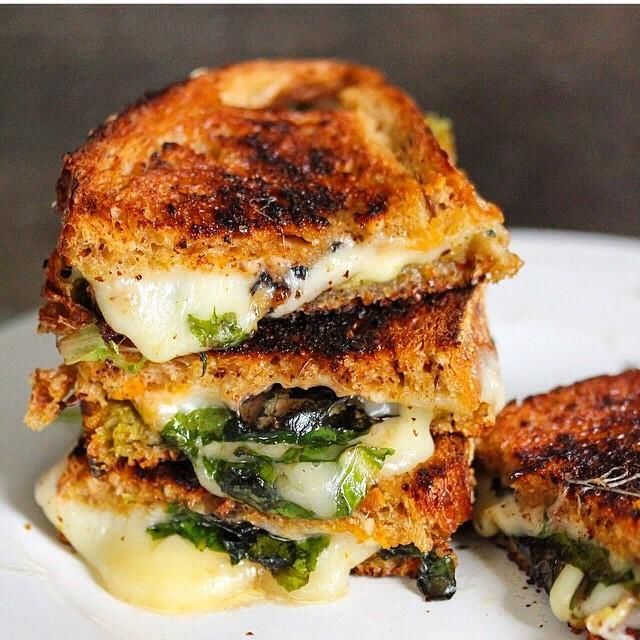
When self-reporting, teenagers tended overestimate to their        2.2    Instagram users’ behaviour
intake, while adults tended to underestimate [3].                     Instagram is a relatively young social media site, and
  Creating a means of recognising foods is one of the first        hence has not attracted as much research as its more es-
steps in creating accurate automated calorie intake counting       tablished counterparts. Primary research focused broadly
applications, e.g., using pictures of meals taken by an indi-      on user practices. Hu et al. [11] performed one of the first
vidual during their day. Previous works have mostly focused        studies using Instagram data and identified eight image con-
on use of hashtags and keywords for understanding calorie          tent categories, with the first six being the most popular:
value of image contents. Using classifiers trained bottom-up       selfies, friends, activities, captioned photos (pictures with
on images labelled with hashtags would be both more scal-          embedded text), food, gadgets, fashion, and pets.
able, and less biased than having to manually define food             Using keyword-based calorie lookup tables, Sharma and
ontologies and label the content of images.                        De Choudhury [19] analysed a dataset of Instagram posts
  In this paper we perform a joint analysis of Instagram           that contained food-related tags. They were able extract
hashtags and images, in order to: (i) reveal the limitations of    nutritional content for 93.5% of Instagram posts in their
conventional non-visual tag-centric analyses of social media,      dataset by associating each hashtag with a food item and
and (ii) explore to what extent these can be addressed by          retrieving its nutritional information in the USDA National
further analysing image content. We look at Instagram im-          Nutrient Database. Using crowdsourced verification, they
age content using visual recognition techniques. Differently       were found to be 89% accurate in their calorie estimations.
to the conventional approach of defining a food category on-       They used these findings in conjunction with feedback from
tology and curating an associated database to train visual         Instagram users, and found that moderately caloric foods
recognisers; we explore the possibility of hashtags themselves     (150 - 300) attracted the most likes and comments. The
being considered “visual”. This was accomplished through           authors recognised the value of future works incorporating
the creation of a series of hashtag classifiers to ascertain how   image analysis into this area of study.
visually recognisable the user-generated tags are. We con-            Mejova et al. [16] analysed a large dataset of food images
trast the results obtained with those using ImageNet [6]3          posted on Instagram from Foursquare restaurant locations.
as the object ontology to recognise. Moreover, we investi-         They identified the most popular foods that spurred the use
gated the cultural differences in documented food across the       of the #foodporn hashtag across the United States. They
globe by analysing the data from a spatial perspective. The        found that images of Asian cuisine were the most likely to be
correlations between different visual tags were also deter-        tagged with #foodporn; cuisine from slow food restaurants,
mined. We also extensively discuss the practical challenges        as compared with fast food establishments, was also more
in accomplishing these tasks including computational those         likely to be tagged as such. In the health arena, they first in-
induced by label-noise.                                            vestigated the correlation between the check-ins at fast food
                                                                   restaurants on Foursquare in a county, to the percentage of
2.     RELATED WORK                                                the county population that is obese; they found a Pearson
                                                                   correlation of 0.424. Hashtags that had high prominence in
                                                                   counties with high obesity, such as #ilovesharingfood, and
2.1      Food in Social Media                                      low obesity, such as #smallbiz, were also identified.
   Fried et al. [10] demonstrated “the predictive power of
the language of food” through the analysis of a large corpus       2.3    Image recognition on food
of tweets. They only retrieved tweets that contained meal-            Research and industry have started using Machine Learn-
related hashtags: dinner, breakfast, lunch, brunch, snack,         ing (and specifically Deep Learning) for object and scene
meal, and supper. They further filtered these tweets to find       recognition tasks.4 Kawano and Yanai [12] developed clas-
mentions of food and used the term frequency-inverse doc-          sifiers to recognise types of food from images using various
ument frequency (TF-IDF) of these mentions to recognise            features. Their experiments revealed that using Deep Con-
uniquely characteristic foods for each state. While some           volutional Neural Networks (DCNN) along with RootHoG
of these representative foods confirmed already held under-        patches and colour patches coded into a Fisher Vector repre-
standings of state food preferences, such as Texas’ affinity for   sentation had the best performance of 72.26% classification
brisket and the South’s for grits, some like North Dakota’s        accuracy. When used separately, the DCCN outperformed
association with flan were more surprising.                        all of the other features. They further developed a mo-
   Abbar et al. [1] explored the relationship between the calo-    bile application for Android called FoodCam that recognises
ries in the food tweeted by users in a state with the state’s      food items from images and provides nutritional information
obesity and diabetes rate. They discovered a Pearson corre-        in real-time. They achieved 79.2% classification accuracy
lation of 0.772 with obesity and 0.658 with diabetes. On av-       for the top five category candidates. Although they previ-
erage, women and residents of urban areas tweet about food         ously explored using DCNN, here they used a histogram of
with fewer calories than men and their rural counterparts.         oriented gradients patch descriptor and a colour patch de-
Tweets from urban areas are also characterised by greater          scriptor with a Fisher Vector representation so that it could
mentions of alcoholic beverages and such foods as avocado          run on a mobile phone. Linear SVMs were used as the clas-
and crab. In contrast, tweets from rural areas are concerned       sifier. The system asks the user to draw a bounding box
with more conventional fare, such as pizza, chocolate, and         around the food, and proposes the five most likely foods
ice cream.                                                         that it could be from which the user can select one. Never-
                                                                   theless, this more conventional approach has key limitations:
                                                                   4
                                                                    http://yahoohadoop.tumblr.com/post/129872361846/
                                                                   large-scale-distributed-deep-learning-on-hadoop?soc src=
3
    http://www.image-net.org/                                      mail&soc trk=ma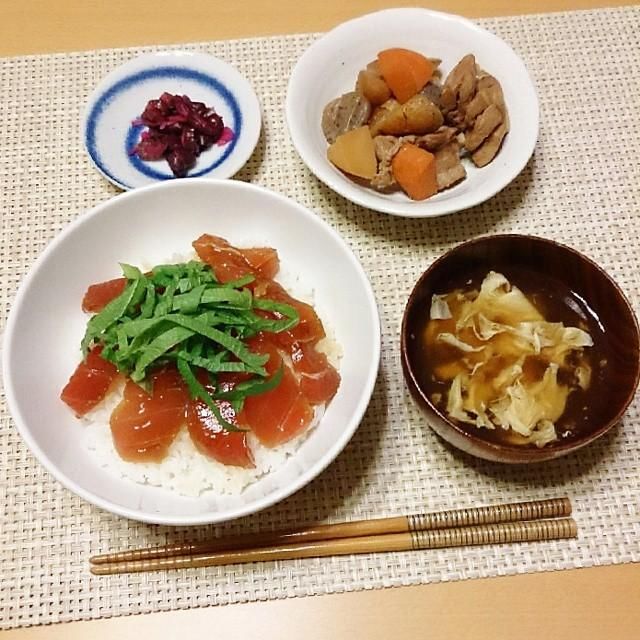
3.1    Dataset
 Table 1: Most Frequent Hashtags in the Dataset.
                 Rank Hashtag                                        We used the Instagram API5 to download images with
                 1     food                                       food-related tags on during two different periods, autumn/winter
                 2     foodporn                                   of 2014 (first and fourth week of October, all four weeks
                 3     instafood                                  of November, first week of December) and spring of 2015
                 4     yummy                                      (third and fourth week of March). We also collect the as-
                 5     delicious                                  sociated metadata, such as the number of likes, comments,
                 6     foodie                                     captions, GPS location, and hashtags. The data set is com-
                 7     instagood                                  prised of a total of 808,964 images and their corresponding
                 8     yum                                        metadata. We crawled the images and data for the 43 most
                 9     foodgasm                                   popular food-related hashtags as identified by Mejova et
                 10    dinner                                     al. [16]. These tags include the likes of #foodporn, #yum,
                                                                  #foodie, #instafood, #lunch, #delicious, #foodgasm, etc.
                                                                  We also crawled the the 53 most popular hashtags of specific
                                                                  food items which include tags like #fpizza, #rice, #muffin,
It requires pre-specification of the food categories to be de-    #pasta, #chicken, #donut, #steak, #sushi, #kebab. The
tected, and manual collection and annotation of images of         ranking of most popular hashtags in the collected dataset is
these categories in order to train detection models. This         presented in Table 1. We did not apply any pre-filtering to
means that (i) It is not scalable to very many categories of      our data in order to avoid introducing biases.6
food due to the barrier of manually collecting and annotat-
ing images of each and (ii) Such a top-down driven approach       3.2    Parsing of the Image Metadata
only recognises the pre-specified food ontology, which may          Analysing these images with state of the art computer
not completely overlap the particular categories that people      vision techniques, we wish to answer the following questions:
pervasively eat and share on social media.
   In related research, CNNs are used for detection of spe-           • How many of these images are food-related at all?
cific classes of fruits and vegetables from ImageNet, with an
accuracy of 45-75% for the top categories [9]. The results            • How many pictures have images that are indeed rele-
were reported to be highly affected by the quality of the im-           vant to their hashtag?
ages and the number of objects in each image. This work
                                                                      • Of the tags associated with these images, how many
was limited to carefully labeled images of specific categories.
                                                                        and which of them are visual ; in the sense that they
In this paper, we use Instagram pictures in order to assess
                                                                        correspond to a visible object (such as plate), rather
the ability to perform such analysis on pictures taken by
                                                                        than a non-visual concept (such as a good night out).
individuals in natural settings.
                                                                      • And what can visual analysis of Instagram posts tell
2.4    Limitations                                                      us beyond standard tag-based analyses.
   While these studies provide useful insights about people’s
food consumption habits, they are limited in their scope.         3.3    Feature Extraction
Data from Foursquare and Yelp are limited in that they only          A total of three different features were extracted during
contain information and images of food or drinks prepared         the preliminary experimentation phase. First, the GIST de-
at restaurants. The food images from Instagram can include        scriptor, having 512 dimensions, was extracted. The GIST
home cooked meals, packaged foods, ingredients, etc. In ad-       feature is a low dimensional representation of an image re-
dition, Foursquare’s community of 55 million is also much         gion and has been shown to achieve good performance for the
smaller than Instagram’s 400 million. There is also much          scene recognition task when applied to an entire image [17].
work to be done to create accurate calorie count databases        Classification using this low dimensional descriptor yielded
from images. In Sharma and De Choudhury’s work, they              results that were not at all or not much better than random.
claimed 89% accuracy in predicting calorie content. Yet in        This led to the decision to use a higher dimensional feature.
one of the analysed posts, the mentioning of the “Ultimate           The second and third features used are from pre-trained
Red Velvet Cheesecake” from The Cheesecake Factory, was           convolutional neural networks (CNNs). CNNs were chosen
simplified to cheesecake. While on average a slice of cheese-     since they achieve state of the art results for general im-
cake may contain the predicted 402 calories, according to         age category recognition [20]. The CNNs used were imple-
MyFitnessPal, a slice of this specific cheesecake has 1,250       mented using the MatConvNet toolbox.7 These are namely
(“Calories in the Cheesecake”). This further illustrates how      imagenet-vgg-f and imagenet-vgg-verydeep-16, the latter a
the rich diversity of food categories worth recognising easily    CNN with 16 layers [20]. The 16-layer very deep model was
goes beyond common pre-specified top-down ontologies as           selected for our work as it had higher precision than the
highlighted earlier.                                              other in preliminary experiments.
                                                                     The CNN provides two capabilities, and we use both: (i)
                                                                  Its final layer provides a probability of how likely it is to be
3.    A CASE STUDY ON FOOD                                        belong to each of the 1,000 classes in ImageNet [6], as well
  In this paper, we analyse food images takes on Instagram        as a final classification into the most likely class. ImageNet
for content. We use a large corpus of data from Instagram,        5
in addition to labeled data form ImageNet for testing and           https://instagram.com/developer/
                                                                  6
training our classifiers.                                           We are making our image dataset available with this paper
                                                                  via http://www.eecs.qmul.ac.uk/˜tmh/downloads.html
                                                                  7
                                                                    http://www.vlfeat.org/matconvnet/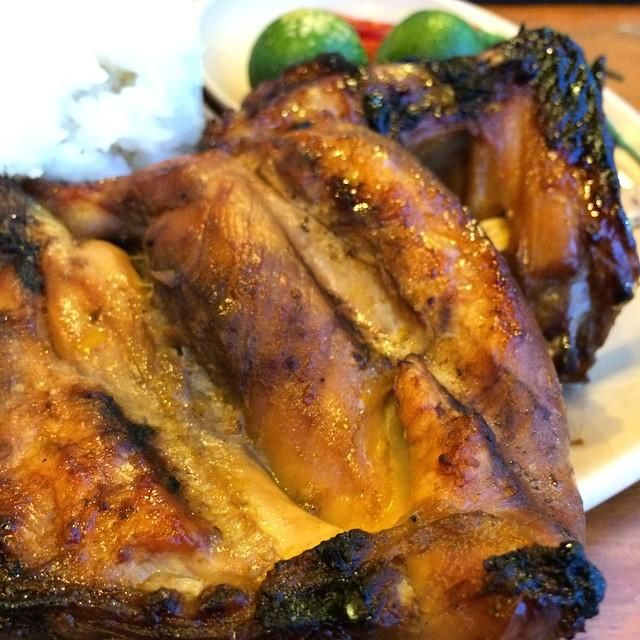
is&clear&from&this&map&users&posted&images&from&almost&all&of&Europe&and&most&areas&in&

the&United&States.& & In&Asia,&South&America,&and&Australia,&the&highest&density&of&posts&

lies&in&costal&areas.& &

&
&
                                                                                                be retrieved. Out of 808,964 posts in our dataset, 315,806
                                                                                                of them (i.e.,39%) were geotagged. Out of the total of these
&                                                                                               315,806 geotagged posts, 301,234 were successfully reverse
                                                                                                geocoded. Majority (3̃0 %) of the geocoded posts were, in
                                                                                                decreasing order, from Asia, Europe, and North America.
                                                                                                In terms of countries, United States, Australia, Italy, and
                                                                                                the UK had the most frequent geotagged posts. Figure 1
                                                                                                displays the map of our geotagged posts.

                                                                                                4.   HOW NOISY ARE INSTAGRAM FOOD
                                                                                                     TAGS?
                     Figure&3.1:&Map&of&all&geotagged&posts&in&the&dataset.&
Figure 1: Map of all geotagged posts in the dataset                                                Since Instagram Tags are user generated, there is the ques-
                                                                                                tion of to what extent the food-related tags we have crawled,
                                                                                        ! 19!   and are interested in studying, actually correspond to food-
is a database of images built upon the nouns of WordNet, a                                      images? Some tags might appear to refer to foods, but actu-
lexical database of the English language. It contains over 500                                  ally represent Internet vernacular, and thus the image could
images for each of over 1,000 categories. (ii) Its penultimate                                  represent anything. Other tags might refer to foods, but
layer also provides a 4,096 dimensional feature vector, which                                   the associated image reflect some other aspect of the din-
serves as a powerful image representation for learning to                                       ing experience such as menu or people. Social media posts
recognise new classes outside of those covered by ImageNet.                                     are often used for understanding food consumption and culi-
                                                                                                nary interests across the world and correlations with obesity
3.4       Classification Model                                                                  and other health conditions. The reasons we want to know
                                                                                                about tag-image content correspondence are two-fold: (i)
   The hashtag classification was performed using the Sup-
                                                                                                Because previous work has used food-related tags or key-
port Vector Machines (SVM). During our initial exploratory
                                                                                                words as an indicator of actual food consumed [16]. Quan-
experimentation phase, both linear and radial basis func-
                                                                                                tifying the prevalence of food-tags on non-food images may
tion kernels for SVM were applied. The linear classifier per-
                                                                                                indicate something about the expected noise level in such
formed better (up to 5%) in all trials. For this reason and
                                                                                                studies. (ii) Because it will shed some light on the amount
due to its much lower computation cost, the linear kernel
                                                                                                of noise in tag-image correspondence, and hence how well
was chosen for experimentation using the entire dataset. In
                                                                                                we can expect to learn from the tags later on.
our main experiments, we used the liblinear [8] primal SVM
optimiser due to its suitability for the large scale data ex-                                   What Proportion of Food-Tagged Images Actually
plored here.                                                                                    Contain Food? Since evaluating the accuracy of user‘s
   The principle behind SVM classification is that the opti-                                    tagging manually is implausible for a dataset of this size,
mal decision boundary is the one that maximises the margin                                      we resort to automated approximation. In the first experi-
between the boundary and the data points that are closest                                       ment, we address this question in a coarse way by finding out
to it (the support vectors) and minimises misclassification                                     the proportion of food-tagged Instagram images (all of our
errors. Additionally, during the small-scale experiments, 10-                                   dataset) that actually correspond to (any kind of) food, and
fold cross validation was used to set the cost parameter. This                                  the proportion that do not correspond to any kind of fond.
greatly increased computation time, and therefore was not                                       The state of the art CNN (VGG [20]) we use to analyse im-
used during the final training phase over the entire dataset.                                   ages is trained on the ImageNet library which covers 1,000
In future iterations in this space, this approach could be em-                                  classes, 61 of which are food related. Based on the CNN out-
ployed to attempt to improve upon the results found in this                                     put, we can estimate upper and lower bounds of the amount
paper.                                                                                          of actual food and non-food images in the dataset. To esti-
                                                                                                mate the lower-bound on true food images, we count those
3.5       Reverse Geocoding                                                                     images confidently8 classified as one of the food types, and
   Reverse geocoding is the process of converting longitude                                     also those images confidently classified as one of the food
and latitude coordinates to an address. Our interest was                                        containers (6 categories including plate, bowl, etc) that Im-
in obtaining the country and continent information only. A                                      ageNet recognises, since the classifier often recognises the
post may contain an Instagram location that corresponds                                         container more confidently than the food. To estimate the
to a location on Foursquare, latitude and longitude, or no                                      upper bound on true food images, we count those images
location data. Once location data was extracted from each                                       confidently classified as one of the 933 (1000-61-6) categories
metadata structure, the sp, maps, rworldmap, and rworldx-                                       which are neither food nor food-container related.
tra packages in R were used to project the GPS coordinates                                         Figure 2 shows the distribution of the top-50 most com-
onto a map and report the country and continent of the                                          mon and confidently recognised categories, coloured accord-
projection. The country and continent were recorded in                                          ing to food-related (red) and non-food-related (blue). By
the metadata structure for each entry with location data.                                       this measure, the total proportion of food images to all is
While the country and continent were obtained successfully                                      around 19%, and the proportion of non-food images is 11%.
for most of those posts with location data, costal locations                                    These figures thus provide a rough lower and upper bound
were frequently not identified as they were frequently mis-                                     (19-89%) for the amount of actually food-related data on
taken for lying in bodies of water. The GoogleMaps API                                          Instagram when crawling food tags. Figure 3 illustrates the
was then used on these unidentified costal points to min-                                       8
                                                                                                  Defined as above 0.5 posterior – a conservative threshold
imise the number of points for which an address could not                                       since the posterior is normalised over 1,000 categories.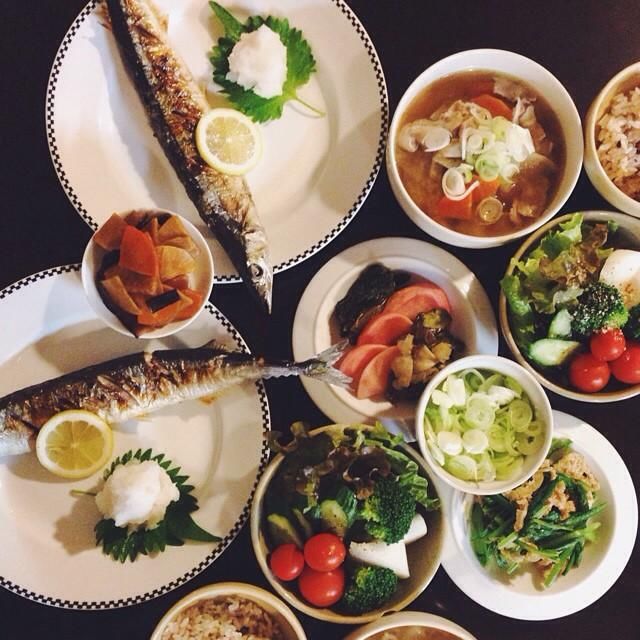
Histogram of Recognised Object Categories
35
30
Frequency (1000s)
25
20
15
10
5
0
0 10 20 30 40 50
Figure 4: Visualness of the top-1000 hashtags.
Category Index
Sorted by our manual expected categorisation: red –
concrete food, green – non-food, blue – food-related.
Figure 2: Food (red) and non-food (blue) dataset
category distribution (top 50), as recognised by VG-
Gnet [20] lier, that approach is limited in scalability (need to collect
and annotate data for every category to recognise), and top-
Common non-food categories Common food categories
0.6 0.4 down bias of ontology selection. In this section, we explore
0.3
an alternative approach of discovering visual concepts au-
0.4
tomatically tags, thus avoiding the scalability barrier and
0.2
0.2
ontology selection bias intrinsic to earlier work.
0.1
0 0 5.1 Discovering Visual Food Tags
pizza
plate
menu
candle
packet
website
burrito
envelope
icecream
hair slide
meatloaf
carbonara
comic book
baked goods
face powder
book jacket
restaurant
cheeseburger
pill bottle
chocolate syrup
The first question we ask is which tags correspond to vi-
sual concepts (like hamburger, plate, table) – and thus pro-
vide a potential route to automatically learning to recognise
foods or other content in images; and which tags correspond
to (presumably) abstract non-visual tags such as user emo-
Figure 3: Commonly found food-related (right) and
tions (#hygge), or abstract concepts (#instagood), etc. To
non-food-related (left) categories among VGGnet
investigate this we take the approach of going through each
[20] confidently recognised categories
tag and attempting to train a classifier for it. This approach
has been used before [2, 13, 4], but never at this scale or fo-
cus on food. The score of each classifier on a test split of the
most commonly found food and non-food categories in the
data reflects the tags visualness; i.e., there may be no visual
dataset. Websites and menus are by far the most common
regularity in photos tagged with #instagood, hence the test
non-food images that are presented with food-related tags.
score will be low. But there may be high visual correlation
It is easy to understand the reasons behind users posting
between the tag #salad and associated photos so the score
menu photos with food-related tags, though the reason for a
may be higher. Specifically, we take the top 1,000 most com-
high number of website screenshots is not immediately clear.
mon tags and train a classifier for each. This is a large scale
Naturally these results are contingent on the reliability
operation that took about 2 Xenon E5 CPU-weeks.
of the VGG CNN recogniser. However, the majority of
the highly confidently classified images used to generate the Which Tags have Visual Correlates? Before focus-
above are correctly classified, when checked manually. By ing on food-specific results, we explore the overall visual-
lowering the confidence threshold used, we could make the ness results across the entire top-1000 hashtag dictionary.
bound tighter, but as the VGG recognisers would be mak- To break down these results, we manually classified each
ing more errors at this point, we would also be less confident of the top 1,000 hashtags according to whether the associ-
about its correctness at each end. ated concept was: (i) A concrete food object: a noun rep-
resenting a physical food object that can be pictured, such
as hamburger/salad/cappuccino. Once detected, such con-
5. EXPLOITING BOTTOM-UP VISION crete objects can provide the input to calorie counting [12,
In the previous set of experiments, we used the state of the 16, 19], etc. (ii) More abstract food-related terms that are
art VGG-CNN to recognise categories in InstagramPosts. not specific objects, such as categories (breakfast/dinner or
This followed the conventional pipeline [12] of pre-specifying chinesefood/koreanfood) or attributes (healthy/highcarbs).
an ontology and obtaining curated and annotated data (e.g., Although not specific food objects, these may still be of in-
ImageNet), and using this data to train a recogniser for cat- terest for digital health researchers. (iii) Non-food related
egories in this ontology (e.g., VGG-CNN). As outlined ear- terms. We expected that the concrete food objects would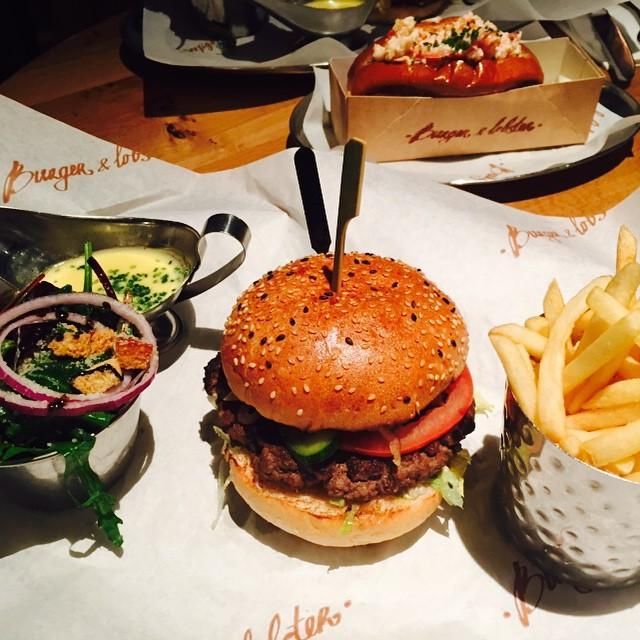
be potentially ‘visual’ (consistently recognisable), while it non-cake image. We attempted the former of these issues by
was unclear to what extent the abstract food-related terms developing a filtering strategy of recognising frequent and re-
would be visual. liable VGG classes as distractors, and removing them from
Figure 4 summarises the empirically evaluated visualness the dataset to prune false-positive label-noise. In particular
of each tag, broken down by our manual categorisation. we removed images recognised as website, restaurant, book
From this we observe that: (i) The majority of tags (691 jacket, comic book and wig from the dataset. We verified
tags, green) are actually not food related at all, indicating a that all these classes have at least 95% precision @ 20, so we
high-level of noise in Instagram data (either unrelated pho- are confident that the label noise is being removed. Restau-
tos picked up by our crawler due to having spurious food re- rant images contain restaurants with no food; detected wigs
lated tags, or food photos with non-food-related tags). (ii) are typically female selfies with long colourful hair, etc. This
Most of the concrete food object tags (152 tags, red) are pruned the dataset of 48,031 distractor images that were def-
quite visual, with 133 of them having test accuracies in the initely not food. However, repeating the previous visual tag
range of 60-77%. (iii) Of the abstract food-related tags (157 discovery experiment, the analysis showed only a small im-
tags, blue), a significant fraction are indeed quite visual, provement on the resulting visualness and manually verified
with 98 of them having test accuracies in the 60-77% range. precision compared to Table 2 so we omit the results here.
Overall, the top most visual hashtags were #sneakers, Focusing on Plates In order to find a stronger approach
#pants, #polo, #jeans #tshirt, all of which we had cate- to improving label noise, and to provide a slightly different
gorised non-food related (Figure 4, green). The most visual view of the results, we next developed a filtering strategy
hashtags in our food-related but abstract category (Fig. 4, based on focusing on food containers. Specifically, we ex-
blue) included a variety of tag types: Food containers such ploited VGGnet ability to reliably recognise the Plate class.
as #lunchbox are understandably visual. Food ethnicities We then selected only those 105,836 images that contained
such as #koreanfood, #chinesefood, #japanesefood, #viet- confidently recognised plates to repeat the analyses in Sec-
namese, were highly visual, implying that Asian foods are tion 5. Although selecting only plate images excludes a large
relatively easy to identify visually (e.g., in contrast #ital- volume of food data, it also removes almost all of the widely
ianfood and #frenchfood were ranked low for visualness). prevalent non-food, distractor images (Figure 3, left), since
Some comments on food type such as #healthybreakfast plate photos almost always contained food.
and #homecooked were also visual, which is somewhat sur-
Results From the updated results in Table 3, we see quite
prising as it is not obvious that home cooked food should
a different picture compared to the un-filtered results in
be visually discernible. Finally #foodporno and #foodpor-
Tab. 2. In particular, we make the following observations:
nasia were also highly visual suggesting that, although ab-
(i) The top 20 hashtags are all food-related, unlike the pre-
stract, the types of foods that #foodporno is applied to are
vious experiment where food-related hashtags were ranked
sufficiently consistent for images warranting this tag to be
10-47th. (ii) Some Japanese foods are now the most vi-
detectable.
sual hashtags, presumably due to their stylised and thus
Which Food Tags are Visually Recognisable? We recognisable presentation. (iii) This illustrates the value of
next focus more specifically at the concrete food object tags a visual hashtag-centric approach: First, we gain the abil-
(Fig. 4, red) for quantitative analysis. The results for the ity to recognise foods cross-culturally, and second, to recog-
top-20 most visual food hashtags are shown in Table 2. nise foods that may not have been prioritised by any top-
These hashtags were determined as visual by the metric down approach to create an image or food ontology. (iv)
of validation accuracy. Going beyond the automated vi- Somewhat surprisingly, there are multiple visual-hashtags
sualness metric of cross-validation accuracy, we also man- that might appear to be abstract, but are actually stylised
ually checked the reliability of these results by inspecting enough in presentation to be reliably recognisable, for exam-
the top-50 most highly ranked test images for each hash- ple #dessertporn, #theartofplating, #gastroart, and #food-
tag and labelling the true and false examples. From this we porno. (v) Constraining the domain in this way has a sig-
could compute Precision @ 50, and average precision (over nificant positive effect on the accuracy of the top-20 visual
all ranks to 50), also shown in the table. It shows that in hashtags (75.1% average accuracy in Fig. 3, compared to
general, confidently learned (high visualness) tags do indeed 71.1% in Figure 2.
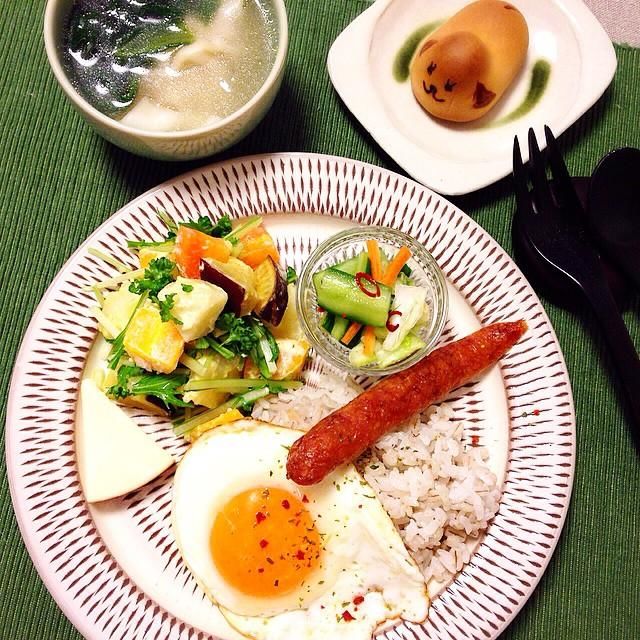
result in reasonably high precision food recognisers, with Some qualitative examples of images confidently detected
some exceptions. This noteworthy as, in strong contrast to as matching particular hashtag categories are given in Fig-
the conventional pipeline, these are bottom-up results with- ure 6. These examples cover categories well covered by tra-
out top-down pre-specification of a food ontology, and costly ditional food ontologies such as hamburger (#burger, Fig. 6,
no manual curation and annotation of training data. This first row). More interestingly, we can see the visualisation of
suggests that our approach could be a more scalable route to internet vernacular such as #foodporno and #dessertporn
ultimately recognising a very wide variety of food categories (Figure 6, second and third rows). From these we learn
in future. that #foodporno typically refers to savoury foods in con-
5.2 Improving Food Image Recognition trast to #dessertporn’s sweet foods, as well as the stylised
photography of images warranting these tags – which goes
Ameliorating Label Noise The reliability of the previ- some way to explaining how an apparently tag concept can
ous results are impacted by a variety of factors: (i) false indeed be visually detectable in practice. Finally, we see ex-
positives such as #dinner being used to refer a variety of amples images detected as matching #(Japanese Breakfast)
situations around dining (such as friends) rather than the tag (Figure 6, bottom row), illustrating the value of bottom-
meal itself, and (ii) false negatives such as tagging #food- up learning of visual food categories from tags in covering
porn but not #cake on a cake photo results in a classifier
being trained to treat that cake photo as an example of a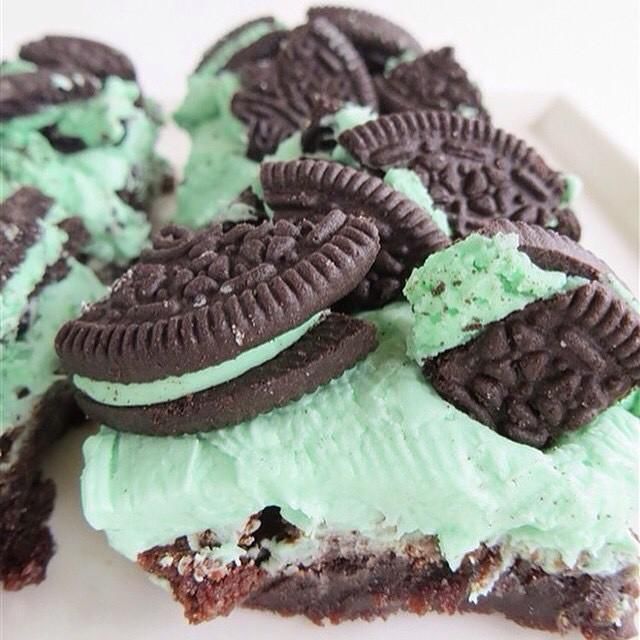
Table 2: (Raw). Top-20 most visual food hashtags.
Rank: Overall visualness ranking. Freq Rank: Fre-
quency of this hashtag in the dataset. Nrm Acc:
Normalised (imbalance adjusted) classification accu-
racy is the visualness metric. Precision and Average
Precision: Manual evaluation of resulting model.
 Rank      Hashtag        Freq Rank         Nrm. Acc      Prec @ 50          AP
 10        salad          43                74.2%         0.560              0.367
 15        smoothie       224               75.2%         0.640              0.473
 16        paella         325               76.5%         0.300              0.185
 17        cupcakes       306               71.8%         0.400              0.327
 20        chocolate      34                72.3%         0.940              0.943
 21        burger         129               71.3%         0.280              0.267
 22        donut          277               70.5%         0.640              0.662
 23        pizza          97                70.7%         0.660              0.583
 25        dessert        32                68.6%         0.900              0.914
 26        ramen          451               77.0%         0.460              0.493
 32        cake           41                71.1%         0.620              0.644
 35        coffee         62                70.2%         0.600              0.611
 36        spaghetti      226               71.3%         0.280              0.227
 37        soup           137               70.4%         0.040              0.039
 40        muffin         264               68.8%         0.160              0.140
 41        noodles        184               71.5%         0.240              0.235
 42        fries          193               66.2%         0.040              0.014
 43        cookie         228               66.2%         0.440              0.401
 46        avocado        239               69.4%         0.020              0.022
 47        juice          189               68.7%         0.160              0.144     Figure 5: Hashtag correlation across the dataset.

Table 3: Results of Hashtag Learning (Plate Focus).                                   #dessertporn are now part of a global food vocabulary. It
Top-20 most visual food hashtags.                                                     is interesting to note that North and South America doc-
 Rank   Hashtag                            Freq Rank   Nrm Acc   Prec @ 20    AP
 1      breakfast (Japanese)               271         83.8%     0.70         0.55    ument their beer consumption with greater frequency than
 2      breakfast (Traditional Japanese)   343         82.1%     0.325        0.317   their other continental counterparts. In addition, Africa is
 3      home food (Japanese)               253         77.1%     0.525        0.54
 4      fries                              140         71.4%     0.35         0.302   the only continent to have a savoury hashtag as their most
 5      sushi                              100         75.4%     0.25         0.232   popular.
 6      burger                             129         73.8%     0.35         0.373
 7      dessertporn*                       218         74.7%     0.55         0.620
 8
 9
        roast
        spaghetti
                                           179
                                           163
                                                       70.6%
                                                       75.2%
                                                                 0.50
                                                                 0.60
                                                                              0.488
                                                                              0.675
                                                                                      6.2    Tag Correlations
 10     theartofplating*                   295         79.2%     0.70         0.549      We also investigated the co-occurrence of visual categories
 11     sweettooth                         220         74.4%     0.55         0.623
 12     desserts                           187         73.4%     0.65         0.740   across the dataset. Fig. 5 visualises the strongest corre-
 13     banana                             212         72.7%     0.20         0.240   lations in the resulting correlation matrix. This did not
 14     pancakes                           272         73.1%     0.05         0.050
 15     cake                               119         73.4%     0.45         0.665   vary strongly across countries. Unsurprisingly, the great-
 16     gastroart*                         333         76.3%     0.90         0.925   est correlations were between the sweet items of the list.
 17     soup                               170         69.0%     0.10         0.113
 18     foodporno*                         238         77.3%     0.50         0.551   The hashtags #sweettooth, #desserts, #dessert, #choco-
 19     sashimi                            387         75.2%     0.35         0.444   late, #dessertporn, #cake were the most strongly corre-
 20     icecream                           177         72.8%     0.05         0.066
                                                                                      lated. Since coffee is normally an accompaniment to dessert,
                                                                                      positive correlations also existed between coffee and cake,
categories that may have been missed by traditional top-                              and coffee and chocolate. These relationships were also anal-
down food ontologies.                                                                 ysed within each continent. All of the correlations were re-
                                                                                      markably similar, with Europe and South America having
                                                                                      the strongest correlations overall, and Australia having the
6.      FURTHER ANALYSIS                                                              weakest.
                                                                                         The strongest negative correlations existed between #salad
6.1     Geospatial Distribution                                                       and most of the other hashtags. While salad and the sweet
   The popularity of different foods is broken down by conti-                         hashtags had a negative relationship, salad also has nega-
nent in Tab 4. We present results for both VGG ImageNet-                              tive correlations with coffee and drink. Additionally #beer
1000 food categories and our visual tag classifier (using those                       was infrequently accompanied by one of the dessert-related
hashtags determined to be reliably visually recognisable in                           hashtags.
Sec 5). Note that both of these results are based on vi-
sual analysis of the actual Instagram photos, in contrast to
purely tag-based studies such as [16].                                                7.    DISCUSSION
   From the top VGG classes, the most popular foods would                                Existing social media digital health studies [16] have tended
appear to be relatively universal (ice cream, pizza are bur-                          to focus on hashtags. This is a good start but suffers from
rito are popular on every continent). However, there are                              the issue of only analysing what the user chooses to explic-
also some unique aspects such as ‘Hot Pot’ in Asia. From                              itly tag in an image. In contrast, analysing actually posted
the visual hashtag analysis we see that #sweettooth and                               images has the possibility to reduce this bias to some de-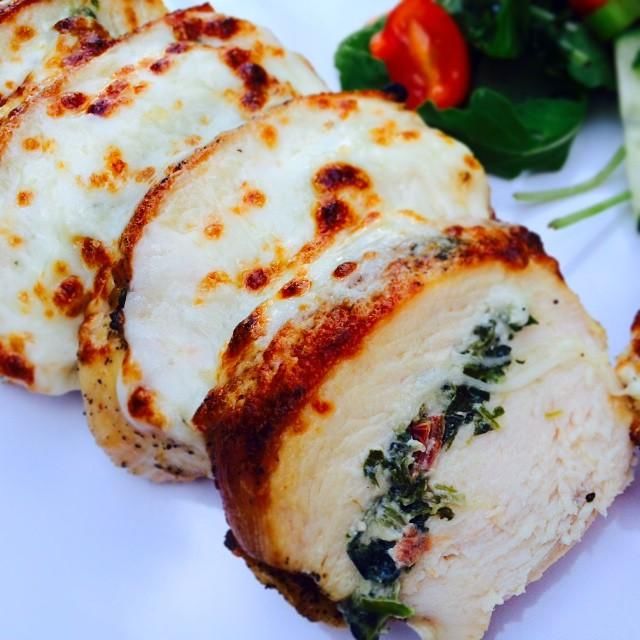
Table 4:   Breakdown of Instagram posted foods by continent.
                         Overall       Africa         Asia        Australia    Europe          N. America            S. America
                         Ice cream     Pizza          Ice cream   Ice cream    Ice cream       Burrito               Ice cream
       VGG Cats.

                         Burrito       Burrito        Carbonara   Cheeseburger Pizza           Ice cream             Burrito
                         Pizza         Bakery         Hot pot     Pizza        Bakery          Cheeseburger          Chocolate sauce
                         Packet        Ice cream      Burrito     Burrito      Packet          Pizza                 Cheeseburger
                         Bakery        Hotdog         Bakery      Hotdog       Chocolate sauce Hotdog                Bakery
                         Overall       Africa         Asia        Australia    Europe          N. America            S. America
                         Dessert       Salad          Dessert     Dessert      Dessert         Dessert               Chocolate
                         Chocolate     Dessert        Coffee      Coffee       Chocolate       Salad                 Dessert
       Visual Hashtags

                         Cake          Chocolate      Cake        Salad        Cake            Chocolate             Cake
                         Salad         Pizza          Chocolate   Chocolate    Salad           Coffee                Salad
                         Coffee        Coffee         Salad       Cake         Desserts        Cake                  Desserts
                         Desserts      Cake           Desserts    Smoothie     Dessertporn     Beer                  Dessertporn
                         Sweettooth    Sweettooth     Sweettooth  Dessertporn  Sweettooth      Pizza                 Sweettooth
                         Dessertporn   Desserts       Dessertporn Pizza        Coffee          Desserts              Coffee
                         Pizza         Dessertporn    Pizza       Foodporno    Drink           Sweettooth            Beer
                         Drink         Drink          Drink       Desserts     Pizza           Dessertporn           Drink

gree9 by analysing the actual image content, rather than                     this, for example by filtering out non-food images and fo-
what the user chose to tag about the image. Moreover, data                   cusing on high-confidence food images to reduce noise level
can be obtained from all those un-tagged images if we can                    (Sec 5.2). Going forward, more sophisticated approaches
automatically understand their content.                                      from the machine learning community that deal explicitly
   However, despite some initial attempts [14, 15, 19], analysing            with label noise may be able to further address this issue
images automatically at scale is not easy, mainly due to:                    [18, 21]. A different challenge is introduced by our strategy
(i) the huge intra-class variability of many food types (e.g.,               of training classifiers for every tag, which is a very resource
salad composed of greens, grains, or fruit.); (ii) the variabil-             intensive exercise when performed at large scale, but is at
ity of illumination, pose, image quality etc of photos taken                 least very amenable to parallelisation. In future, false posi-
by users with smartphone cameras; (iii) the requirement                      tive and missing tags could also be cleaned up by exploiting
of typical recognition methods that the object to recognise                  inter-tag-correlation (e.g., as we discovered, beer and dessert
should be centred and cropped of distracting background                      rarely co-occur) [5], however this may compromise the par-
context; and (iv) the necessity of pre-defining food ontolo-                 allelism of the current framework.
gies, as well as collecting annotated training data to train                    Another factor contributing to label-noise was user incen-
recognisers.                                                                 tives on Instagram. Some Instagram users aim to garner
   In this paper, we explored an alternative approaches to                   likes, with some websites, such as “Instagram Tags: More
Instagram food image analysis: We first leveraged the deep                   likes, More Followers” providing users with suggested hash-
neural network VGGnet. This is highly accurate and reli-                     tags, to accomplish just that, despite their possible irrel-
able, but only covers a small subset of 61 food categories in-               evance with relation to the image content. For instance,
cluded in its 1,000 category knowledge-base. Subsequently,                   a selfie, or self-portrait, may contain the popular hashtag
we explored large scale training of classifiers to recognise in-             #foodgasm, despite it being an unsuitable descriptor of the
dividual hashtags, allowing consistently visual (rather than,                image, so that it may appear on the timeline of searches for
e.g., emotional) hashtags to emerge bottom-up. This ap-                      that tag.
proach tended to be less accurate than VGGnet because the
user-generated nature of the tags results in label-noise (false
positive and false negative tagging) from the perspective of
                                                                             8.   CONCLUSIONS AND FUTURE WORK
the classifier trying to learn a visual concept. However, it                   In this paper we make a first attempt in large-scale, bottom-
has the key benefits that (i) it has the potential to learn                  up, image content discovery using user-generated tags in In-
much wider and unbounded variety of food categories due                      stagram image posts in-the-wild. Our results are promis-
to sidestepping the scalability barrier of collecting curated                ing and show that in addition to identifying popular items
and annotated training data, and (ii) by learning from tags                  such as sweets and despite the presence of noisy-labels, we
bottom-up, it avoids the need to pre-specify a top-down food                 can break the boundaries of traditional well-labeled training
ontology, and the associated cultural biases.                                and testing machine-learning approaches, and use the hash-
                                                                             tags to further discover categories which may not have been
Lessons and Implications.                                                    present in pre-labelled image categories. This approach is
  Although appealing, our approach of learning visual con-                   useful for analysing the users’ interests and incentives when
cepts bottom-up from tags faces some significant challenges.                 sharing food images, and consequently help in understand-
The central challenge is label noise: with false-positive (food-             ing individuals’ perception of food that is visually appealing
tagged but non-food content) as well as false negative (im-                  and the associated caloric values.
ages missing some key content tags) being prevalent. In this                   In future work we aim to investigate the ability of detect-
paper we sketch some approaches that can help alleviate                      ing various categories by relying purely on user labels for
                                                                             various tag types and compare the visualness of the tags
9
    There is still bias according to which images are posted.                when used in conjunction with different image types. An-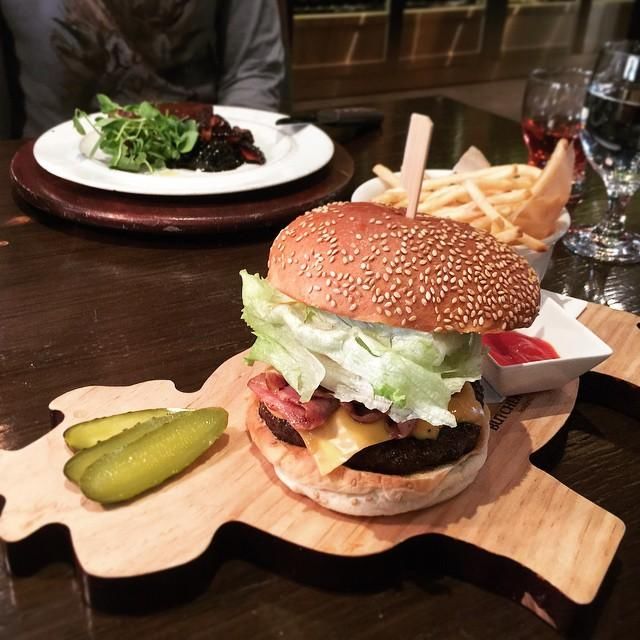
other avenue for potential future research is understanding     [13] Layne, R., Hospedales, T., and Gong, S.
the effect of presence of faces in images on the visualness          Re-identification: Hunting attributes in the wild. In
and variety of tags used, hence comparing the social ele-            British Machine Vision Conference (2014).
ment versus culinary focus of images and their respective       [14] Martin, C. K., Kaya, S., and Gunturk, B. K.
captions and comments.                                               Quantification of food intake using food image
                                                                     analysis. In Engineering in Medicine and Biology
9.   REFERENCES                                                      Society, 2009. EMBC 2009. Annual International
 [1] Abbar, S., Mejova, Y., and Weber, I. You tweet                  Conference of the IEEE (2009), IEEE, pp. 6869–6872.
     what you eat: Studying food consumption through            [15] Martin, C. K., Nicklas, T., Gunturk, B.,
     twitter. In Proceedings of the 33rd Annual ACM                  Correa, J. B., Allen, H., and Champagne, C.
     Conference on Human Factors in Computing Systems                Measuring food intake with digital photography.
     (New York, NY, USA, 2015), CHI ’15, ACM,                        Journal of Human Nutrition and Dietetics 27, s1
     pp. 3197–3206.                                                  (2014), 72–81.
 [2] Berg, T. L., Berg, A. C., and Shih, J. Automatic           [16] Mejova, Y., Haddadi, H., Noulas, A., and
     attribute discovery and characterization from noisy             Weber, I. # foodporn: Obesity patterns in culinary
     web data. In ECCV (Berlin, Heidelberg, 2010),                   interactions. ACM conference on Digital Health 2015
     ECCV’10, Springer-Verlag, pp. 663–676.                          (2015).
 [3] Black, A. E., Prentice, A. M., Goldberg, G. R.,            [17] Oliva, A., and Torralba, A. Modeling the shape of
     Jebb, S. A., Bingham, S. A., Livingstone, M.                    the scene: A holistic representation of the spatial
     B. E., and Coward, A. Measurements of total                     envelope. Int. J. Comput. Vision 42, 3 (May 2001),
     energy expenditure provide insights into the validity of        145–175.
     dietary measurements of energy intake. Journal of the      [18] Reed, S., Lee, H., Anguelov, D., Szegedy, C.,
     American Dietetic Association 93, 5 (1993), 572–579.            Erhan, D., and Rabinovich, A. Training deep
 [4] Chen, X., Shrivastava, A., and Gupta, A. Neil:                  neural networks on noisy labels with bootstrapping. In
     Extracting visual knowledge from web data. In ICCV              ICLR Workshop (2015).
     (December 2013).                                           [19] Sharma, S. S., and De Choudhury, M. Measuring
 [5] Deng, J., Ding, N., Jia, Y., Frome, A., Murphy,                 and characterizing nutritional information of food and
     K., Bengio, S., Li, Y., Neven, H., and Adam, H.                 ingestion content in instagram. In Proceedings of the
     Large-scale object classification using label relation          24th International Conference on World Wide Web
     graphs. In ECCV, D. Fleet, T. Pajdla, B. Schiele, and           (Republic and Canton of Geneva, Switzerland, 2015),
     T. Tuytelaars, Eds., vol. 8689 of Lecture Notes in              WWW ’15 Companion, International World Wide
     Computer Science. Springer International Publishing,            Web Conferences Steering Committee, pp. 115–116.
     2014, pp. 48–64.                                           [20] Simonyan, K., and Zisserman, A. Very deep
 [6] Deng, J., Dong, W., Socher, R., Li, L.-J., Li, K.,              convolutional networks for large-scale image
     and Fei-Fei, L. Imagenet: A large-scale hierarchical            recognition. In ICLR (2015).
     image database. In CVPR (2009).                            [21] Sukhbaatar, S., Bruna, J., Paluri, M., Bourdev,
 [7] Duggan, M., Ellison, N. B., Lampe, C., Lenhart,                 L., and Fergus, R. Training convolutional networks
     A., and Madden, M. Social media update 2014. Pew                with noisy labels. In ICLR Workshop (2015).
     Research Center (2015).                                    [22] Zepeda, L., and Deal, D. Think before you eat:
 [8] Fan, R.-E., Chang, K.-W., Hsieh, C.-J., Wang,                   photographic food diaries as intervention tools to
     X.-R., and Lin, C.-J. Liblinear: A library for large            change dietary decision making and attitudes.
     linear classification. Journal of Machine Learning              International Journal of Consumer Studies 32, 6
     Research 9 (June 2008), 1871–1874.                              (2008), 692–698.
 [9] Fard, M. A., Haddadi, H., and Targhi, A. T.
     Fruits and vegetables calorie counter using
     convolutional neural networks. In ACM Digital Health
     (April 2016).
[10] Fried, D., Surdeanu, M., Kobourov, S., Hingle,
     M., and Bell, D. Analyzing the language of food on
     social media. In Big Data (Big Data), 2014 IEEE
     International Conference on (2014), IEEE,
     pp. 778–783.
[11] Hu, Y., Manikonda, L., and Kambhampati, S.
     What we instagram: A first analysis of instagram
     photo content and user types. In ICWSM (2014),
     AAAI.
[12] Kawano, Y., and Yanai, K. Food image recognition
     with deep convolutional features. In Proceedings of the
     2014 ACM International Joint Conference on
     Pervasive and Ubiquitous Computing: Adjunct
     Publication (New York, NY, USA, 2014), UbiComp
     ’14 Adjunct, ACM, pp. 589–593.
Figure 6: Example images detected by our bottom-up learned visual concept recogniser. Top row: #burger.
Second row: #foodporno, Third row: #dessertporn. Bottom row: #(japanese breakfast).
You can also read