Traffic Data, Driver Behaviour - Guide for finding issues - Consat Telematics Portal
←
→
Page content transcription
If your browser does not render page correctly, please read the page content below

Traffic Data, Driver Behaviour
                 Guide for finding issues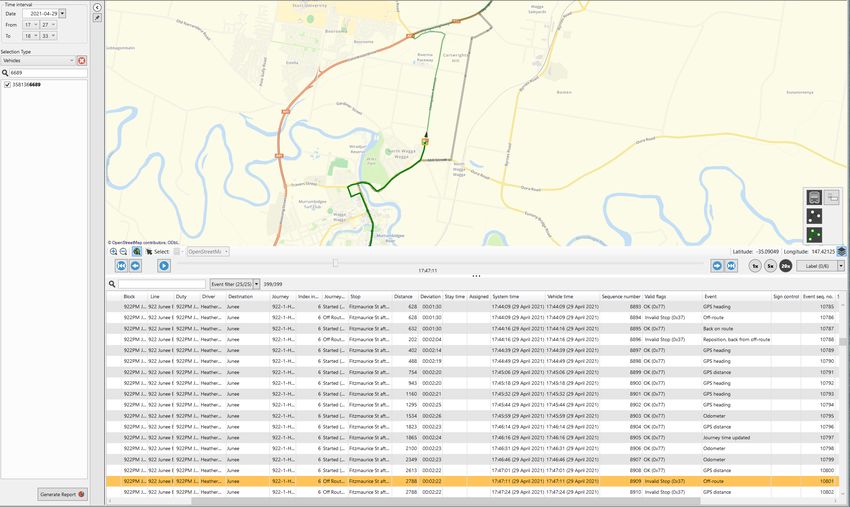
© COPYRIGHT CONSAT 2021

All rights reserved.

The content of this document may be subject to revision without notice. Consat has no
liability for typing errors in this document.
No part of this document may be copied, distributed, transmitted, transcribed, stored in a
retrieval system, or translated into any human or computer language without the prior
written permission of Consat.

                               Consat Telematics | Traffic Data, Driver Behaviour       2 /32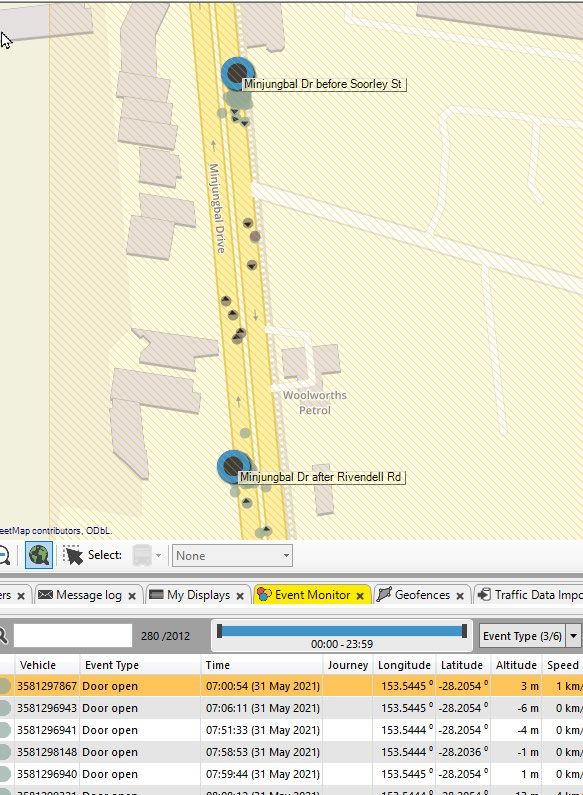
Table of Contents
1     IN GENERAL .....................................................................................................................4
    1.1 TERMINOLOGY .............................................................................................................. 4
    1.2 WHAT TO FIND AND WHERE? ......................................................................................... 4
    1.3 BRIEF DESCRIPTION OF THE PLUGINS ............................................................................ 5
      1.3.1 Assignment Status ................................................................................................ 5
      1.3.2 Daily Diagnostics .................................................................................................. 5
      1.3.3 Event History ........................................................................................................ 5
      1.3.4 Route Checker ...................................................................................................... 6
      1.3.5 Journey Time Report ............................................................................................ 6
      1.3.6 Line Report ........................................................................................................... 6
      1.3.7 Punctuality & Deviation Report ............................................................................. 7
      1.3.8 Route Checker ...................................................................................................... 7
      1.3.9 Traffic Log Report ................................................................................................. 8
      1.3.10  Trip Playback ..................................................................................................... 8
2     SCHEDULED DATA ......................................................................................................... 9
    2.1 ASSIGNMENTS .............................................................................................................. 9
      2.1.1 Traffic Log Report ................................................................................................. 9
      2.1.2 Assignment Status & Trip Playback.................................................................... 11
    2.2 TIMETABLE ADHERENCE .............................................................................................. 14
      2.2.1 Adjusting a Timetable ......................................................................................... 14
         2.2.1.1     Punctuality Report ..................................................................................................................... 14
         2.2.1.2     Journey Time Report ................................................................................................................. 15
      2.2.2 Specific Events ................................................................................................... 16
    2.3 GEOGRAPHY ............................................................................................................... 17
      2.3.1 Stop Points ......................................................................................................... 17
         2.3.1.1     Event History ............................................................................................................................. 17
         2.3.1.2     Route Checker ........................................................................................................................... 20
      2.3.2        Route & Off-route................................................................................................ 21
         2.3.2.1     Line Report & Trip Playback ...................................................................................................... 21
         2.3.2.2     Event History & Trip Playback ................................................................................................... 23
         2.3.2.3     Event History #2 ........................................................................................................................ 26
         2.3.2.4     Daily Diagnostics ....................................................................................................................... 26

3     DRIVER BEHAVIOURS .................................................................................................. 27
    3.1 TRAFFIC LOG REPORT................................................................................................. 27
    3.2 EVENT HISTORY .......................................................................................................... 28
    3.3 ROUTE CHECKER ........................................................................................................ 29

                                                    Consat Telematics | Traffic Data, Driver Behaviour                                                   3 /32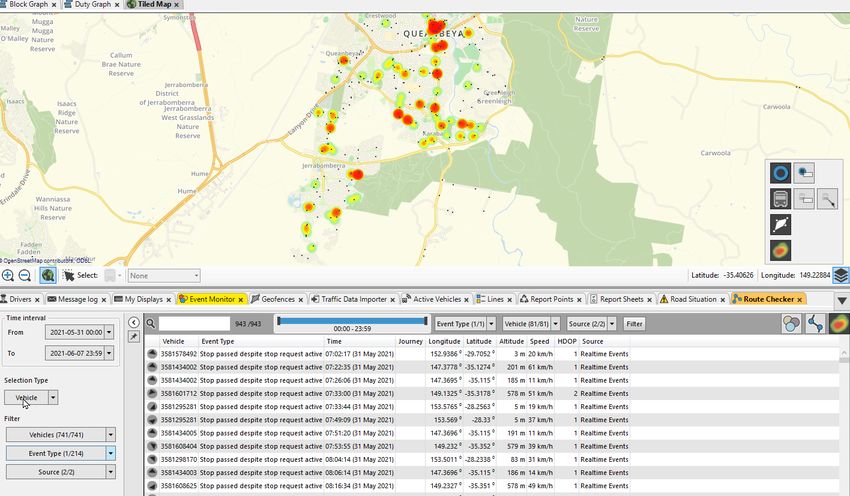
1 In General
1.1 Terminology
Traffic Studio uses the Transmodel terminology.

Transmodel                    Others

Block                         Runs

Duty                          Shifts

Journey                       Trip

Line                          Route

Route                         Route variant

1.2       What to Find and Where?
               Assignment   Daily           Event     Journey   Line     Punctuality   Route     Traffic   Trip
               Status       Diagnostics     History   Time /    Report   & Deviation   Checker   Log       Playback
                                                      Link
                                                      Summary
Early de-          X                                                                     X
assignment
Early                                          X         X                    X                     X         X
departure
from timing
stop point
Early                                          X         X                                          X
journey
start
Extreme                                                  X                                          X
early
departure
Extreme                                                  X                                          X
late
departure
Journey                                                           X                      X          X
incomplete
Journey late                                             X                               X          X
to start
point
Journeys           X             X             X                  X                      X          X
not driven /
assigned
Late               X
assignment
Late                                           X         X                                          X
journey
start
Off-route                        X                                X                      X                    X
Open door                                                                                X                    X
outside of
stop point
Part of                          X                                                       X
route
skipped

                                          Consat Telematics | Traffic Data, Driver Behaviour                  4 /32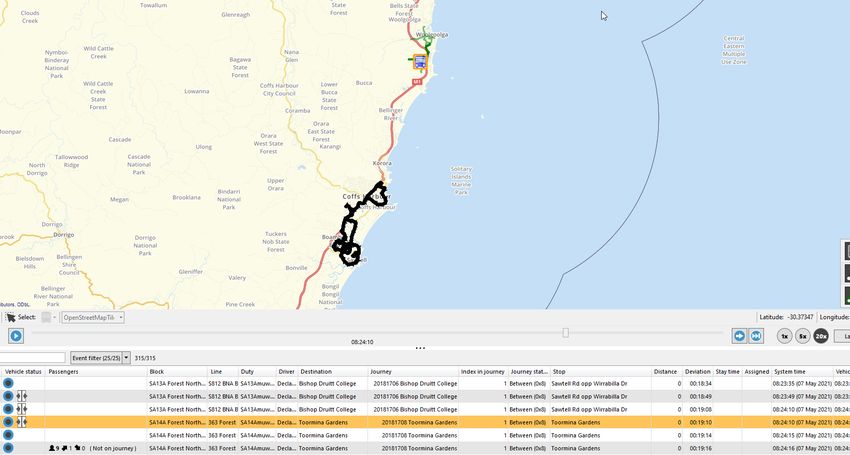
Assignment   Daily           Event     Journey   Line     Punctuality   Route     Traffic   Trip
               Status       Diagnostics     History   Time /    Report   & Deviation   Checker   Log       Playback
                                                      Link
                                                      Summary
Stop                                                                                     X
passed
despite stop
request
active
Timetable                                                X                    X                     X         X
adherence

1.3 Brief Description of the Plugins
 Under Scheduled Data and Driver Behaviours, we will point out which plugins can be used
 to find out various issues. To avoid describing each of them multiple times, we will give a
 brief guide in this section and refer to it. Please refer to the training material and/or the
 manual for more detailed information. All the plugins listed below can be exported to Excel.
 Most reports can be sorted after multiple columns. Click on a column header to sort the
 table the first time, then use SHIFT while selecting additional column by clicking on them.

1.3.1 Assignment Status
 This goes into details about all planned blocks for each of their trips so you can quickly
 identify any issues such as late assignment, early de assignment, double assignment, etc.
  1. Select a day
  2. Select a company
  3. Generate

1.3.2 Daily Diagnostics
 The report generates automatically for the latest traffic day, for the first company in the list
 (if you have access to more than one).
 You can change the date and the click on Search. Afterward, you can change company, if
 applicable.
 Click on any problem in the list to the bottom left side to display its 30-days trend in the
 right bottom chart. You can show multiple problems at the same time.
 Expand a problem to see its top 10 offenders.

1.3.3 Event History
 Event History is part of 3 plugins. You might want to look at Event Configuration to see
 which are activated and what their thresholds are. If you modify them, keep in mind that it
 will affect the data from the change date, not what has already been gathered. E.g.,
 activating “Journey late” today will not provide any data on the late journeys that occurred
 yesterday.
 Note: The thresholds and activation status in Event Configuration are by companies. If you
 have access to more than one, make sure to select the right one in the drop down at the
 top.
  1. Select a time interval. The longer the interval, the longer it will take to generate the
     data. However, you will get better patterns.
  2. Use the Event Filter to focus on one issue at a time if you want to use the Heat Map.

                                          Consat Telematics | Traffic Data, Driver Behaviour                  5 /32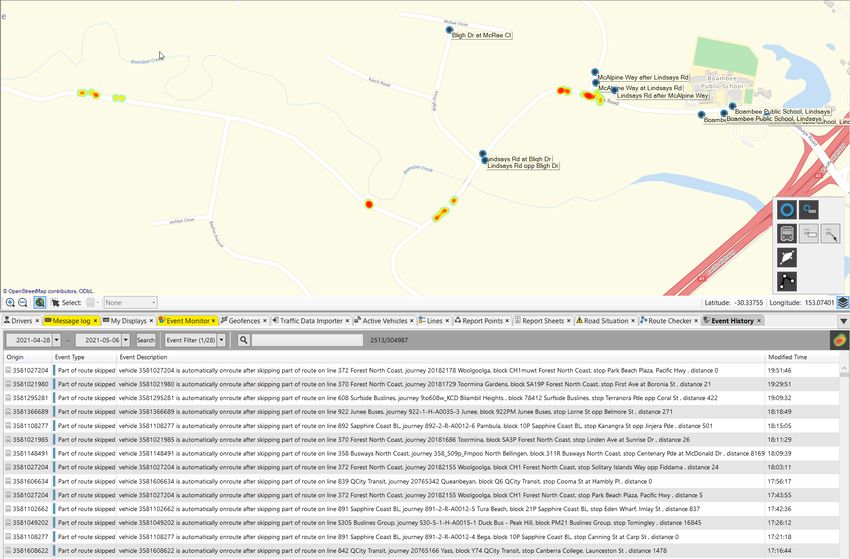
3. Use the free text filter if you want to look for specific journeys, line, stop points,
     vehicles, etc.
  4. The Heat Map function is activated by clicking on the button at the far right. It is used
     with the Tiled Map, so make sure to have it visible.

1.3.4 Route Checker
 Route Checker is often used for finding geography-related errors. However, as it lists all
 events, it can be useful for those which are not part of other reports. It works very similarly
 to Event History. Another difference is that you can draw an area on the map and see all
 events generated there, or narrow it to specific vehicles/lines before generating the report.
 1. Select a time interval.
 2. Select a type (vehicle, line or area).
 3. Select filters. Note that if you’re looking for one of a few specific events, it could be
    worth selecting them there.
 4. Generate
 5. Use available filters to narrow down the table to one event before activating the heat
    map. If you use any filter, remember to click on “update” to apply them.

1.3.5 Journey Time Report
 A great report to analyse your timetables and see where you could make adjustments
 about driving time, stay time and departure times.
 1. Select a time interval (dates). Remove specific dates and/or weekdays.
 2. Optional but recommended: Select a time interval. You want to compare apples with
    apples. Morning rush hour is different than Sunday afternoon traffic.
 3. Select a line.
 4. Select a route.
 5. Optional: Remove journeys
 6. Click on Generate.
 We recommend using the “Exclude journeys” filter to remove extreme deviations due to
 exceptions. Remember to click on “Filter” afterward to update the table.
 There are two views to this report. To see the second one, use the “Grouped by departure”
 option at the top, then click on Filter.
 Note: The Link Summary report works very similarly. The difference is that you can get all
 trips between two stop points, regardless of their lines or routes (as long as they share the
 same partial route). The stop points do not have to be consecutive.

1.3.6 Line Report
 The report summarises data by line. Clicking on a line will list all its planned journeys in the
 lower table, regardless if they were driven or not.
 1. Select from and to dates. The longer the interval, the easier it will as the off-route
    numbers will be higher.
 2. Remove dates & weekdays that might affect the data if you are aware of any.
 3. Select one or many lines.

                                 Consat Telematics | Traffic Data, Driver Behaviour             6 /32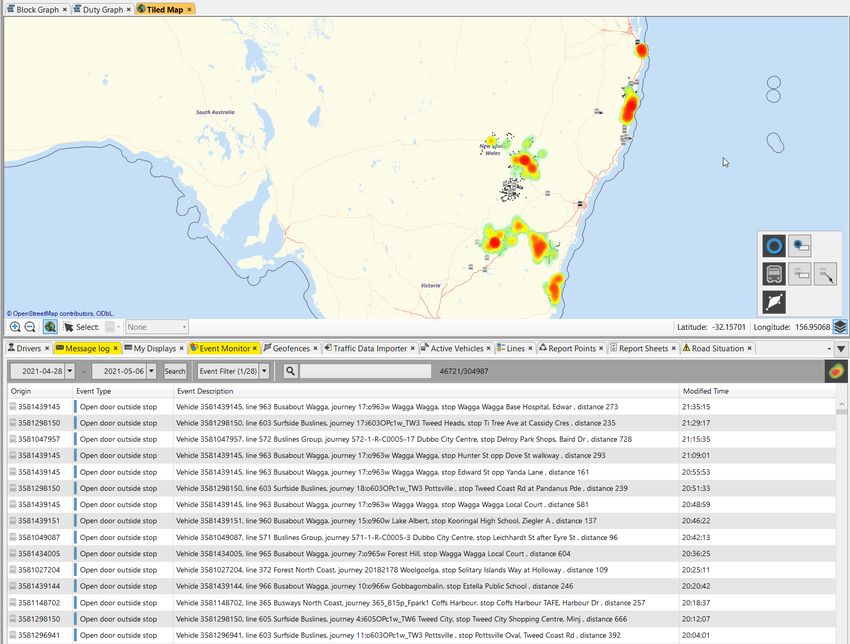
4. Remove Empty runs (untick the box) so you only look at scheduled trips with
    passengers. You can always add reinforcements if you know they should not deviate
    from the norm.
 5. Click on Generate.

1.3.7 Punctuality & Deviation Report
 Provides an overview for the punctuality of selected lines or companies. It can be a good
 starting point before delving further in.
 Punctuality only tells you how often your lines are on time. Deviations divides all these
 departures in 30 seconds slots for a more detailed overview.
 1. Select a time interval (dates).
 2. Select a comparison level: line or company.
 3. Punctuality only: Select the interval for data visualisation.
 4. Select lines, either via “lines” or your Line groups
 5. Select specific traffic type(s) and/or weekdays.
 6. Click on Generate.
 If you select a lot of lines, we recommend to export to Excel to be able to read the data
 more easily.

1.3.8 Route Checker
 We’re used mostly event History below, but Route Checker is just as valid for geography-
 related issues. It does not require any activation and can be searched via vehicle, line or
 even a drawn area on the map. Use it in combination with the Tiled Map to see where all
 events have been generated, and use the Heat Map function to see patterns.
 Route Checker’s event filter will adjust to only show the generated events for your search.
 There are over 200 different types that can be listed.
  1. Select a time interval. The longer the interval, the longer it will take to generate the
     data. However, you will get better patterns.
  2. Pick a selection type: Vehicle, Line or Area.
        a. Vehicle:
             i. Select one or multiple vehicles
             ii. Continue with step 3.
        b. Line:
             i. Select one line in the drop-down menu.
             ii. Continue with step 3
        c. Area:
             i. Draw an area on the map with the mouse (rectangle).
             ii. Select one or multiple vehicles
            iii. Continue with step 3.
  3. Under Filter, select one or multiple event types.
  4. Under source, select one of multiple sources.
  5. Generate the report.

                                 Consat Telematics | Traffic Data, Driver Behaviour          7 /32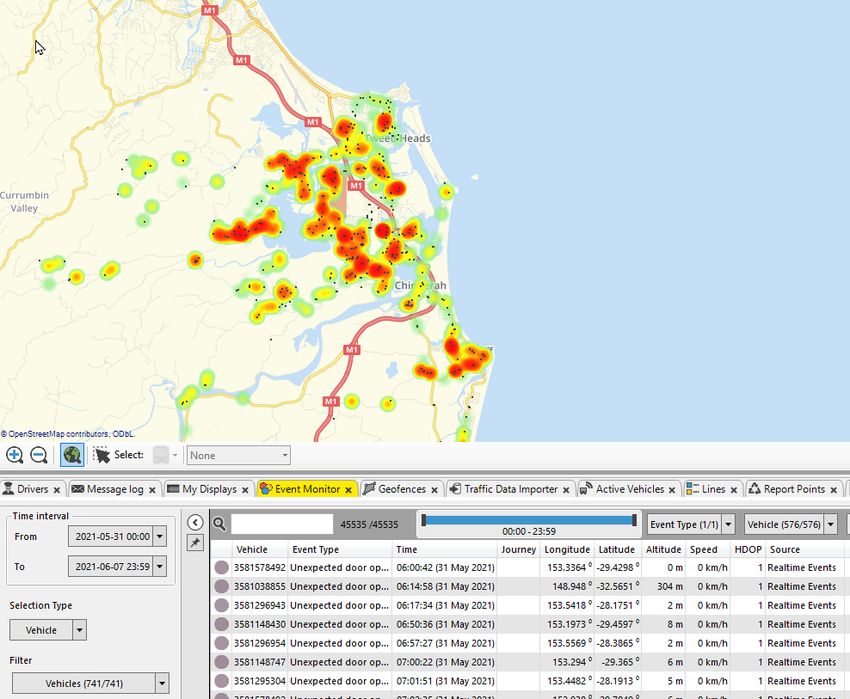
1.3.9 Traffic Log Report
 Traffic Log shows all the journeys with problematic issues.
    •   Journey not driven
    •   Journeys incomplete
    •   Journeys late to start point
    •   Late departures (from any stop point)*
    •   Early departure (from any stop point)*
    •   Late journeys start*
    •   Early journeys start*
 How to generate:
    1. Choose a time interval, there is time limit.
    2. Modify the default Traffic Deviations Thresholds if needed (*).
    3. Select your line(s).
    4. Generate.
 The upper table summarises all the traffic deviations by line. The column with thresholds
 will adjust to your changes.
 Click on any line to get a list of all the issues. You can sort them by column and filter the
 table with both the Deviation filter and the free-text filter.
 If you export it to Excel, you can use various formulas to get statistics linked to stop points,
 journeys, vehicle ID, etc. in order to look after some patterns.
 Note: For Late and early departures, the Deviation/Cause column will often have a +X,
 where X is the number of consecutive stop points with the same issue.
 Example:

 This row tells you that this specific trip started 2:28 minutes early from Coffs Harbour
 Health Campus and remained too early for the next 6 stop points according to the
 threshold (1 minute in this case). In total, the vehicle departed too early for 7 stop points in
 a row.

1.3.10 Trip Playback
 The report consists of a map and a table. The map shows the driven data for all involved
 vehicle(s). The table lists all the vehicle reports so you can follow them step by step.
 When selecting a row, the data related to the journey will be displayed, i.e., the planned
 route and its stop points are going to be marked on the map. The vehicle icon will also
 reflect its status at the time: error symbols, time deviation colour, etc.
  1. Select a date.
  2. Select a time interval (hh:mm).
  3. Select Vehicles, Lines or Blocks.
  4. Check the items you want to investigate.
  5. Click on Generate.

                                 Consat Telematics | Traffic Data, Driver Behaviour          8 /32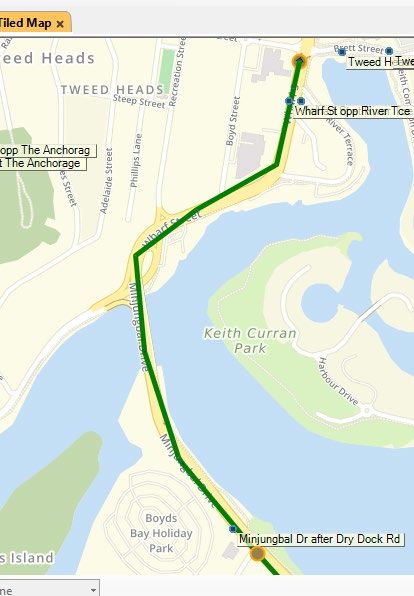
2 Scheduled Data
2.1 Assignments
 In order to get the best information in the reports, drivers must be logging in and out of
 their trips/shifts/duties. Not doing so can lead to misleading results such as, but not limited
 to:
    •   Journeys not driven
    •   Incomplete trips
    •   Driven distance on-route
    •   Driven distance off-route
    •   Passenger counts
    •   Pass-by departures
    •   Punctuality

2.1.1 Traffic Log Report
 Key Issue: Journeys not driven.
    •   Journeys not driven: The driver never logged in.
 Filter the bottom table with “journeys not driven” to get a complete list of journeys without
 assignment.
 You can sort it by journey (or even block) to see if there is a pattern of repetition for
 specific ones, as a starting point to investigate further.
 In the example below, data was pulled for a whole month for line 363. Block SA14A has 29
 non driven journeys.
    •   20181708 x5
    •   20181709 x12
    •   20181710 x12

                                 Consat Telematics | Traffic Data, Driver Behaviour          9 /32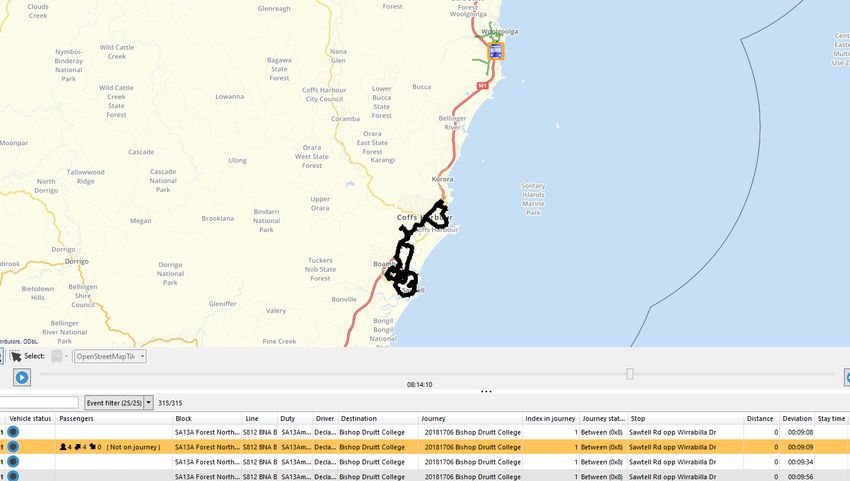
Figure 1: Traffic Log Report, Journey not driven

 If we quickly check the Line Report to get all planned journeys (next image), we can
confirm that drivers have logged to that block and these journeys at other dates.

                               Consat Telematics | Traffic Data, Driver Behaviour       10 /32
Figure 2: Line report
It could be that all these 29 journeys were cancelled, but not done via Traffic Studio /
updated in the traffic data import, or that additional training/reminders might be needed
with the drivers.
2.1.2 Assignment Status & Trip Playback
Assignment Status can help us digging further into block issues. Let’s take the blocks from
the section above, S414A. We had missing data on the 5th May.
Use the free text filter to quickly find that block in the list.
With the mouse over, I can get extra information for each assignment and journey. We see
an attempt to log in by vehicle 5551 during the first journey.
Figure 3: Assignment Status
Consat Telematics | Traffic Data, Driver Behaviour 11 /32Given how brief it was, we can look into how vehicle 5551 behaved that day with Trip
Playback.
The driver began their day on duty SA13A at 8:09am. However, the first journey’s status is
“between” while the vehicle travels around, picking and leaving passengers, and is actually
in Woolgoolga while it should be around Coffs Harbour at the time of the journey. Given
that it never drove near the first stop, it remained in the dead run journey even as it started
travelling.
Figure 4: Trip Playback
At 8:24am they manually assigned themselves to duty SA14A, with the same issue: not
even close geographically to the planned route.
Figure 5: Trip Playback
Consat Telematics | Traffic Data, Driver Behaviour 12 /32At 8:31am, the driver reassigned themselves to the proper duty, WG14, the system
recognised its position in comparison to its journey, and everything proceeded as it should.
Figure 6: Trip Playback
In this case, we can see that the driver made two wrong assignments before finally
selecting the right duty, while driving and reporting to the wrong duty&journey for about 20
minutes.
Consat Telematics | Traffic Data, Driver Behaviour 13 /322.2 Timetable Adherence
2.2.1 Adjusting a Timetable
2.2.1.1 Punctuality Report
This report can be a good first step to identify lines with poor punctuality.
Make sure to select a max of 32 lines, and to compare by line. We suggest using the
largest interval, so you only get one number by line. We also suggest exporting the results
to Excel to make it easier to read it.
Figure 7: Punctuality Report
Figure 8: Excel view of punctuality report
We decide that we want to start with line 601.
Consat Telematics | Traffic Data, Driver Behaviour 14 /322.2.1.2 Journey Time Report
Remember! Be sure to select day(s) and times where traffic should behave similarly. You
don’t want to summarise everything Monday morning rush hour with Sunday mid-
afternoon, they just aren’t the same.
We select line 601 and start with the “TAFE NSW Kingscliff -> Tweed Regional Museum,
Kennedy D” route, during afternoon rush hours on weekdays only.
We then filter the results to exclude anything over 10 minutes late/early to remove
exceptions.
The resulting table shows that most of the departures are late, with 98% journeys starting
with an average of 2:10 minutes late, and the majority of the journeys/departures
remaining around 2 minutes late throughout the route. It could be worth investigating why
almost all journeys begin with such a late start. This could be a snowball effect between
following journeys which could be fixed with a longer buffer in-between / more time for
dead runs.
Figure 9: Journey Time Report
If we check at the other view “Grouped by Departure”, we can also see a difference
between average driving times from 46:57 to 54:41 for the same route, depending on the
journeys. Perhaps different timetables for different times of the day might be helpful.
Consat Telematics | Traffic Data, Driver Behaviour 15 /32Figure 10: Journey Time Report - 2nd view
2.2.2 Specific Events
Plugin: Traffic Log
Key Issue: Late journey start, Early journey start, Journeys late to start point. Look for
patterns.
• Journeys started late & Journeys late to start point: It is possible that there is not
enough time between both journeys for a buffer in case of delays, which can also
cause a snowball effect and affects multiple consecutive journeys.
• Journeys started early: It is possible that the starting stop point does not offer the
possibility for the driver to wait long enough, forcing them to start earlier than
planned.
Consat Telematics | Traffic Data, Driver Behaviour 16 /322.3 Geography
2.3.1 Stop Points
Each stop point has a circle with a 25 meters radius. This circle determinates when a
vehicle has arrived and departed a stop point. You can display this by selecting a stop in
Planned Traffic. They are also marked when displaying a route via Planned Traffic and in
the Trip Playback report.
Some stop can have a terminal geofence, which is visible in the map if you have the
Geofence plugin activated. In these cases, the geofence overrides the circle.
2.3.1.1 Event History
Key event: “Open door outside stop”.
1. Filter the table with only “Open door outside stop”.
2. Use the Heat Map function to identify problematic area. Double-click on any row or
zoom in on the map to investigate the issues. You can use the free text filter to
narrow the table to a specific stop point, but keep in mind that it will only filter the
door opening FROM that stop point, not those TOWARDS that stop, i.e., have not
arrived yet.
In the image below, we see all the events on the map, the red areas are those with the
highest occurrence.
The area below shows a lot of “open door outside stops” which affect multiple stops.
Figure 11: Event History
Consat Telematics | Traffic Data, Driver Behaviour 17 /32Figure 12: Heat map from Event History's data
Below is a good example of a stop point which is wrongly located in the geography data.
This can affect punctuality reports, completion status, passenger counts, etc., when it
comes to the Riverina Anglican College as well as the related trips and lines.
Figure 13: Location of the events compared to the stop point's location from the traffic data
Similar as above, though it is more questionable to which stop point these boarding and
alighting belong.
Consat Telematics | Traffic Data, Driver Behaviour 18 /32Figure 14: Distance between the recorded events and the stop points in the traffic data
In the example below, the door opening reports are linked to Mitchell Hwy at Hight Park
Rd, about 1.4km away, while the map shows that they are likely within 100m from High
Park Rd at River.
Figure 15: Distance between recorded events and the stop points in the traffic data
Consat Telematics | Traffic Data, Driver Behaviour 19 /322.3.1.2 Route Checker
Key event: Unexpected door opening
Another way to look for wrongly positioned stop point is Route Checker. However, the
events listed will not have as much information as Event History. However, they do not
need to be activated, so if you haven’t done it before in Events, then you can still look for it
via Route Checker. You can also search by vehicle, line and area.
In the example below, we looked for all vehicles, during 2 weeks. We found 45 535 reports
with “unexpected door open”. We turned on the Heat Map to more easily identify the worse
offenders.
Figure 16: Route Checker and heat map
We zoom in at one of the redder area, in this case Piggabeen Rd at Skyline Dr, to see that
all unexpected door open are quite off from the stop point in the system. They are
however, right in front of a building. Either the stop point is wrongly located, or the driver
allows passengers to board/alight in front of that building.
Consat Telematics | Traffic Data, Driver Behaviour 20 /32Figure 17: Route Checker - Unexpected door open events, well outside the stop point area
We can add the “Door open” event to our search, to see if there are any around the stop
point, to help confirm which of our two hypotheses might be right.
Figure 18: Route Checker - Unexpected door open (purple) and door open (blue) events, both well outside the stop
point area
The result shows us all door opening (blue), and “unexpected door open” (purple), to be in
front of the building. There are no door opening at all near the stop point, making it highly
probable that the geography is wrong in the traffic data.
2.3.2 Route & Off-route
There can be many reasons for variations.
• Differences between scheduled data and driven route. This can be due to erroneous
route data, planned detours due to road works which have not been added to the
scheduled data, etc.
• Exceptional events such as accidents, weather, etc.
• Driver behaviour, e.g., skipping parts of the route.
2.3.2.1 Line Report & Trip Playback
To find lines (routes) with unusual off-route, we use the Line Report and dig further with
the Trip Playback (alt. Vehicle History).
Consat Telematics | Traffic Data, Driver Behaviour 21 /32The upper table lists all the selected lines. Sort the table by clicking on the “Off-route
distance” column header and look for any results that might be too high.
Click on a line to list ALL trips during the selected period. You can then sort it by “Off-route
distance” to quickly identify those with issues.
• Look for patterns to identify a difference between scheduled data and driven data.
E.g., same trips/route patterns having similar off-route distances.
• A few meters should be normal. Scheduled data for route patterns are never 100%
accurate. Consider this if a) your line covers large distances and b) your line has a lot
of trips.
In the example below, we look at Line 922 which has 318km off-route in the past 30 days.
By sorting with “off-route distance”, we can identify 49 trips (out of 57) with off-route values
ranging between 3 and 10 km.
Figure 19: Line Report
Consat Telematics | Traffic Data, Driver Behaviour 22 /32Figure 20: Trip Playback
2.3.2.2 Event History & Trip Playback
Key events: “Part of route skipped”.
Plugins: Event History & Trip Playback
This event will be triggered once the vehicle is back on route, with a distance from the
latest on-route stop point before the vehicle went off-route.
Consat Telematics | Traffic Data, Driver Behaviour 23 /32Figure 21: Event History - Part of route skipped events
Example below shows where the vehicle driving duty CH1 went off-route for 1407 meters
from Sandy Beach Dr Opp Acacia Ave (lower right in dark blue) and then came back on-
route close to 5 Solitary Islands Way (event is marked as a light blue ring).
We used the free-text filter for “Sandy Beach Opp” to find all related events, to see if that
could be a one-off or if there might be a pattern. We got 7 events for 5 different dates.
Figure 22: Distance between the logged events and the associated stop point
You can investigate further with Trip Playback where you can easily compare the planned
route to how the vehicle drove.
Narrow down the time to the trip (202105180 is planned between 17:24 and 18:15) and
use Blocks as your selection type. Search for CH1 to make it easier to select it.
Figure 23: Trip Playback
Consat Telematics | Traffic Data, Driver Behaviour 24 /32The blue line is the planned route, the green is driven data. From a quick overview, we can
already see 2 portions which were skipped.
The lower skipped route, below, shows both on the map (no green overlay on the blue
trail) and in the table (Index in Journey goes from 24th stop to 32nd, telling us it skipped 7
stop points). The vehicle went from being 9 minutes late to almost 7 minutes.
Figure 24: The difference between the logged route (green) and the planned route (blue).
The second skipped route, the one we detected in Event History, also shows that the
driver went from being 4 minutes late to almost 1 minute early, and that they skipped 4
stops (going from 35th to 39th stop in the journey).
Figure 25: The difference between the logged route (green) and the planned route (blue).
Consat Telematics | Traffic Data, Driver Behaviour 25 /322.3.2.3 Event History #2
Key event: Off-route
Use Event History to identify the most frequent locations where vehicles go off-route.
Figure 26: Event History
2.3.2.4 Daily Diagnostics
Numerous issues are listed in Daily Diagnostics, such as
• Links off route
• Journeys with off route
Select a completed traffic day to get the list of all issues for that date. If you tick a specific
issue, you will also get the % for the past 30 days from that date so you can identify any
trend.
You can expand any problem to get a list of the top 10 causes.
Consat Telematics | Traffic Data, Driver Behaviour 26 /32Figure 27: Daily Diagnostics, Busways North Coast, 2021-05-12
In the image above, we get the following list for the links with the most off-route. For
example, the link between Tyndale and Maclean Cemetery, Camero St had 3 off-route
reports on the 12th May 2021.
Links off route
• 24603(Tyndale )-24634(Maclean Cemetery, Cameron St ) 3
• 246068(Bligh St at Charles Lane )-24621(Coldstream St at River St ) 3
• 246314(Maclean Cemetery, Cameron St )-24603(Tyndale ) 1
• 24632(Maclean )-24603(Tyndale ) 1
• 246326(Maclean High School, Woombah St )-246343(Gulmarrad Public School,
Brooms ) 1
• 24639(Palmers Island Public School, Ya )-246439(Yamba Rd before Treelands Dr ) 1
• 246427(Yamba St at Ager St )-246428(Clarence St at Coldstream St ) 1
• 246433(Blue Dolphin Holiday Resort, Yam )-246434(Shores Dr after Yamba Rd ) 1
• 246435(Shores Dr at Park Ave )-246436(The Mainbrace opp Binnacle Ct ) 1
• 246438(Yamba West )-246310(Palmers Island Public School, Ya ) 1
3 Driver Behaviours
3.1 Traffic Log Report
Key Issues:
• Journey not driven: The driver could have forgotten to log in.
• Journeys incomplete: The driver could have skipped a part of their assignment.
• Journeys late to start point
• Late departures (from any stop point)*
• Early departure (from any stop point)*
• Late journeys start*
Consat Telematics | Traffic Data, Driver Behaviour 27 /32• Early journeys start*
Traffic Log can help finding patterns (sort by blocks and/or journeys). You can change
some thresholds (what flags a departure/journey as late/early), so make sure to pick
values that help you to identify the issues you’re looking for.
You can sort the upper table by column to find the line(s) with the most issues, then click
on that line to see all journeys with issues. Be sure to use the filter if you want to focus on
one or two at a time. Be aware that some journeys might trigger more than one issue, so
they’ll be listed together in the first column.
Since all journeys are listed, you can easily open it in Detail report, Trip Playback, vehicle
history, etc. to look more closely into it. If you think it might be related to the timetable, i.e.,
a lot of journeys have a similar issue, check out the route in Journey Time report or even
the specific link in Link Summary report.
Figure 28: Traffic Log Report
3.2 Event History
Key events:
• Early departure from timing stop point
• Journey late
• Journey not assigned
• Journey started early
• Journey started late
• Open door outside stop
Timing stop points are stops where drivers are expected to leave on time, i.e., they should
be able to wait longer if they are too early compared to the timetable.
Use this tool to see where the unwanted behaviours occur. There might be a geographic
pattern that cause them.
Examples:
Consat Telematics | Traffic Data, Driver Behaviour 28 /32• Early departures from timing stop point
o Vehicles have no room to stay and wait without hindering traffic or other
vehicles.
• Journey started late
o Can be linked to timetables, where there isn’t enough time between journeys
to absorb a late deviation, a driver change, a driver break, etc. This can
cause a snowball effect to the following journeys.
Figure 29: Event History - Early Departure from timing stop point events
3.3 Route Checker
Key events:
• Stop passed despite stop request active.
• Any other event from other plugins, or event you are interested in that you cannot find
elsewhere. Remember that we monitor over 200 different types of events.
In the example below, we’re looking at drivers who have ignored a stop request. We
selected the last week, all vehicles and only that specific event from the Event Type filter,
before generating the report.
The result is 943 events. We turned on the Heat Map (far right) to see where most of them
happened on the map. Keep in mind that they are shown on the map AFTER passing a
stop, i.e., leaving the 25 meters radius around it.
This event can happen due to a few reasons:
• The driver did not notice/ignored the stop request
• The request was made too close to the stop for the driver to be able to stop in a safe
manner
Consat Telematics | Traffic Data, Driver Behaviour 29 /32• The stop point is wrongly located in the traffic data. In this case, it would likely be
further ahead on the route, or further to the side, than what is in the system.
Figure 30: Route Checker - Stop passed despite stop request active events
If you think it might be the driver, right-click on that row and select Vehicle History to see
exactly where the stop request button was pressed.
We look at vehicle 8152. Selecting the History from the right-click menu takes us directly to
that specific day, and even select that event in the table. To simplify the example, I’ve
narrowed the History table for the time interval between the stop request and the “stop
passed despite stop request active”.
Figure 31: Vehicle history for vehicle 8152
Consat Telematics | Traffic Data, Driver Behaviour 30 /32Figure 32: Logged route for vehicle 8152, showing where the stop request was pressed (bottom) and the next stop
point on the route (top)
The table shows us that there was over 2 minutes, and 1225 meters, between the two
events. The map also shows that it was pressed a little bit back, and not near any stop
involved in that route. This is definitely a case of driver behaviour.
If you suspect that a stop point might be wrongly located, we would suggest to do a search
by area, and draw an area around the stop point (stop points if they are close enough),
and add a second event “Unexpected door open”. You could even add “Door open”. Start
by filtering to “Unexpected door open” to see how many you have, if there might be a
pattern or just a few “one-off”. If unsure, as there could be a lot of pass-by, look at “door
open” to see if they happen near the stops, or outside of the 25 meters radius ring.
In this example, we looked at Minjungbal Dr after Rivendell Rd and Minjunbal Dr before
Soorley St, where we have 6 “Stop passed despite stop request active”. They all show
between the stop points, 4 heading South and 2 heading North (grey dots with black
arrows showing heading).
Consat Telematics | Traffic Data, Driver Behaviour 31 /32Figure 33: Route Checker - Stop passed despite stop request active (left) and door open (right)
Adding “unexpected door open” only show one event. This does not feel like wrong
geography so far. We also turn on “door open” to see if we can get any confirmation, and
the results show 283 door open events, within each stop point circles (light blue dots). This
confirms that the stop points are rightly located, and these 6 events must be driver related.
Consat Telematics | Traffic Data, Driver Behaviour 32 /32You can also read