Transnational Maritime Spatial Planning in the North Sea: The Shipping Context - Report on Work-package 4 of the NorthSEE Project
←
→
Page content transcription
If your browser does not render page correctly, please read the page content below
Transnational Maritime Spatial Planning in the North Sea:
                                       The Shipping Context

                   Report on Work-package 4 of the NorthSEE Project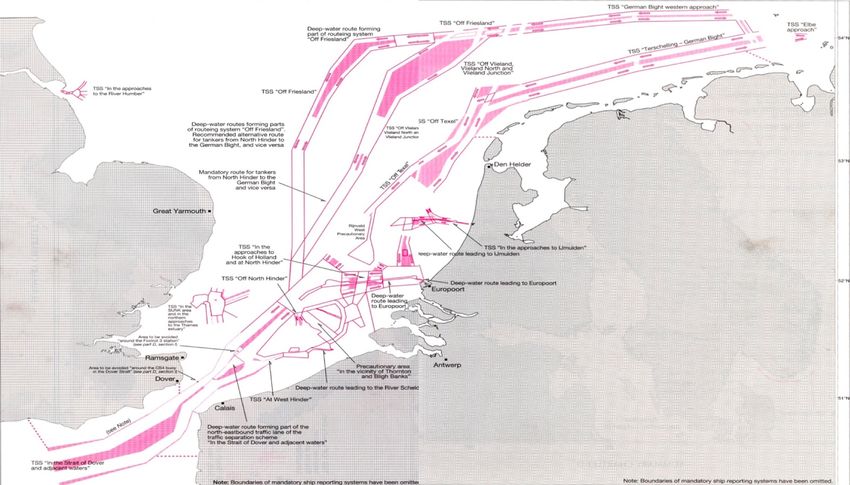
2

Drafted by:

Henrik Nilsson [World Maritime University]
hn@wmu.se

Jeroen van Overloop [Directoraat-generaal Scheepvaart, FOD Mobiliteit en Vervoer, Brussels, Belgium]
jeroen.vanoverloop@mobilit.fgov.be

Raza Ali Mehdi [World Maritime University]
rm@wmu.se

Jonas Pålsson [World Maritime University]
jp@wmu.se; jonas.palsson@havochvatten.se
3

Table of Contents

I. Introduction .............................................................................................................................. 4
   Objective ............................................................................................................................................... 4
   International geopolitical impact of shipping ........................................................................................ 4
   Seafarers ............................................................................................................................................... 8
   Legislation governing shipping .............................................................................................................. 9
   The history of shipping of the North Sea ............................................................................................. 10

II Spatial impact of current shipping activities ........................................................................... 12
   Introduction ........................................................................................................................................ 12
   Maritime traffic in 2016 ....................................................................................................................... 12
   IMO routeing measures and priority areas for shipping - Current situation ........................................ 18
      Nationally designated priority areas for shipping .............................................................................. 19
   Shipping and off-shore wind farms in transnational MSP.................................................................... 25
      Designated areas for shipping and OWF in MSP plans....................................................................... 26
      AIS data and MSP plans .................................................................................................................... 28
   Summary of chapter II ......................................................................................................................... 30

III The spatial impact of future shipping activities ..................................................................... 31
   Drivers and enablers for future shipping activities .............................................................................. 31
     New Ship design ............................................................................................................................... 35
     Ship sizes.......................................................................................................................................... 36
     Short Sea Shipping............................................................................................................................ 37
     Main EU statistical findings on Short Sea Shipping: ........................................................................... 37
     Green innovative sector ................................................................................................................... 38
   Ship design and marine technology ..................................................................................................... 39
   Fuel and energy ................................................................................................................................... 43
   Digitalization of shipping ..................................................................................................................... 48
     Levels of autonomy .......................................................................................................................... 48
     Law and legislation ........................................................................................................................... 49
     Platooning ........................................................................................................................................ 50
     Cyber security .................................................................................................................................. 52
   Development on shore side ................................................................................................................. 54
     Ports and hinterland connection ...................................................................................................... 54

Summary and Conclusions ......................................................................................................... 55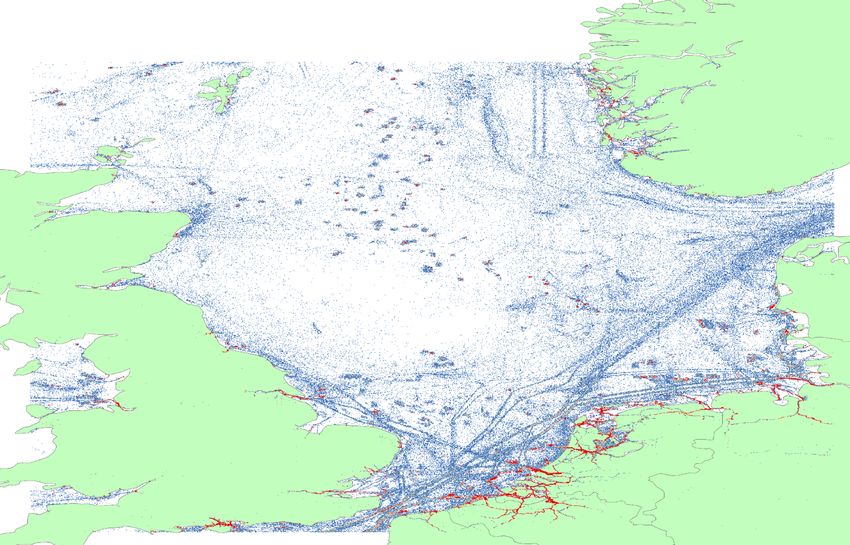
4

I. Introduction
Objective
The two principal aims of this report are to:

•   give an overview of shipping routes currently used by vessels in the North Sea and compare them with
    routes described in national maritime spatial plans of the North Sea countries.

•   provide an analysis of future trends of shipping and other maritime activities and how they affect each other,
    with emphasis on offshore wind farms.

International geopolitical impact of shipping
The shipping industry is a global industry. Likewise, it could claim to be the industry which, more than any other
makes it possible for a truly global economy to function. It connects countries, markets, businesses and people,
allowing them to buy and sell goods on a scale not previously possible.

The reality is that the needs
of a rapidly growing world
population can only be met
by transporting goods and
resources between countries.
The liner shipping industry
has made this process more
efficient and changed the
shape of the world economy.
This benefits consumers by
creating choice, boosting
economies and creating
employment. Costs for the
consumer are kept down and
efficiencies are improved, as
well       as      minimizing
environmental impacts.

Approximately 90% of the
world’s trade is done by ships
(according        to       the
International        Maritime
                                                Unctad, review maritime transport, 2017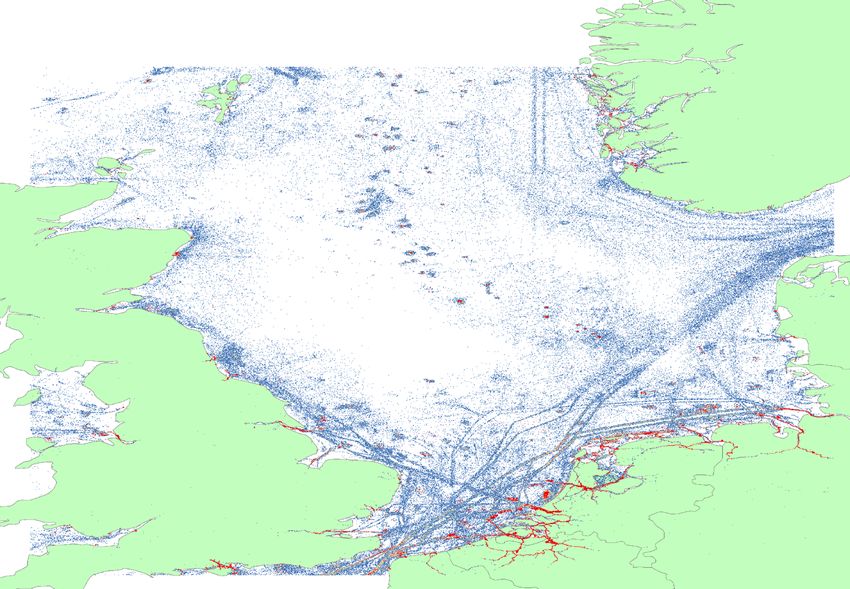
5

Organization). Shipping is dynamic and changes according to                   Did You Know?
fluctuations in the economy, changing trade types and trade routes
continuously. With the changing climate, shipping will also need              Shipping is the lifeblood of the
to adapt to changes and take advantages of new routes and                     world’s economy
regulations. Some shipping trends however, have and are likely to
stay the same in the immediate future. For instance, resources from           If all ships should disappear by
the developing world and consumer products from Asia are                      tomorrow, half the world would
generally shipped to Europe and North America for sale and                    freeze to death because of the
consumption (REF).                                                            lack of energy and half the
                                                                              world would starve to death
⅔ of the seaborne trade is dry cargo. Most of these goods are coal            because of the lack of food.
and iron, transported by bulk carriers around the world. Other dry
goods are shipped by containers in large container vessels who do
mostly east -west routes.

The nature of demand and supply of goods means that ships sail all over the world and the distribution of goods
are different for different areas. This has an equal implication on traffic routes and congestion for shipping. With
over 7.600 ships passing through hotspot areas of the North Sea region, it happens to be one of the busiest
shipping grounds in the world, only behind the South China Sea. The following map shows the amount of ships
passing globally in just one day.

     Marine traffic: AIS density map 2017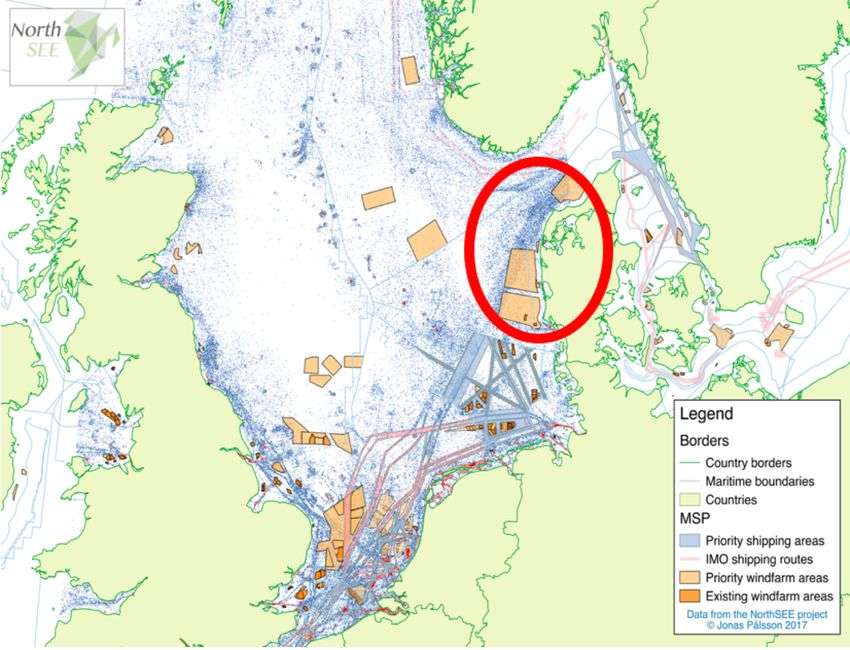
6

With up to 7.600 ships passing the hot spots of the North Sea, it is one of the most crowded seas in the world -
only the South China sea has more busy waters. And although a lot of countries around the North Sea have a
significant amount of ships sailing their flag, it is most likely that most of the ships sailing these waters are not
European flagged. The three biggest flag states Panama, Liberia and Marshall Islands hold almost 70% of the
entire fleet. This doesn’t mean in turn that the owners are residents of these countries. The three biggest ship
owner countries are Greece, Japan and China.
7
8

Seafarers
There are 1.6 million seafarers sailing around the world of which majority stay on board for several months
within a year. In addition to the risks associated with physical conditions of the ocean, including severe storms,
seafarers are also exposed to piracy and terrorist attacks, a growing concern in areas including the Gulf of Guinea
and the Malacca Strait.

Approximately 51% of the seafarers hold positions as officers, compared to 49% that are employed as ratings;
that is, non-officer sailors such as able seafarer or ordinary seafarer (in 2005, the ratio was 45%officers compared
with 55% ratings). For the first time in history, the proportion of officers is higher than that of ratings, reflecting
technological advances and lower demand for manual on-board work, as well as emphasising the importance
of economies of scale in the shipping industry. A crew of 14 or 15 seafarers is required to manage and operate
a container ship or dry bulk carrier of 10,000 gross tons whereas a ship 10 times the size (100,000 gross tons)
does not require 10 times more seafarers, but can operate well with 19 or 20 seafarers.

Between 2005 and 2015, global demand for seafarers increased by 45%, which is roughly in line with the growth
of the world fleet within the same period. The highest numbers of seafarers are residents of China (243,635),
followed by the Philippines (215,500), Indonesia (143,702), the Russian Federation (87,061), India (86,084) and
Ukraine (69,000) (Baltic and International Maritime Council and International Chamber of Shipping, 2016).

Only 9% of the seafarers at sea are female. But on the other hand, almost 71% of the onshore maritime tasks
are done by women.
9

Dealing with the shipping industry means dealing with a globally driven economic sector. Stakeholder
consultations will therefore have to take a global form rather than solely consultation of local level. Although,
the latter is a very relevant requisite for successful consultation.

Legislation governing shipping
The following are the major international shipping conventions, adopted by the International Maritime
Organization (and the International Labour Organization). However, many other maritime instruments
concerning more specific issues are also in force worldwide.

•   SOLAS (International Convention for the Safety of Life at Sea, 1974) lays down a comprehensive range of
    minimum standards for the safe construction of ships and the basic safety equipment (e.g. fire protection,
    navigation, lifesaving and radio) to be carried on board. SOLAS also requires regular ship surveys and the
    issue by flag states of certificates of compliance.

•   MARPOL (International Convention for the Prevention of Pollution from Ships, 1973/1978) contains
    requirements to prevent pollution that may be caused both accidentally and in the course of routine
    operations. MARPOL concerns the prevention of pollution from oil, bulk chemicals, dangerous goods,
    sewage, garbage and atmospheric pollution, and includes provisions such as those which require certain oil
    tankers to have double hulls.

•   UNCLOS (The United Nations Convention on the Law of the Sea, 1982), also called the Law of the Sea
    Convention or the Law of the Sea treaty, is the international agreement that resulted from the third United
    Nations Conference on the Law of the Sea (UNCLOS III), which took place between 1973 and 1982. The Law
    of the Sea Convention defines the rights and responsibilities of nations with respect to their use of the
    world's oceans, establishing guidelines for businesses, the environment, and the management of marine
    natural resources. The Convention, concluded in 1982, replaced four 1958 treaties. UNCLOS came into force
    in 1994, a year after Guyana became the 60th nation to ratify the treaty. [1] As of June 2016, 167 countries
    and the European Union have joined in the Convention. It is uncertain as to what extent the Convention
    codifies customary international law.

•   COLREGS (Convention on the International Regulations for             Did You Know?
    Preventing Collisions at Sea, 1972) lays down the basic "rules
    of the road", such as rights of way and actions to avoid             A ship is a micro world on its own
    collisions.
                                                                         Even one ship itself can be a world of
•   LOADLINE (International Convention on Loadlines, 1966) sets          its own. For example, the ship owner
    the minimum permissible free board, according to the season          can be Greek, but the ship sails under
    of the year and the ship's trading pattern.                          the Panama flag. The ships officers
                                                                         are Italian and Ukraine, but the crew
•   ISPS (The International Ship and Port Facility Security Code,
                                                                         is Philippine. The manager Hong
    2002) includes mandatory requirements to ensure that ships
                                                                         Kong, cargo Middle East and the
    and port facilities are secure at all stages during a voyage.
                                                                         insurance companies are from other
•   ISM (The International Safety Management Code, 1993)                 states.
    effectively requires shipping companies to have a licence to
    operate. Companies and their ships must undergo regular audits to ensure that a safety management system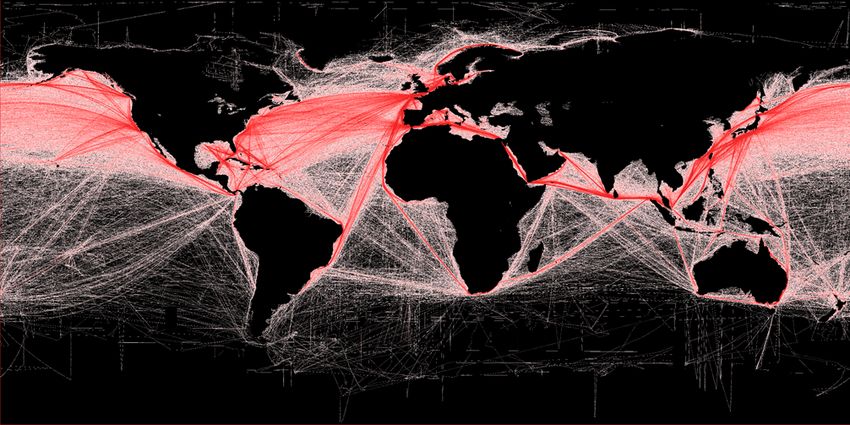
10

    is in place, including adequate procedures and lines of communication between ships and their managers
    ashore.

•   STCW (International Convention on Standards of Training, Certification and Watchkeeping for Seafarers,
    1978/1995/2010) establishes uniform standards of competence for seafarers.

•   ILO 147 (The ILO Merchant Shipping (Minimum Standards) Convention, 1976) requires national
    administrations to have effective legislation on labour issues such as hours of work, medical fitness and
    seafarers' working conditions. This was superseded by the ILO Maritime Labour Convention, 2006) which
    entered into force on 30 August 2013.

The diversity of regulations, dealt with on an international level, proves the necessity of this international
approach. Due to the multi modal aspect of shipping, regulations are best tackled in the International Maritime
Organization where 168 member countries decide on the regulations for shipping.

The history of shipping of the North Sea
The North Sea, though often an area of conflict, has an extensive history of common maritime commerce and
trade routes between its coastal nations, whose economies and industries started early to exploit its valuable
resources. The earliest records of Roman explorations of the sea begin in 12 BC. Southern Britain was formally
invaded in 43 AD and gradually assimilated into the Roman Empire, beginning sustained trade across the North
Sea and the English Channel. The Germanic Angles, Saxons, and Jutes began the next great migration across the
North Sea during the Migration Period, occurring between AD 300 and 500, conquering, displacing, and mixing
with the native Celtic populations. The Viking Age began in 793 AD and for the next two centuries the Vikings
ruled the North Sea.

From the Middle Ages until the end of the 15th century, and before the development of good roads, maritime
trade on the North Sea already connected the economies of northern Europe, Britain, and Scandinavia with each
other as well as with the Baltic and the Mediterranean.

The Netherlands and German speaking lands were the central hub for English Channels and North Sea coastal
trade. Organizations such as the Hanseatic League, growing from a few North German towns in the late 1100s,
aimed at protecting interests of the merchants and trade, also became increasingly prominent.
11
Dutch East and West Indies trading ships around 1650
Important overseas colonies, a vast merchant marine, and a powerful navy made the Dutch the main rivals of
growing England, which saw its future in these three spheres. This conflict was at the root of the first three
Anglo-Dutch Wars between 1652 and 1673. Scotland emerged a prominent economic power during the Scottish
Enlightenment of the 18th century. Between
1700 and 1815, the North Sea saw only 45 years
of peace, and this time could be regarded as the
most dangerous eras to sail the sea. Tensions in Dogger Bank incident
the North Sea were again raised in 1904 by the
Dogger Bank incident. However, the British did Tensions in the North Sea were again heightened in
1904 by the Dogger Bank incident, in which Russian
not face a challenge to their dominance of the
naval vessels mistook British fishing boats for
North Sea until World War I started in 1914.
Japanese ships and fired on them, and then upon
During the First World War, the North Sea
each other. The incident, combined with Britain's
became the main theatre of the war for surface
alliance with Japan and the Russo-Japanese War led
action. The Second World War also saw action to an intense diplomatic crisis. The crisis was
in the North Sea, though it was restricted more defused when Russia was defeated by the Japanese
to submarines and smaller vessels such as and agreed to pay compensation to the fishermen
minesweepers, and torpedo boats and similar
vessels.
After the war, the North Sea lost much of its military significance because it was surrounded by NATO member-
states only. However, it gained significant economic importance in the 1960s as several North Sea states began
full-scale exploitation of its oil and gas resources. The North Sea continues to be an active trade route. All
countries bordering the North Sea has claimed the 12 nautical miles (22 km) of territorial waters within which
they exercise exclusive fishing rights. Today, the North Sea has become far more important for economic
interests including grounds for fishing and exploitation of fossil fuel and renewable energy, than military
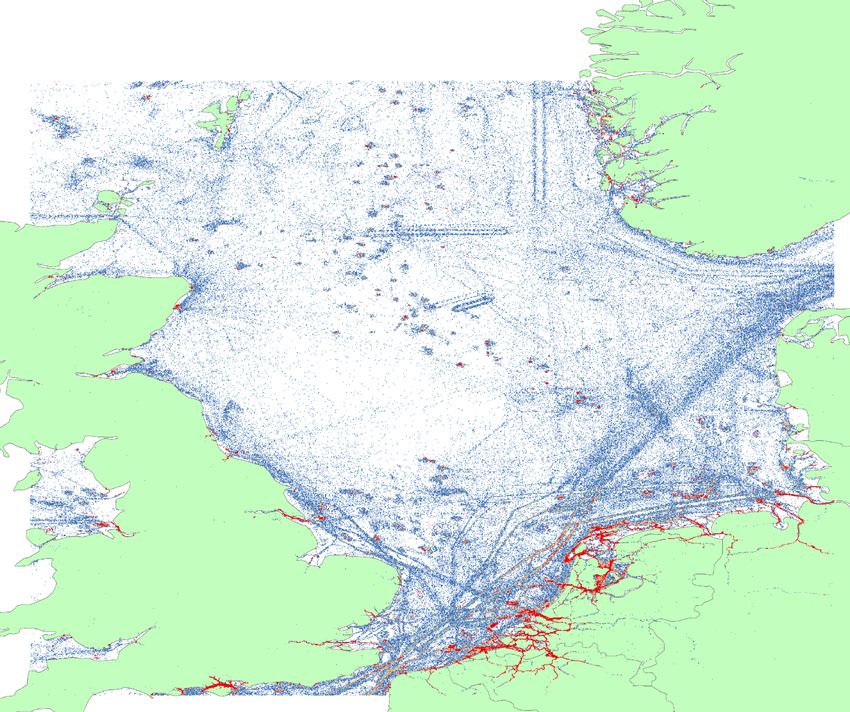
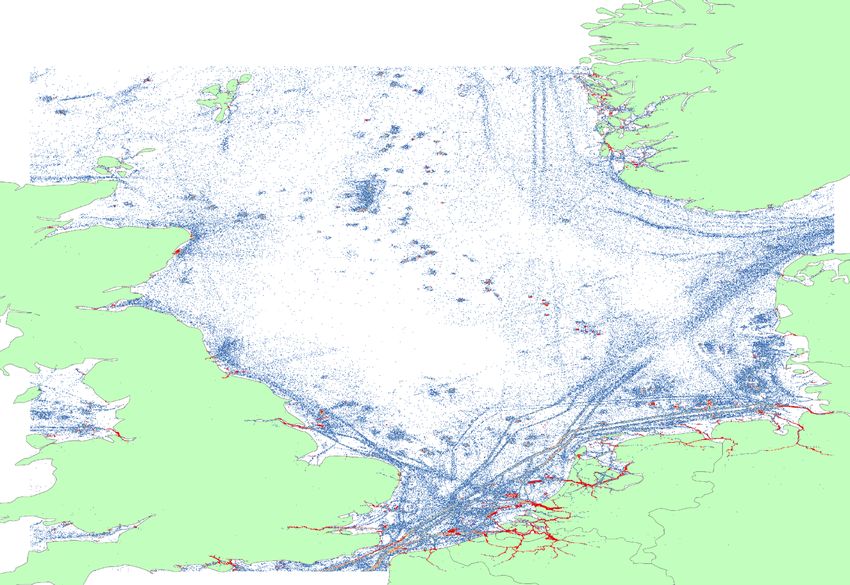
interests as its territorial expansion of the adjoining countries has ceased.12 II Spatial impact of current shipping activities Introduction As described above, the North Sea is currently, and has been historically, a sea with intense use and activity. Traditionally mainly used for fishing and shipping, other sea-based activities have progressively increased in number and in space- Examples of additional users are as off shore wind farms, aquaculture, marine protected areas and pipelines to mention a few. The increase in actors in general, as well as the increase of number of ships trafficking the North Sea raise some questions with respect to planning of activities, risk for interest conflicts as well as impact on the marine environment. In addition, given the transnational nature of shipping, questions regarding communication between states around the North Sea also arise. The chapter below intends to address these questions by first looking at the current maritime traffic across the North Sea followed by a description and analysis of designated shipping routes and possible incoherencies between these and the actual current traffic. As one of the main sea-based activities in the North Sea, off shore wind farms will also be taken into account in the analysis. Maritime traffic in 2016 Vessel traffic in 2016 has been plotted by EMSA (European Maritime Safety Agency) from AIS data in density map format. This density has been calculated based on number of signals per grid point during a two week period. Red dots in coastal and port areas represent a much higher density of ships compared to areas of blue dots. The four maps below represents seasonal variations in traffic in 2016. From a maritime spatial planning perspective, it is essential to look at seasonal variations in traffic intensity as it may allow for other parallel activities in place of shipping during some parts of the year, in specific areas.
13

                                              February 2016

The map shows vessel traffic for the first quarter of 2016, based on AIS data. It has been calculated using AIS
transponders on ships. The following ships are required to have a certain transponder:

    •   Ships of 300 gross tonnage (gt) and above engaged on international voyages
    •   Cargo ships of 500 gt and upwards not engaged on international voyages
    •   All passenger ships irrespective of size

The map clearly shows the predominant shipping routes on a North Sea Region scale.
14
May 2016
It is clear that all areas of the North Sea are predominantly occupied by shipping activities, although the highest
concentration of shipping activities are located along the coastal and central parts which are trafficked by transit
ships and supply vessels.15
August 2016
Summer months are clearly the busiest in all parts of the North Sea including the coast of UK, that is, the route
from the English Channel to the entrance of Skagerrak and around the south coast of Norway. Subsequently,
port areas and inland waters are also busier (red areas).16
November 2016
The last quarter of the year shows less activity as compared to other quarters. It is visible in particular in coastal
and inland waters as well as in the route from the English Channel to the northern part of Denmark.
AIS national data authority and supplier
As mentioned above the European Maritime Safety Agency (EMSA) tasked all national governments in the North
Sea to collect AIS information from their maritime areas and supplement it with data from other countries
through the North Sea Data Exchange Agreement between Belgium, Denmark, Faroe Islands, France, Iceland,
Ireland, Netherlands, Norway, Sweden, and the United Kingdom. The Helsinki Commission (HELCOM) has a
similar data exchange agreement between its member states Denmark, Estonia, Finland, Germany, Latvia,
Lithuania, Poland, Russia, and Sweden. This agreement also includes Norway, who is non-member.17
Shipping traffic is monitored via the Automatic Identification System (AIS). Regulation 19 of SOLAS
(International Convention for the Safety of Life at Sea, Chapter V) requires all ships of 300 gross tonnage (gt)
and above that engages on international voyages, cargo ships of 500 gt and above that does not engage on
international voyages as well as all passenger ships irrespective of size, to have an AIS on board. This
requirement became effective for all ships by 31 December 2004.
The table below shows national authorities in the North Sea countries that are responsible for collecting AIS
data as well as how they are supplied with data.
Country Responsible Authority for collecting and storing Data supplier
AIS data
Sweden Swedish Maritime Administration Network of shorebased AIS
stations
Norway Norwegian Coastal Administration Network of shorebased AIS
stations
Satelites
Belgium Flemish Region VTS service Network of shorebased AIS
stations
The Netherlands Rijkswaterstaat Water Verkeer & Leefomgeving Rijkswaterstaat, Coastguard,
(since 2014, previously the Coast Guard Port of Rotterdam, Scheldt
collected it and stored in MARIN) Radar Network
Uk Maritime and Coastguard Agency Network of shorebased AIS
stations
Satelites
Raw data is processed at Marine
Scotland
Denmark Danish Maritime Authority Network of shorebased AIS
stations
Germany The Federal Waterways and Shipping Network of shorebased AIS
Administration stations18
IMO routing measures and priority areas for shipping - Current
situation
Ships’ routing establishes an international predetermined path for ships to navigate in order to avoid
navigational hazards such as collisions and subsequent damages to ships, crew members, and the marine
environment. IMO is the only internationally recognized competent body for establishing such systems, and its
responsibilities are enshrined in the SOLAS convention Chapter V.
Traffic separation schemes as well as other ships’ routeing measures have now been established in most of the
heavily congested shipping areas around the world including the North Sea. In addition to the traffic separation
schemes, other ships’ routeing measures that exist include:
} Two-way routes
A two-way track for guidance of ships through hazardous areas.
} Recommended tracks
A route of undefined width, for the convenience of ships in transit, which is often marked by centreline buoys
} Deep water routes
Routes within defined limits which have been accurately surveyed for clearance of sea bottom and submerged articles
} Precautionary areas
An area within defined limits where ships must navigate with particular caution and within which the direction of
flow of traffic may be recommended
} Areas to be avoided
An area within defined limits in which either navigation is particularly hazardous or it is exceptionally important to
avoid casualties and which should be avoided by all ships, or by certain classes of ships19 Given the intense maritime traffic in the southern part of the North Sea the following ships’ routeing measures have been adopted by the IMO. IMO adopted routeing measures in the south North Sea (Source: IMO Ships Routeing measures 2017) Nationally designated priority areas for shipping In the national MSP plans, countries have designated certain areas as priority areas for shipping. This means that shipping is prioritized in these areas before other types of activities when planning for use and management of the area. However, other activities may take place as long as they do not interfere with shipping. Countries surrounding the North Sea have applied different criteria for designating priority areas for shipping. Below is a description of the basis on which the different countries designation priority shipping areas, as well as maps that shows where these areas are located. Priority and reservation areas are recurring terms used in text.
20

                                                    Belgium

All dark blue lines are designated priority shipping. This implies that activities that have the potential to
interfere with shipping cannot occur in these areas, but does not mean that these areas are exclusive to shipping.

The designation of these corridors is mainly based on AIS records. The spatial distribution of corridors often
highlights the importance of good accessibility to the ports. Consideration was given to the economic
implications for the ports if ships divert from their traditional routes as a result of obstructions such as offshore
wind farms.
21
Germany
Germany uses three types of zoning for the implementation of its spatial plans. These include “priority areas”
where one use (for example shipping, pipelines, etc.) is granted priority over all other spatially significant uses;
“reservation areas” where one use is given special consideration in a comparative evaluation with other spatially
significant planning tasks, measures and projects; and “marine protected areas” where measures are applicable
for the reduction of impacts (e.g., through pollution) on the marine environment.
Priority and reservation areas are based on the width and location of existing IMO routes as well as the current
shipping traffic density as of 2009, but also aiming at securing space for anticipated increasing / changing sea
traffic (e.g. traffic avoiding future obstacles such as offshore wind farms; Arctic routes opening). Reservation
areas provide additional space where shipping is agreed on as most important compared to other non-
compatible uses, e.g. as manoeuvring space, resulting in any ban of fixed installations within these areas.22
Netherlands
In the Dutch part of the North Sea, routing measures and other measures apply (such as clearways and anchorage)
for the purposes of regulating maritime traffic:
The traffic separation scheme (TSS) and accompanying ‘precautionary areas’ and inshore traffic zones have been
established by the International Maritime Organisation (IMO) of the United Nations. The objective of these
systems is to regulate traffic so as to prevent vessel collision.
Precautionary areas are areas where vessels must take extra care, as multiple traffic separation schemes
converge here.
Tankers in the Dutch part of the North Sea are obliged to follow the deep-water routes designated by the IMO.
Furthermore, tankers are under an obligation to take the shortest routes when approaching a port from a deep-
water route and vice versa. The reason for setting mandatory routes for tankers is the status of the Wadden Sea
as a Particularly Sensitive Sea Area (PSSA). In order to protect this PSSA, the deep-water route is located further
out from the coast, ensuring that any oil discharged as a result of an accident can be combated before it reaches
the protected area.
Clearways are shipping zones between traffic separation schemes in which mining installations may not be built.
Vessels are not obliged to use these areas. Recognising that these areas must remain free of obstacles, a
clearway holds the status of recognised sea lane essential for navigation as referred to in the United Nations
Convention on the Law of the Sea. The clearways have been established in the regulations accompanying the
Mining Act.23
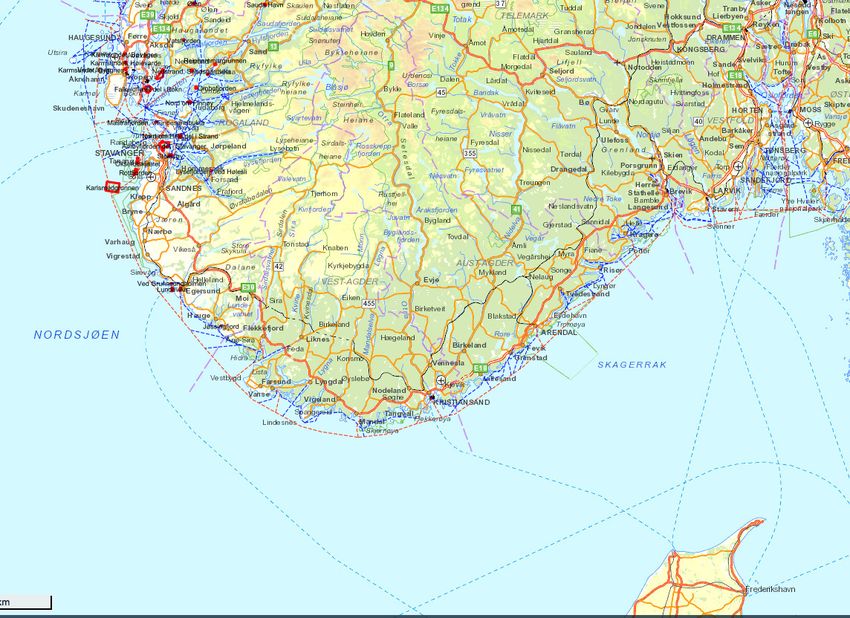
Norway
Norway has divided its nationally designated shipping routes into two categories; primary and secondary
fairway. The main reasons behind the establishment of this structure was:
• To be able to define, in a standardized way, routes and ship usage areas in coastal areas.
• To be able to define and assign responsibilities between municipalities and the state.
• To be able to establish a coordinated definition of different route categories so as to plan and prioritise the
means in the best possible way.24
Sweden
The dark grey marks the areas where shipping has priority over other activities. As described in the cases of
other countries, priority areas for shipping in Sweden also doesn’t prevent other activities from using the space.
It merely indicates that in case of several competing interest in the same area, shipping should be given priority.
Denmark
Denmark is in the process of developing a MSP plan. Priority areas for shipping has not yet been made publicly
available. In 2018, mapping and information gathering necessary for generating the plan will be done i.e. data
on existing uses and conditions as well as data on future uses and developments. A draft plan is intended to be
ready for an SEA and a public hearing in 2019.25 Shipping and off-shore wind farms in transnational MSP Given the large number of off shore wind farms in the North Sea, and the implications it may have for shipping, it is interesting to look closer into how national authorities in the North Sea countries have considered shipping in relation to OWF in the development of their respective MSP plans, as well as if any consultations were done between neighbouring countries in this respect. Transnational dialogue In order to better understand if and/or how transnational dialogues were held regarding shipping and OWF interviews were conducted for the purpose of this report with key representatives from the authorities responsible for MSP in each country. All respondents of the interviews said that transnational dialogues were held with neighbouring countries with regards to shipping and OWF. However, not in all cases did the dialogues take place within the framework of MSP but rather on a sectorial basis. For example, triggered by the establishment of new OWFs on the border between Belgium and the Netherlands, a common platform for stakeholder discussions was established. The initiative was taken by the Belgian Federal Government Service for Mobility Director General Maritime Transport and also included stakeholders such as ports, pilot associations, coast guards and regions. Discussions in this platform focused mainly on safety issues with regards to the newly designated wind farm areas and the spatial needs of shipping in the same area. Some of the main concerns that were expressed by the different countries during the transnational consultations were pointed out in the course of the interviews. Given the limited sea area of Belgium, one of the critical issues is the determination of optimal safety distances between ships and OWF. In contrast to the Netherlands, Belgian authorities have opted for 500m safety distance between their shipping lanes and OWFs, whilst the Dutch opt for at least 1.87 NM. From the Dutch authority, an important concern in the transnational consultation with Belgium was whether or not to allow small vessels access through the OWF. In Belgian waters, vessels are not allowed access through the OWF, this in turn poses problems for ships passing through the border area. In German consultations with neighbouring countries, harmonization of the width of designated shipping lanes in the MSP between Germany and Holland and Denmark was raised as a main concern (see map below for inconsistencies. As for disagreements between neighbouring countries, two cases were pointed out. In the consultations between the Netherlands and Belgium, Dutch pilot associations raised concern over compulsory pilots on-board the ships and in the case between Germany and Poland, an unclear border area was cited as reason for disagreements. Besides the officially designated IMO routes, all countries responded that they had designated other areas with priority for shipping as well. This is also shown on the maps below in blue. with regards to how the interviewees regarded the efficiency of the transnational dialogues on shipping and OWF, no country expressed any discontent on how they were done and no concrete improvements were suggested to facilitate the dialogue.
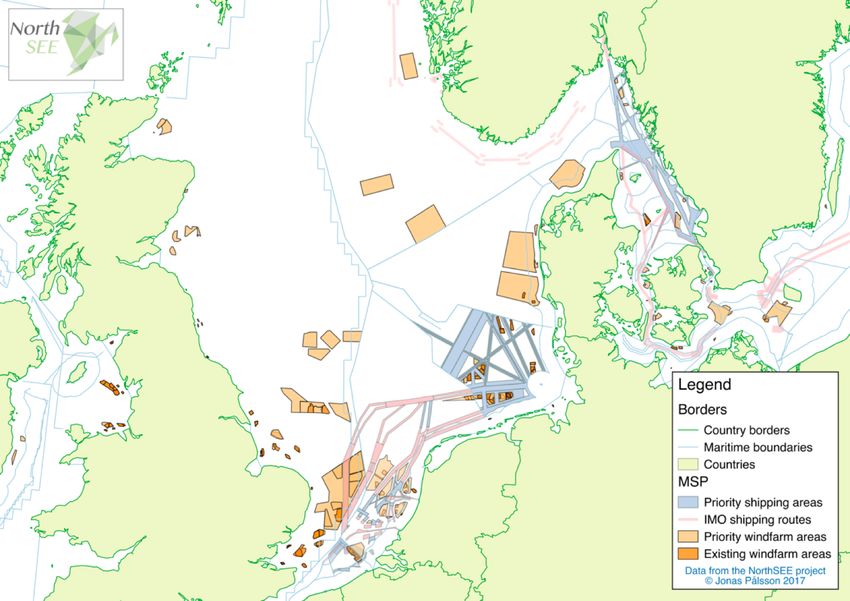
26

Designated areas for shipping and OWF in MSP plans

North Sea map showing wind farms and shipping routes.

The map shows designated IMO shipping routes, priority areas for shipping and off-shore wind farm areas for
the North Sea countries, as they appeared in the respective countries’ MSP plans in 2016. In the priority areas
for shipping some inconsistencies are visible which will be further described below.
27

South North Sea

The map shows a more detailed view of the southern part of the North Sea including shipping routes and off-
shore wind farms.
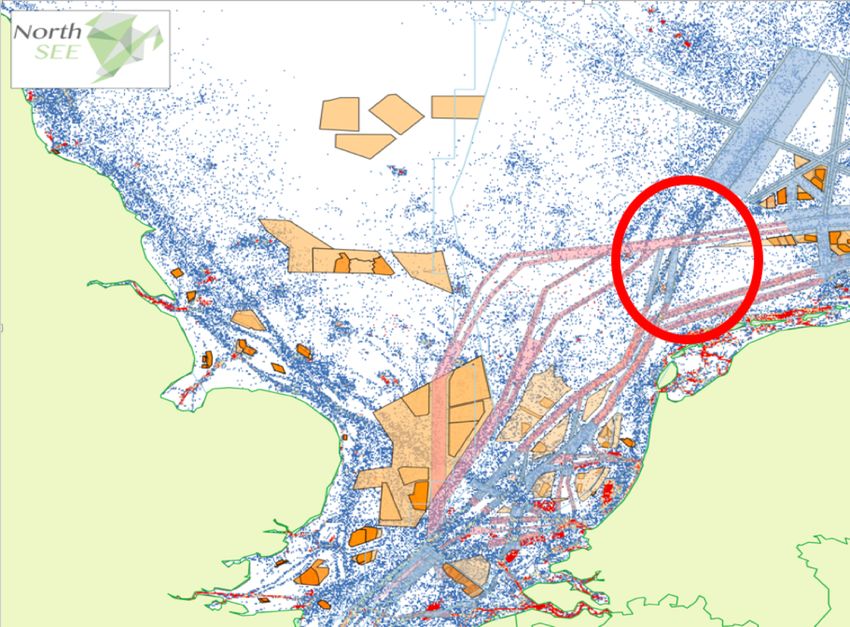
28

AIS data and MSP plans
In developing a GIS map showing maritime traffic, IMO routeing measures and other designated priority areas
for shipping, some inconsistencies became evident between what the AIS data shows and what is presented in
the MSP plans.

The red circle highlights an area where both intense shipping takes place at the same time as it is designated
as areas prioritized for wind farms. It should be emphasised however that Denmark has at the time of writing
this report no MSP plan in place and the areas marked for off shore wind farms are hence not part of a MSP
plan. Yet, it is still noteworthy that the circled area is subject to interest for both shipping and exploitation of
off shore wind farms.
29

The red circle highlights a discrepancy between the direction of the designated shipping route (blue route) and
the ship traffic (blue dots). Although there can be seasonal spatial variations in the maritime traffic, in this case
the discrepancy remained even when applying different seasonal AIS maps.
30

Summary of chapter II
  }   AIS data on vessel traffic in the North Sea shows that the area is intensely trafficked throughout the
      year, with certain increases in the summer months. In the south part and along the coasts shipping is
      more intense than in other areas.
  }   Ships’ routing measures were originally established for safety reasons and points out a predetermined
      route for ships to sail in order to minimize risk of accidents and other hazards. IMO is the only
      international body recognised for establishing ships’ routing measures. Several routing measures are
      established in the North Sea, in particular in the southern parts.
  }   Individual states have designated certain areas of their sea areas as priority areas for shipping. In these
      areas, shipping is granted priority over other sea-based activities.
  }   North Sea states have had transnational dialogues with regards to planning and designation of shipping
      routes and OWF. However, these consultations did not always take place under the umbrella of MSP
      but more on a sectorial basis.
  }   Sectorial consultations, as opposed to MSP discussions, run the risk of not taking into consideration
      effects of sectorial activities on other activities.
  }   The absence of a common North Sea platform for MSP discussions on shipping and OWF was not
      pointed out as a concern or problem during the interviews carried out with MSP authority
      representatives in the North Sea countries.
  }   The EU directive on MSP promotes it as a tool which will provide a holistic approach to management
      of sea uses.
31
III The spatial impact of future shipping activities
Drivers and enablers for future shipping activities
Consumer behaviour
The major influences on the changes and behaviour of ship owners and merchants are market driven.
From the Greeks and Vikings to the British merchants who created the East India Trading Company, shipping
has always played a key role in delivering all kind of goods around the world.
Today refrigerated freighters, container ships, car carriers and super tankers transport 90% of the world’s food,
products and energy. Thus, the world’s shipping industry has played an incredibly key role and helped transform
the global economy along the way. Each year, some 86,000 ships move more than 9 billion tons of cargo – more
than a ton for each person on the planet – across our seas each year.
Throughout history the oceans have been important to people
around the world as a means of transportation. Unlike a few
THE VILLAGE CALLED THE decades ago, however, ships are now carrying goods rather than
WORLD people. Since the rise of intercontinental air travel, sea travel has
Real globalization started in the first half become limited to shorter trips (ferry services across the Baltic and
of 90’s. World merchandise trade and North Seas, the Mediterranean, Japan and Southeast Asia) and
world seaborne trade followed the recreational cruises. The latter have recently experienced a
growth of the world GDP for a long time. tremendous boom and represent an increasingly lucrative source
But during the first half of the 90’s they of tourist income. As markets became increasingly globalized,
split. World merchandise trade and shipping volumes soared. From the 1950s to the latest global
seaborne trade grew faster than the economic crisis, the growth rate of international trade was almost
world GDP and the GDP of the consistently twice that of economic activity as a whole. From 2000
industrialized countries. This is the real to 2008 the world trade increased by an average of 5.4% each year,
start of globalization. This is point where while the economic activity, as measured by the global Gross
the world became a village. You can by
Domestic Product (GDP), increased by only 3% each year. Due to
any product from all over the world for a
the spectacular rise of trade vis-à-vis economic growth, world
fair price.32
trade since the 1950s has more than tripled to 45% of the global GDP, while goods destined for the processing
industry have in fact more than quadrupled.
With respect to the value of the goods, about 23% of world trade is between countries with a common border.
This percentage has remained fairly constant over the recent decades. Between continents, however, it differs a
great deal depending on their level of development. In Europe and North America the proportion is the highest
at 25 to 35 per cent. This trade is predominantly transacted by road and rail. Cargo between countries without
a common border is carried out mainly by sea, although increasing quantities of manufactured goods are being
forwarded by air. Growth rates for air freight are more than twice as high as those for shipping in recent years.
The dominant mode of transport depends on the (relative) transportation costs and the value-to-weight ratio of
the goods – the higher the value per unit of weight, the less significant the cost of transportation. Punctuality
and reliability are considered more important for valuable commodities.
COST OF TRANSPORT
The reason for the rise of seaborne
trade is the low transport cost per
product. Only 1% on average of the
price paid in the shops is transport cost.
So for the seller this means that he can
sell his product anywhere in the world
at a profitable price and offering the
same quality as the local product.
Unctad, review marine transport, 2017
According to research by economists, higher-income households purchase higher-quality products. The
residents of wealthy countries therefore tend to buy more quality goods. Accordingly, rising incomes influence33
the demand for transport in three ways. First, quality goods are more expensive. This means their value-to-
weight ratio is higher and the cost of transporting them is lower as compared to their value. Second, as incomes
rise, consumers are more likely to purchase expensive products and fancy goods. At the same time, they expect
to receive the articles within a very short time. Third, the delivery period in itself is a key element of product
quality, having an increasing influence on purchasing decisions; customers are no longer prepared to tolerate
long delays. All of these factors have contributed to the even higher growth rates of air freight in comparison
to shipping.
World AIS map, 2016
Localization
“Buying local”, consumers’ appetite for local foods is exploding. Not only has there been huge growth in the
number of farm-to-table restaurants and farmers’ markets, but grocery chains and big box retailers are elbowing
their way in, aggressively expanding and marketing their locally grown offerings for sale.
Factors fuelling the hunger for local foods
Millennials love local: Today’s Millennials value authenticity and locally made products. They are leading the
“buy local” movement which has doubled in size in the last 10 years, according to AdWeek. Edelman Digital
found 40% of Millennials prefer to shop local, even if it costs more.
Consumers associate local with “fresh”: Nearly all consumers (93%) associate local with “fresh,” the primary
purchasing factor for grocery consumers. That might explain why, regardless of the category, 78% of consumers
are willing to pay a premium of 10% or more for local food, up from 70% in 2014. Surprisingly, even lower-
income grocery shoppers say they (63%) would pay more for local food. The availability of local foods also
impacts retailers’ brand loyalty, as almost 30% of grocery shoppers say they consider purchasing food elsewhere
if their preferred store does not carry local foods.
Farmers markets: Strong demand for local foods has driven increase in the total number of farmers markets
between 1994 and 2013. This explosive growth has prompted suppliers, grocers and restaurants to adapt by
adding locally produced food offerings all year round.34
Environmental benefits: local foods are produced as close to home as possible. Buying local supports a more
sustainable food system by going beyond the methods used in food production to include every step that brings
food from farm to plate, first and foremost, transportation. Sustainable agriculture involves food production
methods that are healthy - including reduction of pesticide use – balances demand based on local needs,
involves less environmentally harmful equipment and practices, and most importantly, reduces impacts on the
environment by decreasing transportation needs.
Effect on growth shipping industry
Globalization and localization are both trends, amongst many others, that influence the possible growth of the
shipping industry. If we take a look at the growth of the respective shipping market, we might predict some
trends for the future.
For almost a decade, the world has struggled to cope with huge changes and challenges brought up by the crash
of the financial market in 2008. The resulting issues have not always been dealt with in the best possible way,
leaving many large economies still in ‘recovery’ mode.
The full restoration of shipping markets will need several years of solid improvements to lift fleet utilisation
rates. Sector overcapacity almost everywhere must be reduced. Governments’ support for any industry –
including shipping – which is feeling the heat of global competition, might seem like a good thing. But direct
subsidies from governments in fact have a negative impact on the global shipping industry as they affect free
trade and undermine the level playing field for businesses.
Global GDP growth is currently driven by service sectors and developing/emerging economies which result in a
lower “GDP-to-trade multiplier”, and thus, generate a lower level of shipping demand than we have been
accustomed to in the past.
Conclusion and effect on MSP
The shipping industry is highly market driven. Consumer behaviour, such as the demand for foreign products or the
wish for local products, as well as timely vs. cheaper transport all has an effect on the growth of shipping industry.
It an be expected that the growth of the shipping industry, and most significantly the quantity of the global fleet,
will be limited.
To remain competitive, ship owners must scrap a lot of their old vessels when building new ones. By this, the total
number of ships will mostly stay the same, with the exception of the tanker fleet which is growing at the moment.
If fleets of old ships are constantly replaced by modern ones, the positive effect of demolishing the old fleet is that
the ships sailing around are modern and eco-friendly.
The number of ships sailing the North Sea will be dependent on the development of the EU market. If the
demand for foreign goods is low, the number of ships will be low as well. To lower the costs for transportation,
shipping companies increasingly use one larger vessel to go to major ports instead of having several smaller
vessels going to different ports. The dispersion of the goods is then done with smaller short sea ships.35 New Ship design Ship designers try to develop new designs to cope with these problems. For example: A research consortium that includes GTT, CMA- CGM and DNV GL recently unveiled the design schematic of Combined Gas Turbine and Steam (COGAS) powered mega-size 20,000 TEU container ship to be fuelled by LNG. It also include an articulated or coupled two-unit container ship to operate major Asian – European trade routes. The rear section of such a concept ship could be loaded at the Port of Shanghai while the forward section would be loaded at the Port of Hong Kong after the rear section has sailed from Shanghai, with the two-unit European bound ship-train being coupled at Hong Kong. The articulation coupling would be designed to allow the trailing vessel to sail in the hydraulic “shadow” of the leading vessel to reduce the fuel consumption of the trailing vessel by 70 to 80 percent. While the power of two engine systems would be required to accelerate the coupled ship, energy consumption would decline as the coupled maritime assembly reaches its cruising speed, perhaps allowing the output of a single engine assembly to provide 100 percent of propulsive power as well as auxiliary power. Power cables and a telecommunications line would connect across the articulation between the two units. While at cruise, computer-controlled electrically-powered propellers (azipods) on both leading and trailing sections would provide both propulsion as well as directional control, allowing the design of the articulation coupling to include flexibility for relative pitching motions, relative yawing motions and even relative rolling motions. Manpower cost and fuel cost are the dominant cost items when a ship sails at sea and a coupled-articulated container ship would offer substantial savings in terms of transportation cost per container while sailing between pairs of nearby super-ports at the Asian and European ends of the voyage. There are several pairs of Asian major super-ports that are located within relatively close proximity to each other as well as a pair of major European super-ports at Hamburg and the Netherlands. Several of these ports also serve as maritime – maritime transshipment ports where local, inland and coastal vessels interline with mega-size oceanic vessels. The mega-terminal at Port of Colombo, Sri Lanka serves the container transshipment needs of several nations that include Pakistan, India, Bangladesh, Myanmar and Western Thailand while the Port of Singapore can serve the transshipment requirements for nations that include Malaysia, Indonesia, Kampuchea, Vietnam and the Philippines. The rear section of a two-unit ship train could sail from Singapore to Colombo within 72 hours, Taipei to Hong Kong within 36 hours, Busan to Shanghai within 24 hours or Hamburg to Rotterdam within 24 hours. The major section of the voyage would involve greatly extended distances that allow a two-unit ship-train to realize savings in terms of manpower and fuel consumption. Coupled super-size container ships would have to sail via the Suez Canal to European ports as well as to a possible east coast North American super port, the proposed Nicaragua Canal perhaps being unsuited to transit ship-trains The future prospect of two-unit mega ships carrying in excess of 35,000 TEU sailing extended voyages and connecting pairs of nearby super-ports at points of origin and destination would place high demand for service on local interconnecting maritime services. Several studies undertaken in the United States indicated that on container loads exceeding 500 TEU that coastal maritime service and inland waterway maritime service realized lower transportation cost per container. Europe’s barge canal system connects to several major ports that include Hamburg and Rotterdam while navigable rivers connect to the Chinese ports of Hong Kong, Shanghai and Tianjin. Major navigable rivers extend inland into Pakistan (Indus), India (Ganges), Thailand (Pa Sak), Bangladesh (Brahmaputra), Vietnam/Kampuchea (Mekong) and Myanmar (Irrawaddy) to allow river vessels to interline with coastal ships that will in turn connect to major super ports. A two-unit mega ship arriving at a super port along North America’s east coast could place new emphasis on that region’s coastal ship services with potential to greatly increase the volumes of container traffic shipped along the St Lawrence Seaway. Future summer melting of ice on the deep-draft Canadian side of Arctic could open a northern passage for two-unit super ship. (Marasinews)
36

Ship sizes
Bigger and better - trend is largely a result of containerization and automation which enables the faster
loading and discharging of vessels. Since the beginning of this trends, ships have become bigger and
longer. Only a few years ago, ships of 10.000 TEU were science fiction. Today, ships of 20.000 TEU are
sailing our waters. Every year new plans are created to outsize the currently available megaships and
apparently the sky is the limit. However, the sky at sea might be the limit, the ports aren’t. These ships
find more and more difficulties to enter ports, because of limited maneuverability or draught.

This trend will most likely continue. The new container ships from CSCL (China Shipping Container Lines), which
at 19,100 TEU look set to surpass Maersk Line's Triple-E series, which will not be the world's biggest container
ships for long. The 22,000 TEU container ships that industry rumours say are underway will also not be able to
hold this position for long. This is because there are even bigger ships on the way to the world seas, and these
behemoths will be able to carry 24,000TEU, according to Lloyd’s Register.

The next generation of giant ships will of course also bring certain challenges, e.g. with regard to technic.
The ships can be built in a highly functional way but may create problems in the port terminals. For instance,
the massive ships would be able to transit the Suez Canal in terms of draft, but there is a bridge that spans
the canal and the ships would likely have difficulties getting under this.

Several ports will experience problems related to draft, for instance, in the Port of Hamburg where the river
Elbe is constantly dredged to make room for the new ultra-large vessels that are already sailing the world
seas.

Although the limits might be reached as the possibility to react flexible on market changes reduces with
size. According to Maersk Line CEO Søren Skou, the ships could become so big that their size could seriously
weaken their flexibility, especially in terms of ports and call options, and that this could water down the
potential unit cost reductions that could be gained from using bigger ships.
37

For the next few years, ports and authorities must be prepared for more and bigger ships. According to
Lloyd’s register, more than 60 mega ships, with lengths over 400m, are being built at the moment.

Short Sea Shipping
The trends of possible limits of the access of large container vessels into ports show a possible growth of
short sea shipping. Large container vessels will make berth in major hubs like Rotterdam. For the
transportation of the goods, further inland or to other smaller ports, smaller, more fuel efficient vessels
can be used. These vessels will naturally use shipping lanes that are closer to shore.

The EU statistical findings show the trends in short sea shipping from 2005 until present (see Tab. 1). This
trend in addition to the knowledge about newly built ships can help to predict the possible future trends in
short sea shipping.

Main EU statistical findings on Short Sea Shipping
The total gross weight of goods transported as part of EU short sea shipping is estimated at 1.8 billion tonnes
of in 2015, an increase of 0.9 % in comparison to the previous year. The overall increase in short sea shipping
recorded by the main EU ports seemed to consolidate the gradual recovery seen in EU short sea shipping
following the economic downturn in Europe in 2009. Even so, the 2015 level of EU short sea shipping still
remained below the levels recorded in the years immediately preceding the economic downturn

Tab. 1: Short Sea Shipping (SSS) of goods by reporting country and direction, 2005-2015 (gross weight of goods in Mio tonnes), Source: Eurostat

Short sea shipping made up close to 59 % of the total maritime transport of goods to and from the main EU
ports in 2015, about the same as in 2014. However, the share of short sea shipping in total maritime transport
38

varies considerably between the reporting countries. The predominance of short sea shipping of goods over
deep sea shipping was particularly profound in Bulgaria, Denmark, Estonia, Ireland, Greece, Croatia, Italy, Cyprus,
Latvia, Lithuania, Malta, Poland, Romania, Finland, Sweden, the UK and in the EFTA country Norway, all with
short sea shipping shares of 70 % or more in their main ports.

The top 20 ports accounted for 37 % of the total short sea shipped goods handled in the main EU-28 ports in
2015 (see Tab. 2). Rotterdam in the Netherlands remained the largest EU port for short sea shipping, handling
a total of 204 million tonnes of short sea shipped goods in 2015. Among the other top three ports, Antwerpen
in Belgium handled 97 million tonnes of short shipped goods in 2015 and Hamburg in Germany handled 50
million tonnes accordingly.

A few of the main deep sea hub ports, such as Rotterdam and Hamburg, as well as Amsterdam in the Netherlands
and Algeciras and Valencia in Spain, handle more deep sea shipping than short sea shipping of goods. In contrast,
all the other top 20 ports for short sea shipping handled more short sea shipped goods than deep sea shipped
goods.

At 135 million tonnes, Rotterdam handled more than 13 % of the total short sea shipped liquid bulk goods
reported by the main EU ports in 2015, by far the largest volume of short sea shipped liquid bulk for any EU
port. With 19 million tonnes, Riga in Latvia confirmed its position as the EU’s largest port for short sea shipping
of dry bulk goods. Antwerpen remained the EU’s largest port for short sea shipped goods in containers with 43
million tonnes, while Dover remained the largest port for short shipped goods on Ro-Ro units with 27 million
tonnes.

These statistics show a slow increase of Short Sea Shipping over the last 10 years. However new technologies
and new strategies of the ship owners suggest an even larger increase over the following years.

Green innovative sector
Over the past decades short sea operators have been investing heavily in the greening of their fleets.
Considerable resources and efforts are spent on innovative, green vessels and techniques.

Ferries often remain in a port for an average of six hours and during this time electricity is necessary to run on-
board systems, such as heating and galley equipment.

1. Stena Line invested in the infrastructure needed to power two vessels at the same time from the local grid
while berthed in the port of Hoek van Holland. As the electricity grid is 50Hz and the on-board ship systems are
mostly 60Hz, considerable additional investment was needed on the vessel and ashore. Using the system for a
minimum of 80% of the port time reduces the NOx, SOx, PM (dust) and emissions by 80%.

2. The Dutch shipyard Ferus Smit delivered in 2015 to the SSS joint venture of Erik Thun A.B. and KG Jebsen
Cement a dedicated 7,200 DWT cement carrier, the “Greenland”, powered by LNG. This is the first LNG powered
short sea dry cargo vessel to date. But more are being built at the moment.

3. DFDS is a pioneer in relation to scrubber technology. In 2009 an exhaust gas scrubber able to remove SO2
(Sulphur dioxide) was developed and installed as a retrofit onboard the vessel Ficaria Seaways. From 2009 to
2012 it had been in operation for 5630 hours. The obtained results showed that it was possible to reduce the
SO2 level to under 19 ppm in the exhaust gas. This corresponds to below 0.1 % sulphur in the fuel. The use of
scrubbers became more widespread thanks to the project on Ficaria Seaways.
You can also read