Trends in abdominal aortic aneurysm-related mortality in Brazil, 2000-2016: a multiple-cause-of-death study - FSP/USP
←
→
Page content transcription
If your browser does not render page correctly, please read the page content below
ORIGINAL ARTICLE

Trends in abdominal aortic aneurysm-related mortality
in Brazil, 2000–2016: a multiple-cause-of-death study
Augusto Hasiak Santo0 0 -0 0 -0 0 -0 0 ,I,* Pedro Puech-Leão0 0 -0 02-6450-3825 ,II Mariana Krutman0 0 -0 02-6450-3825 III
I
  Associate Professor (retired), Departamento de Epidemiologia, Faculdade de Saude Publica, Universidade de Sao Paulo, Sao Paulo, SP, BR. II Departamento
de Cirurgia, Faculdade de Medicina FMUSP, Universidade de Sao Paulo, Sao Paulo, SP, BR. III Hospital AC Camargo Cancer Center, Sao Paulo, SP, BR.
Santo AH, Puech-Leão P, Krutman M. Trends in abdominal aortic aneurysm-related mortality in Brazil, 2000–2016: a multiple-cause-of-death study. Clinics
(Sao Paulo). 2021;76:e2388
*Corresponding author. E-mail: auhsanto@usp.br

     OBJECTIVES: Remarkable changes in the epidemiology of abdominal aortic aneurysm (AAA) have occurred in
     many countries during last few decades, which have also affected Brazilian mortality concurrently. This study
     aimed to investigate mortality trends related to AAA mortality in Brazil from 2000 to 2016.
     METHODS: Annual AAA mortality data was extracted from the public databases of the Mortality Information
     System, and processed by the Multiple Cause Tabulator.
     RESULTS: In Brazil, 2000 through 2016, AAA occurred in 69,513 overall deaths; in 79.6% as underlying and in
     20.4% as an associated cause of death, corresponding to rates respectively of 2.45, 1.95 and 0.50 deaths per
     100,000 population; 65.4% male and 34.6% female; 60.6% in the Southeast region. The mean ages at death
     were 71.141 years overall, and 70.385 years and 72.573 years for men and women, respectively. Ruptured AAA
     occurred in 64.3% of the deaths where AAA was an underlying cause, and in 18.0% of the deaths where AAA
     was an associated cause. The standardized rates increased during 2000–2008, followed by a decrease during
     2008–2016, resulting in an average annual percent change decline of -0.2 (confidence interval [CI], -0.5 to 0.2)
     for the entire 2000–2016 period. As associated causes, shock (39.2%), hemorrhages (33.0%), and hypertensive
     diseases (26.7%) prevailed with ruptured aneurysms, while hypertensive diseases (29.4%) were associated with
     unruptured aneurysms. A significant seasonal variation, highest during autumn and followed by in winter, was
     observed in the overall ruptured and unruptured AAA deaths.
     CONCLUSIONS: This study highlights the need to accurately document epidemiologic trends related to AAA in
     Brazil. We demonstrate the burden of AAA on mortality in older individuals, and our results may assist with
     effective planning of mortality prevention and control in patients with AAA.

     KEYWORDS: Abdominal Aortic Aneurysm; Mortality Trends; Cause of Death; Seasonality.

’ INTRODUCTION                                                                                 In the past several decades, a dramatic change in the
                                                                                            epidemiology and management of AAA has occurred in
   An abdominal aortic aneurysm (AAA) is a permanent and                                    developed Western countries. The increasing incidence
irreversible localized dilatation of the abdominal aorta,                                   and mortality have been replaced by decreasing incidence
resulting in an aortic diameter greater than 1.5 times the                                  and mortality, which has been termed ‘‘the epidemiological
expected normal. The most common site for AAA develop-                                      transition’’ in AAA (4). The decrease in deaths related to
ment is the region distal to the renal arteries, with an average                            AAA is a result of reduced exposure to risk factors, use of
diameter of approximately 2 cm. In clinical practice, if the                                cardioprotective and antihypertensive drugs, population
diameter is X3 cm, the infrarenal aorta is considered                                       screening, increased availability of diagnostic imaging, and
aneurysmal (1,2). Moreover, the risk of rupture, which                                      innovative, minimally invasive endovascular treatment
causes massive internal hemorrhage, is a significant concern,                               modalities. A decline in mortality was confirmed in most
and, without prompt treatment, death can occur rapidly,                                     parts of the 19 countries of the World Health Organization,
with fatality rates reaching 82% (3).                                                       notwithstanding the heterogeneity of standardized trends,
                                                                                            with the United States and United Kingdom recording
                                                                                            declines, and Hungary, Romania, Austria, and Denmark
                                                                                            recording increases (5). However, the situation may be
Copyright & 2021 CLINICS – This is an Open Access article distributed under the             different in other areas of the world, such as Latin America
terms of the Creative Commons License (http://creativecommons.org/licenses/by/              and high-income Asian-Pacific countries, where the preva-
4.0/) which permits unrestricted use, distribution, and reproduction in any
medium or format, provided the original work is properly cited.                             lence may be increasing (6).
                                                                                               A trend analysis of aortic aneurysm and dissection-related
No potential conflict of interest was reported.
                                                                                            mortality in the state of São Paulo, Brazil from 1985 to 2009
Received for publication on September 24, 2020. Accepted for                                revealed a significant increase in age-standardized death
publication on November 5, 2020                                                             rates in men and women for the entire period, while certain
DOI: 10.6061/clinics/2021/e2388                                                             non-significant decreases occurred from 1996 and 2004

                                                                                        1
Abdominal aortic aneurysm-related mortality                                                                     CLINICS 2021;76:e2388
Santo AH et al.

until 2009. Regarding AAA, significantly increased annual              (a), (b), (c), and (d) of Part I and Part II of the medical
percent changes of 2.4%, 2.4%, and 3.2% were verified                  certification section of the death certificate.
for total mentions in death certificates, overall, and in men             The causes of death were automatically processed with
and women, respectively (7). Based on the three studies                the Underlying Cause Selector (Seletor de Causa Básica SCB)
referred to in the above analysis, a literature search for             software (15). Automatic processing involves the use of
observational studies on prevalence and mortality rates                algorithms and decision tables that incorporate the WHO
in non-European populations from 1983 to 2013 found a                  mortality standards and the etiological relationships among
prevalence trend in Brazil over a period of 16 years from              the causes of death. The expressions ‘‘death from’’ and
2.1% to 6% (8–11).                                                     ‘‘death due to’’ refer to the underlying cause-of-death,
  This study aimed to investigate the trends and causes of             whereas ‘‘deaths with a mention of’’ and ‘‘mortality related
death related to AAA mortality in Brazil from 2000 to 2016             to’’ refer to the listing of a given condition, either as the
using a multiple-cause-of-death methodology.                           underlying cause or as an associated cause. The causes of
                                                                       death evaluated in the present study were those mentioned
’ METHODS                                                              in the medical certification section, which are known
                                                                       internationally as ‘‘entity axis codes,’’ defined and presented
   Brazil, officially named the Federative Republic of Brazil,         under the structure and headings of the ICD (16).
is the fifth largest country in the world, covering a total               Using mortality rates, proportions, and historical trends,
territory of 8.5 million km2, with the sixth largest population,       we studied the distributions of the following variables: sex,
with an estimated 210 million inhabitants as of 2019. The              age at death (in 5-year age groups), year of death, underly-
country is politically and administratively divided into 27            ing cause of death, associated (non-underlying) cause(s) of
federated units (26 states and the Federal District) and 5,570         death, total mentions of each cause of death, mean number of
municipalities. The 27 federated units are grouped into five           causes listed per death certificate, seasonal variation of
geographic regions: North, Northeast, Southeast, South, and            deaths, and geographical distribution of deaths. For seasonal
Central-West.                                                          analysis, deaths were grouped as follows: summer, Decem-
   The annual mortality data was extracted from the public             ber 21st through March 20th; autumn, March 21st through
multiple-cause-of-death databases of the Mortality Informa-            June 20th; winter, June 21st through September 20th; and
tion System (Sistema de Informac¸ões sobre Mortalidade                 spring, September 21st through December 20th. Medical and
[SIM]) located at the Brazilian Unified Health System Infor-           demographic variables were processed using the following
mation Technology Department (Departamento de Informá-                 software: dBASE III Plus, version 1.1, dBASE IV (Ashton-
tica do Sistema Único de Saúde [DATASUS]), and the                     Tate Corporation, Torrance, CA), and Epi Info, version 6.04d
Ministry of Health (MS) (12). We selected all deaths in which          (Centers for Disease Control and Prevention, Atlanta, GA),
AAA was listed on any line or in either part of the                    in an emulated dbDOSt PRO 6 environment, Excel 2016
International Form of Medical Certificate of Cause-of-Death            (Microsoft Corporation, Redmond, WA). We used the Multi-
(the medical certification section of the death certificate),          ple Causes Tabulator (Tabulador de Causas Múltiplas for
irrespective of whether it was characterized as the under-             Windows) program (DATASUS, Ministério da Saúde, Facul-
lying cause of death or as an associated (non-underlying)              dade de Saúde Pública, Universidade de São Paulo, Brazil)
cause. Complications of the underlying cause (Part I of the            and processing codes for ICD-10 (TCMWIN, version 1.6) in
medical certification section) and contributing causes (Part II        our presentation of the associated causes and of the mean
of the medical certification section) were jointly designated          number of causes per death certificate (17).
as associated (non-underlying) causes of death (13). We                   To present the associated causes listed on the death
employed the 2000–2016 mid-year estimates of the popula-               certificates on which AAA was identified as the underlying
tion for Brazil, discriminated by year, sex, age group, and            cause, we prepared special lists showing the causes involved
Brazilian region.                                                      in the respective natural histories (1,2) as well as those
   According to the International Classification of Diseases           mentioned with the greatest frequency. The duplication or
and Related Health Problems, Tenth Revision (ICD-10),                  multiplication of causes of death was avoided when these
the AAA as a cause of death rubrics included four character            were presented in the abbreviated lists. The number of
subcategories codes: I71.3, abdominal aortic aneurysm,                 causes depends on the breadth of the class (subcategory,
ruptured; I71.4, abdominal aortic aneurysm, without men-               category, grouping, or chapter of the ICD-10); therefore, if
tion of rupture; I71.5, thoracoabdominal aortic aneurysm,              two or more causes mentioned in the medical certification
ruptured; I71.6, thoracoabdominal aortic aneurysm, without             section were included in the same class, only one cause was
mention of rupture; I71.8, aortic aneurysm of unspecified              computed (16,17).
site, rupture; and I71.9, aortic aneurysm of unspecified site,            The mortality rates (per 100,000 population) for AAA
without mention of rupture (14).                                       were calculated by year and for the study period (2000–2016)
   To reconstruct the morbid process leading to death,                 as a whole; the rates were calculated based on the number of
all causes of death listed in the medical certification section        deaths that had been identified as an underlying or asso-
of the death certificate were considered, including those              ciated cause as well as on the overall number of mentions.
classified as ill-defined, equated as such, or considered by the       To calculate the average mortality rate, the overall number
World Health Organization (WHO) as modes of death                      of deaths was divided by the sum of the respective annual
(13,14).                                                               population counts for the 17-year study period.
   Records included in the mortality databases contain fields             The Programa para Análisis Epidemiológico de Datos (Epidat;
such as those appearing on the official Brazilian death                Epidemiological Analysis of Data Program), version 4.2
certificate. We also created auxiliary fields for the study of         (Dirección Xeral de Innovación e Xestión da Saúde Pública,
multiple causes, including a field designed to contain a single        Xunta de Galicia: http://dxsp.sergas.es, and Pan American
"string" of characters composed of the codes entered on lines          Health Organization) was used to standardize, by the direct

                                                                   2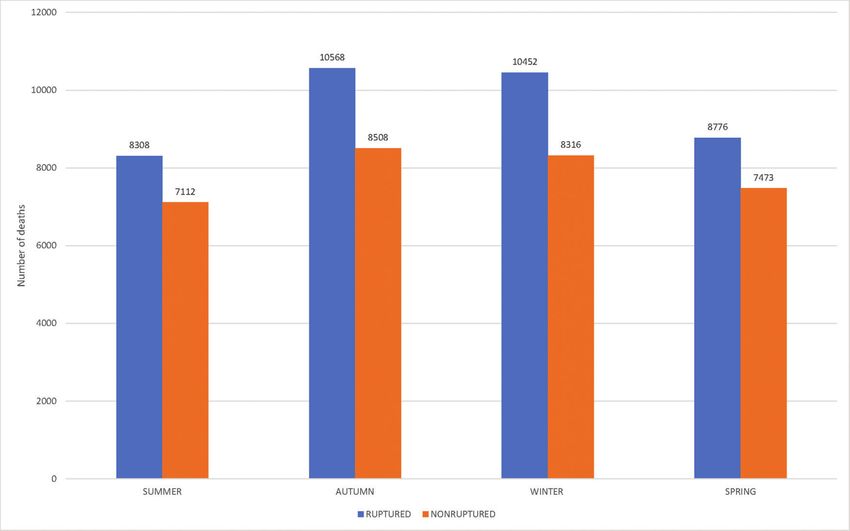
Table 1 - Deaths, crude and standardized averaged death rates, mean ages at death related to abdominal aortic aneurysms, by cause of death, sex, mention of rupture, and Brazilian
    regions (Brazil, 2000–2016).
                                                                                                                                                                                                                               CLINICS 2021;76:e2388

                                         Underlying cause                                              Associated cause                                                     Total

    BRAZIL            Male     Female     Ruptured     Unruptured     Subtotal     Male     Female     Ruptured     Unruptured     Subtotal     Male     Female     Ruptured        Unruptured   Total

    Deaths           36,342     18,983      35,556        19,772       55,328      9,139     5,045       2,548        11,637        14,185     45,481     24,028      38,104          31,409     69,513
    %                  65.7       34.3        64.3         35.7         79.6       64.4      35.6        18.0          82.0          20.4       65.4       34.6        54.8            45.2      100.0
    Crude             2.26       1.16        1.10          0.61         1.71       0.57      0.31        0.08          0.36          0.44       2.83       1.47        1.17            0.97       2.14
    Standardized      2.95       1.17        1.25          0.70         1.95       0.76      0.31        0.09          0.41          0.50       3.72       1.48        1.34            1.11       2.45
    Mean age          69.72      72.04       69.66         72.06        70.52      73.02     74.59       65.92        75.25         73.57      70.39      72.57       69.41           73.23      71.14
    NORTH
    Deaths             961       567         795             733        1,528       258       178         91            345           436       1219       745         886            1,078      1,964
    %                  62.9      37.1        52.0           48.0         77.8      59.2      40.8        20.9          79.1          22.2       62.1      37.9        45.1             54.9       2.8
    Crude             0.71      0.44        0.30            0.28        0.58       0.19      0.14        0.03          0.13          0.16       0.90      0.57        0.33            0.41       0.74
    Standardized      1.39      0.76        0.54            0.53        1.07       0.38      0.24        0.05          0.25          0.31       1.77      1.01        0.59            0.78       1.37
    Mean age          67.65     68.09       65.79           70.00       67.81      68.19     70.66       56.82         72.46         69.20      67.67     68.70       64.87           70.79      68.12
    NORTHEAST
    Deaths            4,469     3,024       4,698           2,796       7,494      1,107      820         439          1,488         1,927      5,576     3,844       5,137           4,284      9,421
    %                  59.6      40.4        62.7           37.3        79.5       57.4      42.6        22.8          77.2          20.5       59.2      40.8        54.5            45.5       13.6
    Crude             0.66      0.83        0.52            0.31        0.83       0.25      0.18        0.05          0.16          0.21       1.25      0.84        0.57            0.47       1.04

3
    Standardized      1.38      0.72        0.63            0.38        1.01       0.35      0.19        0.00          0.01          0.26       1.72      0.91        0.69            0.58       1.27
    Mean age          68.07     70.16       67.77           70.84       68.91      72.23     72.03       60.92         75.45         72.14      68.90     70.56       67.49           72.44      69.57
    SOUTHEAST
    Deaths           22,342     11,226      22,247        11,323       33,570      5,624     2,914       1,510         7,028         8,538     27,966     14,140      23,757          18,351     42,108
    %                  66.6       33.4        66.3         33.7         79.7       65.9      34.1        17.7          82.3          20.3       66.4       33.6        56.4            43.6       60.6
    Crude             3.31       1.61        1.62          0.83         2.45       0.83      0.42        0.11          0.51          0.62       4.14       2.03        1.73            1.34       3.07
    Standardized      3.96       1.44        1.66          0.85         2.52       1.02      0.36        0.00          0.01          0.64       4.98       1.81        1.78            1.38       3.15
    Mean age          70.04      72.70       70.09         72.58        70.93      73.40     75.78       67.78         75.59         74.21     70.72      73.33       69.95           73.73      71.60
    SOUTH
    Deaths            6,140     2,922       5,532           3,530       9,062      1,561      780         355          1,986         2,341      7,701     3,702       5,887           5,516      11,403
    %                  67.8      32.2        61.0           39.0        79.5       66.7      33.3        15.2          84.8          20.5       67.5      32.5        51.6            48.4        16.4
    Crude             2.65      1.24        1.18            0.75        1.94       0.67      0.33        0.08          0.42          0.50       3.32      1.57        1.26            1.18        2.44
    Standardized      3.11      1.12        1.21            0.77        1.98       0.82      0.30        0.00          0.01          0.51       3.93      1.41        1.29            1.21        2.50
    Mean age          70.38     73.02       70.54           72.31       71.23      73.70     75.23       68.03         75.32         74.21      71.06     73.48       70.39           73.39       71.84
    MIDWEST
    Deaths            2,430     1,244       2,284           1,390       3,674       589       353         153           790           943       3,019     1,597       2,437           2,180      4,617
    %                  66.1      33.9        62.2           37.8        79.6       62.5      37.4        16.2          83.8          20.4        65.4     34.6        52.8            47.2        6.6
    Crude             2.07      1.06        0.97            0.59        1.57       0.50      0.30        0.07          0.34          0.40       2.57      1.36        1.04            0.93       1.97
    Standardized      3.11      1.43        1.37            0.85        2.22       0.78      0.41        0.01          0.02          0.58       3.88      1.83        1.45            1.34       2.80
    Mean age          68.99     70.17       68.52           70.82       69.39      71.12     71.26       62.39         72.89         71.19      69.41     70.41       68.13           71.57      69.75

    Source: Ministry of Health, Unified Health System Information Technology Department. Crude and standardized rates per 100,000 population. Mean age at death in years.
                                                                                                                                                                                                          Abdominal aortic aneurysm-related mortality
                                                                                                                                                                                                                                      Santo AH et al.
Abdominal aortic aneurysm-related mortality CLINICS 2021;76:e2388
Santo AH et al.
method, the sex and age-adjusted crude and average 1.37 (1.31–1.44) per 100,000 population, respectively. The
mortality rates for the study period as a whole, to the new distribution of the qualification of causes of death and sex
WHO Standard Population (18). Crude and standardized were comparable to the overall ones (Table 1).
rates were calculated for 5-year age groups. AAA deaths were observed in all age groups, although
Analysis of variance was used to compare the mean 90% occurred after 52 years of age. Death rates above 0.5 per
numbers of causes mentioned on the death certificate, the 100.000 population began to appear in the 40 to 44 years age
Kruskal–Wallis H test was used to compare the mean age at category, with a higher number of deaths from 75 to 79 years,
death between groups, and the chi-square goodness-of-fit but the highest rates in the 85 to 89 years age group
test was used to analyze the uniformity within the seasonal (Figure 1). The mean age at death was strongly influenced by
distribution of aortic aneurysms and dissection deaths. The sex and the qualification of the cause of death, being higher
Joinpoint Regression Program, version 4.7.0.0, was used to in women and when AAA was considered as the associated
evaluate the changes in age-standardized rate trends (19). (non-underlying) cause. For the entire period, the overall mean
Assuming a Poisson distribution, joinpoint analysis chooses age at death for all mentions was 71.141 (±13.601), 70.385
the best fitting point (or points) at which the rate increases or (±13.098), female 72.573 (±14.397) (p=0.0000), underlying
decreases significantly and calculates the annual percent cause 70.517 (±13.550), associated cause 73.574 (±13.527)
change (APC) and average annual percent change (AAPC). (p=0.0000), ruptured 69.408 (±14.331), without rupture 73.243
p-values o0.05 were considered significant. (±12.339) (p=0.0000), and North 68.118 (±16.361), Northeast
69.573 (±15.856), Southeast 71.595 (±13.104), South 71.844
’ RESULTS (±12.542), and Central-West 69.752 (±13.786) (p=0.000)
(Table 1). Ruptured AAA occurred in 54.8%, and AAA
In Brazil, from 2000 to 2016, a total of 18.683.908 deaths without mention of rupture in 45.2% of overall mentioned
were recorded, of which, 69,513 overall deaths were related deaths. However, ruptured AAA accounted for 64.3% (males,
to AAA, 55,328 (79.6%) had AAA as the underlying cause, 64.5%) as the underlying cause of death, fluctuating from
and 14,185 (20.4%) had AAA as an associated (non-under- 66.3% in the Southeast region to 52.0% in the North region.
lying) cause of death. These deaths corresponded to the Among the associated causes of death, 18.0% (women, 19.4%)
average standardized mortality rates and CIs of 2.45 (2.35– involved ruptured AAA, varying from 22.8% in the Northeast
2.49), 1.95 (1.88–1.95), and 0.50 (0.44–0.53) per 100,000 region to 15.2% in the South region. Of the 38,104 ruptured
population, respectively. Male and female accounted for AAA deaths, the AAA was the underlying cause in 93.3%
approximately 65.4% and 34.6% of deaths, respectively, (male, 93.7%), and the associated cause in 6.7% (male, 6.3%)
resulting in ratios of 1.89:1, 1.91:1, and 1.81:1, for overall, (Table 1).
underlying, and associated deaths, respectively (Table 1). Joinpoint regression on overall standardized rates in-
Most of the deaths occurred in the Southeast region creased during 2000–2008, followed by a decrease in 2008–
(60.6%), followed by the South (16.4%), Northeast (13.6%), 2016; this resulted in an AAPC decline of -0.2 (CI, -0.5 to 0.2)
Central-West (6.6%), and North (2.8%) regions, with overall for the entire 2000–2016 study period. These figures are
average standardized mortality rates and CIs of 3.15 (3.07– derived from the overall underlying and associated causes of
3.21), 2.50 (2.40–2.54), 1.27 (1.22–1.34), 2.80 (2.68–2.88), and death as well as from Brazilian regions, sex, and mention of
Figure 1 - Abdominal aortic aneurysm death rates according the identified cause of death and age (Brazil, 2000–2016).
4Table 2 - Abdominal aortic aneurysm trends and Joinpoint Regression Analysisa by cause-of-death, sex, and mention of rupture (Brazil, 2000–2016).
Global 2000–2016 Trend 1 Trend 2
b
CLINICS 2021;76:e2388
Abdominal aortic aneurysm variables Rates AAPC CI Years APC CI Years APC CI
CAUSES OF DEATH
Overall causes of death
All mentions 2.45 -0.2c -0.5 to 0.2 2000–2008 0.9c 0.4 to 1.5 2008–2016 -1.3c -1.8 to -0.7
Underlying cause-of-death 1.95 0.3 -0.1 to 0.7 2000–2008 1.4c 0.7 to 2.2 2008–2016 -0.9c -1.5 to -0.3
Associated cause-of-death 0.50 -1.9c -2.5 to -1.3 2000–2016 -1.9c -2.5 to -1.3
Brazilian regions
North: All mentions 1.37 2.6c 1.4 to 3.8 2000–2016 2.6c 1.4 to 3.8
North: Underlying cause-of-death 1.07 3.2c 1.9 to 4.5 2000–2016 3.2c 1.9 to 4.5
North: Associated cause-of-death 0.31 0.5 -1.8 to 2.8 2000–2016 0.5 -1.8 to 2.8
Northeast: All mentions 1.27 3.3c 2.2 to 4.4 2000–2007 7.0c 4.7 to 9.4 2007–2016 0.5 -0.7 to 1.7
Northeast: Underlying cause-of-death 1.01 3.8c 2.7 to 4.9 2000–2007 8.6c 6.0 to 11.1 2007–2016 0.2 -1.0 to 1.4
Northeast: Associated cause-of-death 0.26 1.5c 0.0 to 2.9 2000–2016 1.5c 0.0 to 2.9
Southeast: All mentions 3.15 -0.7c -0.1 to 0.3 2000–2016 -0.7c -0.1 to 0.3
Southeast: Underlying cause-of-death 2.52 -0.3 0.3 to -0.9 2000–2012 0.3 -0.1 to 0.8 2012–2016 -0.2 -4.1 to 0.1
Southeast: Associated cause-of-death 0.64 -2.8c -3.5 to 02.2 2000–2016 -2.8c -3.5 to 02.2
South: All mentions 2.50 -2.5c -3.0 to -2.0 2000–2016 -2.5c -3.0 to -2.0
South: Underlying cause-of-death 1.98 -2.2c -2.8 to -1.7 2000–2016 -2.2 -2.8 to -1.7
5
South: Associated cause-of-death 0.51 -3.4c -4.2 to -2.6 2000–2016 -3.4c -4.2 to -2.6
Center-West: All mentions 2.80 0.3 -0.6 to 1.1 2000–2008 2.1c 0.6 to 3.7 2008–2016 -1.5c -2.7 to 0.1
Center-West: Underlying cause-of-death 2.22 0.2 -0.6 to 1.1 2000–2007 1.7 -0.0 to 3.4 2007–2016 -0.9 -1.8 to 0.1
Center-West: Associated cause-of-death 0.58 0.0 -2.0 to 2.1 2000–2016 0.0 -2.0 to 2.1
Causes of death and sex
All mentions of cause-of-death in men 3.72 -0.6c -1.1 to -0.2 2000–2008 0.5 -0.3 to 1.2 2008–2016 -1.7 -2.4 to -1.0
All mentions of cause-of-death in women 1.48 0.9c 0.2 to 1.6 2000–2008 2.3c 1.1 to 3.5 2008–2016 -0.5 -1.4 to 0.4
Underlying cause-of-death in men 2.95 -0.2 -0.6 to 0.2 2000–2008 1.0c 0.3 to 1.6 2008–2016 -1.3 -1.9 to -0.8
Underlying cause-of-death in women 1.17 0.9 -0.3 to 2.2 2000–2007 5.4c 0.9 to 10.1 2007–2016 -0.2 -0.8 to 0.5
Associated cause-of-death in men 0.76 -1.7c -3.1 to -0.3 2000–2003 4.0 -3.7 to 12.2 2003–2016 -3.0c -3.7 to -2.2
Associated cause-of-death in women 0.31 -1.0c -1.8 to 0.1 2000–2016 -1.0c -1.8 to 0.1
Causes of death and mention of rupture
All mentions of cause-of-death, ruptured 1.34 -0.3 -1.6 to 1.1 2000–2016 -0.3 -1.6 to 1.1
All mentions of cause-of-death, unruptured 1.11 0.2 -0.8 to 1.2 2000–2016 0.2 -0.8 to 1.2
Underlying cause-of-death, ruptured 1.25 0.1 -0.3 to 0.5 2000–2016 0.1 -0.3 to 0.5
Underlying cause-of-death, unruptured 0.70 0.4 -0.1 to 0.8 2000–2009 2.0c 1.4 to 2.7 2009–2016 -1.7c -2.5 to -1.0
Associated cause-of-death, ruptured 0.09 -6.2c -8.1 to -4.3 2000–2016 -6.2c -8.1 to -4.3
Associated cause-of-death, unruptured 0.41 -0.4 -1.4 to 0.8 2000–2005 4.1c 0.6 to 7.7 2005–2016 -2.3c -3.2 to -1.5
AAPC: Average annual percent change, CI: Confidence interval, APC: Annual percent change.
a
Joinpoint analysis of trends allowed for one joinpoint.
b
Rates are per 100,000 population, age-standardized to the WHO standard population.
c
The annual percent change is significantly different from 0 (po0.05).
Abdominal aortic aneurysm-related mortality
Santo AH et al.Abdominal aortic aneurysm-related mortality CLINICS 2021;76:e2388
Santo AH et al.
rupture rate trends. While the age-standardized underlying revealed increased trends for all mentions (2000–2008) and
cause of death rates increased and decreased as mentioned underlying causes (2000–2007), followed by a decline, and
above, the associated cause rates declined continually during similar rates for associated causes over the entire period.
the entire period. The North and Northeast regions revealed An increased trend was noticed for all mentions and
increased trends; the Southeast and South regions showed underlying causes of death for women, although significance
decreased trends, apart from the underlying causes 2000– was only observed for all mentioned causes (Table 2 and
2012 rise in the Southeast; and the Central-West region Figure 2).
Figure 2 - Trends of age-standardized death rates of AAA in Brazilian Regions, 2000–2016.
6CLINICS 2021;76:e2388 Abdominal aortic aneurysm-related mortality
Santo AH et al.
Table 3 - Associated (non-underlying) causes of death on certificates that listed abdominal aortic aneurysm as the underlying cause of
death (Brazil, 2000–2016).
Abdominal aortic aneurysm as the underlying cause of death
Ruptured 35,556 Unruptured 19,772 Total 55,328
Associated (non-underlying) cause of death (ICD-10) n % n % n %
Shock, not elsewhere classified (R57) 13,932 39.2 5,582 28.2 19,514 35.3
Hypertensive diseases (I10-I13) 9,507 26.7 5,808 29.4 15,315 27.7
Haemorrhagesa 11,732 33.0 2,084 10.5 13,816 25.0
Atherosclerosis (I70) 6,189 17.4 1,619 8.2 7,808 14.1
Surgical operations and other surgical procedures (Y83-Y84) 1,918 5.4 4,717 23.9 6,635 12.0
Ischemic heart diseases (I20-I25) 2,465 6.9 2,121 10.7 4,586 8.3
Renal failure (N17-N19) 1,704 4.8 2,610 13.2 4,314 7.8
Other heart diseasesc 2,186 6.2 1,804 9.1 3,990 7.2
Complications of surgical and medical careb 994 2.8 2,958 15.0 3,952 7.1
Cardiorespiratory arrest (I46.9. R09.2) 1,694 4.8 1,972 10.0 3,666 6.6
Multiple organs failure (R68.8) 1,384 3.9 1,705 8.6 3,089 5.6
Septicemias (A40-A41) 770 2.2 1,832 9.3 2,602 4.7
Cerebrovascular diseases (I60-I69) 1,547 4.4 961 4.9 2,508 4.5
Diabetes mellitus (E10-E14) 1,227 3.5 920 4.7 2,147 3.9
Chronic lower respiratory diseases (J40-J47) 1,103 3.1 954 4.8 2,057 3.7
Heart failure (I50) 748 2.1 1,176 6.0 1,924 3.5
Respiratory failure, not elsewhere classified (J96) 638 1.8 1,284 6.5 1,922 3.5
Tobacco use (smoking) (F17) 1,138 3.2 664 3.4 1,802 3.3
Pneumonias (J12-J18) 527 1.5 950 4.8 1,477 2.7
Other diseases of the arteries. Arterioles, and capillaries (I72-I78) 547 1.5 864 4.4 1,411 2.6
Vascular disorders of the intestine (K55) 337 1.0 768 3.9 1,105 2.0
Neoplasms (C00-D48) 537 1.5 420 2.1 957 1.7
Other respiratory diseases of the interstitium (J80-J84) 491 1.4 304 1.5 795 1.4
Senility (R54) 389 1.1 325 1.6 714 1.3
Other respiratory diseasesd 248 0.7 325 1.6 573 1.0
Marfan’s syndrome (Q87.4) 6 0.0 11 0.1 17 0.0
Source: Ministry of Health, Unified Health System Information Technology Department.
Rubrics and codes of the International Statistical Classification of Diseases. and Related Health Problems, Tenth Revision (1996 to 2009).
a
Hemorrhages (D62, D64, I31.2. .9, J94.2, K66.1, K92.0- .2, R58).
b
Complications of surgical and medical care (E89.9, G97, I97, J95, K91, N99, T80-T88).
c
Other heart diseases (I00-I09, I26-I28, I30-I31, I31.3-.8, I33-I42, I44.0-I46.1, I47-I49, I51).
d
Other respiratory diseases (J00-J11, J20-J39, J60-J70, J85-J94.1, J94.8-9, J98).
Associated (non-underlying) causes in deaths were most frequently reported as underlying causes of
related to AAA as the underlying cause aortic aneurysms without mention of rupture.
For the 17-year study, the major associated causes of
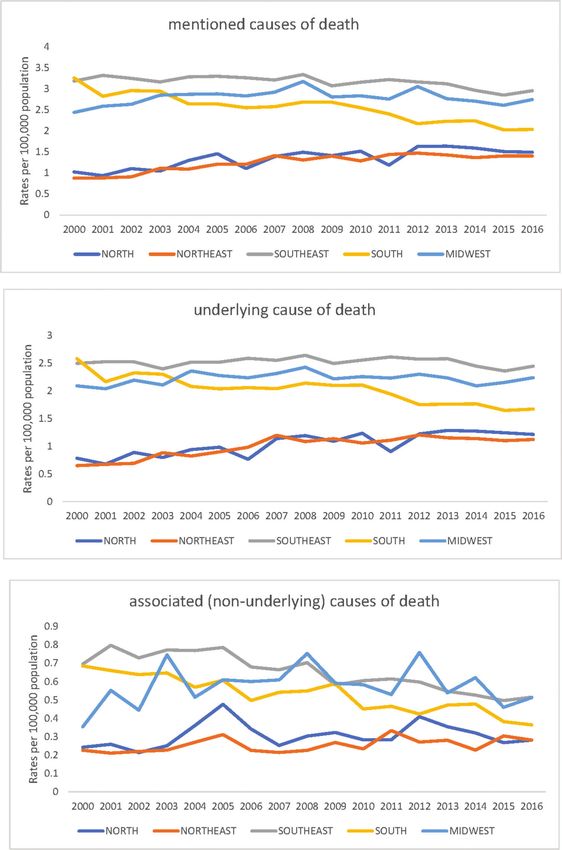
deaths in which AAA was identified as the underlying cause, Seasonal variation
ruptured, and without mention of rupture, are presented in The seasonal variation in the overall ruptured AAAs,
Table 3, in decreasing order of their total mentions. Shock both underlying and associated causes of death, are shown
(39.2%), hemorrhages (33.0%), hypertensive diseases (26.7%), in Figure 3. A significant seasonal variation was observed,
and atherosclerosis (17.4%) prevailed with ruptured aneur- with the highest frequencies during autumn (incidence
ysm, while hypertensive diseases (29.4%), shock (28.2%), rate, 27.7%), followed by winter (27.4%) (x2 135.26, df 3,
surgical operations and procedures (23.9%), and related po0.00000), which was also verified in the Southeast region,
complications (15.0%), renal failure (13.2%), ischemic heart with autumn (28.1%) and winter (27.5%) (x2 99.72, df 3,
diseases (10.7%), and hemorrhages (10.5%) were frequently po0.00000), and in the South region, with autumn (29.0%)
associated with aneurysms without mention of rupture. and winter (28.2%) (x2 30.71, df 3, po0.00000). Analogous
results were observed among the unruptured AAAs. The
highest significant seasonal variation was observed during
Underlying causes of death with AAA as an autumn (27.1%), followed by winter (26.5%) for overall
associated cause deaths (x2 57.18, df 3, po0.00000). Moreover, in the Southeast
The underlying causes of the deaths in which AAA was region, with autumn (27.1%) and winter (26.2%) (x2 29.24,
listed as an associated cause are presented in Table 4, df 3, po0.000002), while in the South region winter (27.8%),
according to the ICD structure and ordered after their total autumn (27.3%) (x2 19.92, df 3, po0.000176) (Figure 3).
mentions. Major underlying causes of death were included
in ICD chapters of diseases of the circulatory, respiratory,
digestive systems, and neoplasms. Hypertensive and cere- ’ DISCUSSION
brovascular diseases were most frequently reported as
underlying causes of ruptured aneurysms, whereas ischemic The mortality related to AAA in Brazil was studied using
heart diseases, diseases of the respiratory system, and neoplasms the methodology of multiple causes of death; as a result,
7Abdominal aortic aneurysm-related mortality CLINICS 2021;76:e2388
Santo AH et al.
Table 4 - Underlying causes of death on death certificates that listed abdominal aortic aneurysm as associated (non-underlying) cause
of death (Brazil, 2000–2006).
AAA as associated (non-underlying) cause-of-death
Ruptured Unruptured Total
Underlying causes of death (ICD-10) n % n % n %
Certain infectious and parasitic diseases (A00-B99) 55 2.2 372 3.2 427 3.0
Septicemias (A40-A41) 27 1.1 200 1.7 227 1.6
Chagas’ disease (B57) 9 0.4 38 0.3 47 0.3
Neoplams (C00-D48) 97 3.8 1,174 10.1 1,271 9.0
Malignant neoplasms of the esophagus and stomach (C15-C16) 12 0.5 144 1.2 156 1.1
Malignant neoplasms of the bronchus and lung (C34) 13 0.5 203 1.7 216 1.5
Malignant neoplasms of the prostate (C61) 7 0.3 110 0.9 117 0.8
Endocrine. nutritional and metabolic diseases (E00-E90) 158 6.2 447 3.8 605 4.3
Diabetes mellitus (E10-E14) 103 4.0 268 2.3 371 2.6
Diseases of the nervous system (G00-G99) 55 2.2 372 3.2 427 3.0
Alzheimer’s disease (G30) 6 0.2 61 0.5 67 0.5
Diseases of the circulatory system (I00-I99) 1,401 55.0 5,697 49.0 7,098 50.0
Hypertensive diseases (I10-I13) 285 11.2 989 8.5 1274 9.0
Ischemic heart diseases (I20-I25) 307 12.0 2,239 19.2 2,546 17.9
Pulmonary heart diseases and diseases of pulmonary circulation (I26-I28) 10 0.4 124 1.1 134 0.9
Cardiomyopathy (I42) 46 1.8 280 2.4 326 2.3
Other cardiac arrhythmias (I44-I49) 14 0.5 142 1.2 156 1.1
Heart failure (I50) 31 1.2 295 2.5 326 2.3
Other heart diseases (I30-I40. I51) 138 5.4 356 3.1 494 3.5
Cerebrovascular diseases (I60-I69) 463 18.2 851 7.3 1,314 9.3
Atherosclerosis (I70) 34 1.3 85 0.7 119 0.8
Other diseases of arteries. Arterioles, and capillaries (I72-I78) 61 2.4 227 2.0 288 2.0
Diseases of the respiratory system (J00-J99) 206 8.1 1,827 15.7 2,033 14.3
Pneumonias (J12-J18) 73 2.9 677 5.8 750 5.3
Chronic lower respiratory diseases (J40-J47) 83 3.3 837 7.2 920 6.5
Diseases of the digestive system (K00-K93) 214 8.4 1,001 8.6 1,215 8.6
Vascular disorders of intestine (K55) 22 0.9 192 1.6 214 1.5
Peritoneal adhesions (K660) 86 3.4 18 0.2 104 0.7
Diseases of the genitourinary system (N00-N99) 63 2.5 483 4.2 546 3.8
Renal failure (N17-N19) 42 1.6 255 2.2 297 2.1
Urinary tract infection, site not specified (N39.0) 9 0.4 139 1.2 148 1.0
Congenital malformations, deformations and chromosomal abnormalities (Q00-Q99) 40 1.6 59 0.5 99 0.7
Marfan’s syndrome (Q87.4) 15 0.6 41 0.4 56 0.4
External causes of morbidity and mortality (V00-Y98) 181 7.1 219 1.9 400 2.8
Surgical operations and other surgical procedures y (Y83-Y84) 26 1.0 79 0.7 105 0.7
Other underlying causes of death 106 4.2 240 2.1 346 2.4
Total 2,548 100 11,637 100 14,185 100
Source: Ministry of Health, Unified Health System Information Technology Department.
Rubrics and codes of the International Statistical Classification of Diseases and Related Health Problems, Tenth Revision.
Surgical operations and other surgical procedures as the cause of abnormal reaction of the patient, or of later complication, without mention of
misadventure at the time of the procedure (Y83-Y84).
it was possible to take advantage of the resources embraced among the associated cause deaths, AAA without mention
in the structure of the WHO International Form of Medical of rupture occurred only in 37.0% in Brazil, but 65.8% in
Certificate of Cause of Death, correlated guidance, and Washington State. These findings suggest that AAA is a
dispositions of mortality coding instructions. Almost 80% of considered more suitable cause of death in Brazil than in
related AAA deaths were identified as the underlying cause Washington State by physicians when completing death
of death; this may reflect the correlated fatality, while nearly certificates (20).
65% of these deaths accounted for ruptured aneurysms, In this analysis of trends in AAA mortality in Brazil, we
among which 93.3% were underlying causes of death. verified a yearly increase in all mentions during 2000–2008,
However, these values are lower than the 84.7% found for followed by a decrease in 2008–2016. This initial increase in
aortic aneurysm and dissection-related mortality as under- rates may be due to a greater awareness of AAA as a cause of
lying causes in São Paulo, Brazil, from 1985 to 2009 (7). death, the extension of mortality statistics by means of the
Otherwise, interesting comparisons occur between Brazilian multiple-cause-of-death methodology, and an increase in
and Washington State, in the United States. While the population survival, all of which have already been justified
proportions of ruptured and without mention of rupture the rate increases in the São Paulo study (7). However,
deaths are quite similar (54.8% and 45.2% in Brazil; 52.3% somehow, the rates began to influence the larger control of
and 42.7% in Washington State), AAA is less commonly AAA mortality risks, mainly tobacco smoking, which
identified as the underlying cause in Washington State remains the most important risk factor for AAA (1). The
(64.1%) and, among ruptured aneurysms deaths, similar surveillance of risk and protective factors for chronic diseases
values when listed as underling cause of 91.3%. However, by telephone disclosed the prevalence of smokers in adults
8CLINICS 2021;76:e2388 Abdominal aortic aneurysm-related mortality
Santo AH et al.
Figure 3 - Number of deaths related to abdominal aortic aneurysms, ruptured and unruptured, according to season (Brazil, 2000–2016).
(X18 years) in Brazilian state capitals and Federal District as aged X25 years concluded that high systolic blood pressure
9.8%, 12.3%, and 7.7%, for the overall, male, and female was identified as the leading risk factor for cardiovascular
population in 2019, respectively, as well as an overall decline death from 1990 to 2017 (25). The prevalence of hypertension
of smokers of 37.6% from 2006 to 2019. (21). The Global in Brazil is remarkably high; in 2019, hypertension occurred
Burden of Disease Study 2015 mentions that Brazil was in approximately 24.5% of the overall population, and its
included among the 13 countries that recorded significant incidence was higher in women (27.3%) than in men (21.2%).
annualized rates of decline between 1990 and 2005 and 2005 The prevalence of hypertension by age was as follows: 31.6%
and 2015, suggesting sustained progress in tobacco control. in those aged 45–54 years, 45.2% in those aged 55–64 years,
Among the countries with the largest number of total and 59.3% in those aged X65 years) (21). The current
smokers in 2015, Brazil recorded the largest overall reduction advances in smoking influence all efforts to effectively
in prevalence for both male and female daily smokers, which control hypertension, with the aim to prevention of AAA
dropped by 56.5% (51.9–61.1) and 55.8% (48.7–61.9), respec- rupture. Mortality from AAA typically results from aneur-
tively, between 1990 and 2015 (22). ysm rupture; however, such as has been verified with
Regarding sex, the prevalence of AAA in males has been associated causes, deaths also occur after surgical and
shown to be four-to-six times higher than that of females (23). medical care, both for ruptured and unruptured aneurysms.
The observed ratios of male to female deaths, overall, under- Patients with large aneurysms commonly present with other
lying and associated, as expected, were similar to those cardiovascular risk factors, which increase their overall
verified in the São Paulo study for aortic aneurysms and clinical morbidity irrespective of surgical intervention.
dissection (1986 to 2009), at 1.9:1, 1.9:1, and 2.2:1, respectively. The issue of AAA as an associated cause of death generates
Shock and the aggregate of hemorrhages, mentioned as the doubts about the value of causes of death from death certi-
main associated causes of death related to ruptured AAA, ficates. Indeed, a reviewer stresses that ‘‘It is not clear how the
indicate the severity of this condition. Hemorrhage is con- aneurysm can be an associated cause if it was ruptured and not
sidered an important predictor of death. Due to omissions in the underlying cause. A ruptured aneurysm in general is highly
death certification, a rupture may have even occurred in lethal, and it is difficult to imagine that the rupture is not
aneurysm without its mention, while hemorrhage occurred associated with mortality.’’ We agree with the reviewer that
in 10.5% of the cases. Otherwise, hypertensive diseases, non- multiple-cause-of death is an overly complex matter. The
hemorrhagic shock, surgical operations, and complications problems stem from the design of the International Form of
of surgical and medical care were the main causes of Medical Certificate of Cause of Death and the concept of
unruptured AAA. Our finding that hypertension was the underlying cause. Moreover, the value of death certificates data
leading cause of death related to unruptured AAA is relies on the physician medical education and his personal
consistent with other studies that have shown its positive subjective option, followed by coding and automatic processing
link as a risk factor. Indeed, hypertension was the leading of causes of death by means of decision tables that incorporate
cause of death of ruptured aortic aneurysms in the United all medical world knowledge. Regarding the association of
States from 1996 to 2016 (24). Furthermore, a study using the causes of death, an endless possibility of interconnecting
Global Burden of Diseases 2017 estimates among Brazilians relations may occur. An AAA may hamper the proper care
9Abdominal aortic aneurysm-related mortality CLINICS 2021;76:e2388
Santo AH et al.
and treatment of a myocardial infarction or cancer; For ’ AUTHOR CONTRIBUTIONS
example, MI or cancer may be the underlying cause and
Santo AH participated in the design of the study, data processing, analysis
AAA may be the associated cause.
and interpretation, and manuscript drafting. Puech-Leão P and Krutman
A seasonal variation was observed in the country in M were involved in manuscript drafting and critically review for important
overall deaths, and underlying and associated causes, which intellectual content. All authors have read and approved the final version of
was more evident among ruptured that in unruptured AAA; the manuscript.
this variation was characterized by higher mortality during
autumn and winter periods, and was better defined in
the Southeast and South regions, where seasonal climatic ’ REFERENCES
variations are more distinct. Distinct seasonal variation, with
1. Sakalihasan N, Michel JB, Katsrgyris A, Kuivaniemi H, Defraigne JO,
the highest frequency during winter, was observed in deaths Nchim A, et al. Abdominal aortic aneurysms. Nat Rev Dis Primers. 2018;
with the underlying cause of aortic dissection, and ruptured 4(1):34. https://doi.org/10.1038/s41572-018-0030-7
and unruptured aortic aneurysms in the state of São Paulo 2. Ahmed R, Ghoorah K, Kunadian V. Abdominal Aortic Aneurysms and
from 1985 to 2009. Nevertheless, these results are in Risk Factors for Adverse Events. Cardiol Rev. 2016;24(2):88-93. https://
doi.org/10.1097/CRD.0000000000000052
agreement with the conclusions of systematic reviews and 3. Reimerink JJ, van der Laan MJ, Koclemary MJ, Balm R, Legemate DA.
meta-analyses, which verified that autumn and winter are Systematic review and meta-analysis of population-based mortality from
significantly associated with a higher incidence of AAA ruptured abdominal aortic aneurysm. Br J Surg. 2013;100(11):1405-13.
https://doi.org/10.1002/bjs.9235
rupture (26–28). Increased blood pressure levels, arterial 4. Dias-Neto M, Ramos JF, Sampaio S, Freitas A. [A transic¸ão epidemioló-
spasm, pulmonary disease exacerbations, and passive gica no aneurisma da aorta abdominal]. Angiol Cir Vasc. 2017;13(1):
smoking in colder weather can explain this pattern, which 8-13.
5. Sidloff D, Stather P, Dattani N, Bown M, Thompson J, Sayers R, et al.
is also observed in other cardiovascular conditions such as Aneurysm global epidemiology study: public health measures can further
cerebral and coronary ischemia. reduce abdominal aortic aneurysm mortality. Circulation 2014;129(7):
Population mortality statistics suffer from quantity and 747-53. https://doi.org/10.1161/CIRCULATIONAHA.113.005457
6. Lilja F, Wanhainen A, Mani K. Changes in abdominal aortic aneurysm
quality problems. Furthermore, specific AAA mortality has epidemiology. J Cardiovasc Surg (Torino). 2017;58(6):848-53. https://doi.
intrinsic difficulties due to deaths without a known previous org/10.23736/S0021-9509.17.10064-9
aneurysm occurring outside hospitals and without autopsy. 7. Santo AH, Puech-Leão P, Krutman M. Trends in aortic aneurysm- and
Regarding the propriety of AAA without mention of rupture dissection-related mortality in the state of São Paulo, Brazil, 1985-2009:
multiple-cause-of-death analysis. BMC Public Health. 2012;12:859. https://
as a cause of death, some adjustment by recoding when doi.org/10.1186/1471-2458-12-859
evidence of hemorrhage was present on these death certi- 8. Munoz-Mendonza J, Pinto Miranda VA, Quevedo HC, Hebert K. Trends
ficates to ruptured AAA was unconvincing (20). We intend to in abdominal aortic aneurysm prevalence and mortality in non-European
countries. Int J Cardiol. 2013;170(2):e38-40. https://doi.org/10.1016/
emphasize the advantages with the aim to overcome the j.ijcard.2013.10.074
limitations of death certificate mortality data. Estimations 9. Bonamigo TP, Siqueira I. Screening for abdominal aortic aneurysms. Rev
for 2017 show a coverage of 96.3% for the whole country, Hosp Clin Fac Med Sao Paulo. 2003;58(2):63-8. https://doi.org/10.1590/
S0041-87812003000200002
varying from 92.7% in the North region to 100% in the South 10. Puech-Leão P, Molnar LJ, Oliveira IR, Cerri GG. Prevalence of abdominal
region (29). Regarding quality, in a recent appraisal of the aortic aneurysms – a screening program in São Paulo, Brazil. Sao Paulo
institution of multiple-cause-of-death statistics in Brazil from Med J. 2004;122(4):158-60. https://doi.org/10.1590/S1516-318020040004
00005
2003 to 2015, the crude mean number of causes per death 11. Barros FS, Pontes SM, Taylor MA, Roelke LH, Sandri JL, Jacques CM, et al.
certificate increased from 2.81% to 3.02% (7.5%). Deaths with [Rastreamento do aneurisma da aorta abdominal na populac¸ão da cidade
only one cause decreased from 20.32% to 13.75%, and ill- de Vitória (ES)]. J Vasc Br. 2005;4(1):59-65.
12. Ministério da Saúde. Departamento de Informática do SUS. Acesso à
defined causes of death as underlying cause decreased from Informac¸ão. Servic¸os. transferência-download-de-arquivos. arquivos-de-
12.95% to 5.67% (56.22%) (30,31). All death certificates are dados. Available from: http://www2.datasus.gov.br/DATASUS/index.
filled by physicians, and the verified mean number of causes php?area=0901&item=1&acao=26&pad=31655
mentioned on the death certificate rank among the highest in 13. World Health Organization. International Classification of Diseases and
Related Health Problems, World Health Organization, Geneva, 1993,
the world. Although automatic processing of mortality data Tenth Revision. Volume 2 Instruction Manual.
is used in Brazil, the causes of death are still determined by 14. World Health Organization. International Classification of Diseases and
trained nosologists who may mistakenly introduce a wrong Related Health Problems. World Health Organization, Geneva, 1992,
Tenth Revision.
ICD code. Finally, it is important to remember the respon- 15. Santo AH, Pinheiro CE. [The use of the microcomputer in selecting the
sibility of physicians to correctly identify the causes of death basic cause of death]. Bol Oficina Sanit Panam. 1995;119(4):319-27.
on death certificates. 16. Santo AH. Causas múltiplas de morte: formas de apresentac¸ão e métodos
de análise. (Multiple causes of death: presentation forms and analysis
methods) [Tese de Doutorado]. São Paulo: Faculdade de Saúde Pública,
Universidade de São Paulo. 1988.
’ CONCLUSION 17. Santo AH, Pinheiro CE. [Tabulador de causas múltiplas de morte]. Rev
Bras Epidemiol. 1999;2(1/2):90-7. https://doi.org/10.1590/S1415-790X19
99000100009
This study highlights the need to accurately document 18. Ahmad OB, Boschi-Pinto C, Lopez AD, Murray CJ, Lozano R, Inoue M.
epidemiological trends related to AAA in Brazil. AAA has a Age Standardization of Rates: A New WHO Standard. World Health
significant burden on mortality in older individuals, and Organization: Geneva, 2001.
19. Joinpoint Regression Program, Version 4.7.0.0. February 2019; Statistical
greater understanding of epidemiological trends will assist Research and Applications Branch, National Cancer Institute.
with the development of an effective plan for mortality 20. Bartek MA, Kessler LG, Talbot JM, Nguyen J, Shalhub S. Washington State
prevention and control. As the first specific study on AAA abdominal aortic aneurysm-related mortality shows a steady decline
mortality in Brazil, we (1) describe the progression of AAA in between 1996 and 2016. J Vasc Surg. 2019;70(4):1115-22. https://doi.org/
10.1016/j.jvs.2018.12.040
the Brazilian population, (2) hope to inform the medical 21. Brasil. Ministério da Saúde. Secretaria de Vigilância em Saúde. Departa-
community, (3) provide data to facilitate comparisons with mento de Análise em Saúde e Vigilância de Doenc¸as Não Transmissíveis.
Western countries, and (4) highlight important issues to Vigitel Brasil 2019: vigilância de fatores de risco e protec¸ão para doenc¸as
crônicas nas capitais dos 26 estados brasileiros e no Distrito Federal em
further follow up AAA mortality. 2019 (recurso eletrônico) / Ministério da Saúde, Secretaria de Vigilância
10CLINICS 2021;76:e2388 Abdominal aortic aneurysm-related mortality
Santo AH et al.
em Saúde, Departamento de Análise em Saúde e Vigilância de Doenc¸as 27. Wu Z, Li Y, Zhou W, Ji C, Zhao H, Liu X, et al. Seasonal incidence of
Não Transmissíveis. – Brasília: Ministério da Saúde, 2020. ruptured abdominal aortic aneurysm and the influence of atmospheric
22. GBD 2015 Tobacco Collaborators. Smoking prevalence and attri- pressure: a systematic review and meta-analysis. Int J Biometeorol.
butable disease burden in 195 countries and territories, 1990-2015: 2018;62(9):1733-43. https://doi.org/10.1007/s00484-018-1573-8
a systematic analysis from the Global Burden of Disease Study 2015. 28. Choong AMTL, Marjot J, Wee IJY, Syn N, Marjot T, Brightwell RE, et al.
Lancet. 2017;389(10082):1885-906. https://doi.org/10.1016/S0140-6736 Forecasting aortic aneurysm rupture: A systematic review of seasonal and
(17)30819-X atmospheric associations. J Vasc Surg. 2019;69(5):1615-1632.e17. https://
23. Ullery BW, Hallet RL, Fleischmann D. Epidemiology and contemporary doi.org/10.1016/j.jvs.2018.09.030
management of abdominal aortic aneurysms. Abdom Radiol (NY). 29. Ministério da Saúde. Secretaria de Vigilância em Saúde. Departamento de
2018;43(5):1032-43. Análise de Saúde e Vigilância de Doenc¸as Não Transmissíveis. Indica-
24. Abdulameer H, Taii HA, Al-Kindi SG, Milner R. Epidemiology of dores de cobertura que utilizam a metodologia de Busca Ativa. Cober-
fatal ruptured aortic aneurysms in the United States (1999-2016). tura de informac¸ão de óbitos. Available from: http://svs.aids.gov.br/
J Vasc Surg. 2019;69(2):378-384.e2. https://doi.org/10.1016/j.jvs.2018. dantps/acesso-a-informacao/acoes-e-programas/busca-ativa/indicadores-
03.435 de-saude/cobertura/
25. Ribeiro ALP, Brant LCC, Yadgir S, Oliveira GMM, Glenn SD, Mooney M, 30. Santo AH, Pinheiro CE. Reavaliac¸ão do potencial epidemiológico das
et al. Trends in prevalence, mortality and morbidity associated with high causas múltiplas de morte no Brasil, 2015. [Reevaluation of the epide-
systolic blood pressure in Brazil from 1990 to 2017: estimates from the miological multiple-cause-of-death potential use in Brazil, 2015]. Research
Global Burden of Disease 2017 study. Eur Heart J. 2019;40(Supl 1): Gate, Preprint. Available from: https://www.researchgate.net/publica
ehz748.0694. https://doi.org/10.1093/eurheartj/ehz748.0694 tion/335207119
26. Vitale J, Manfredini R, Gallerani M, Mumoli N, Eagle KA, Ageno W, et al. 31. Santo AH, Pinheiro CE. Reassessment of the epidemiological multiple-
Chronobiology of acute aortic rupture or dissection: a systematic review cause-of-death potential use in Brazil, 2015. Presented at the Fourth Inter-
and a meta-analysis of the literature. Chronobiol Int. 2015;32(3):385-94. national Meeting on Multiple Cause-of-Death Analysis, Institut National
https://doi.org/10.3109/07420528.2014.983604 d’Etudes Démographiques, INED 2019, Paris, May 16th – May 17th, 2019.
11You can also read