TRINITY PUBLIC UTILITY DISTRICT - 2022-2026 System Improvement Plan - 2022-2025 Construction Work Plan - Trinity Public Utilities ...
←
→
Page content transcription
If your browser does not render page correctly, please read the page content below
2022-2025
                 Construction
                 Work Plan

 TRINITY PUBLIC
UTILITY DISTRICT
                          2022-2026
   S y s t e m I mp r o v e m e n t P l a n

                        NOVEMBER 2021
ii
2022 - 2026
               SYSTEM IMPROVEMENT PLAN

                                           for

                 Trinity Public Utility District

                                  NOVEMBER 2021

                                  Respectfully Submitted,

                                STAR ENERGY SERVICES LLC

        This report was written by Kristi Robinson, P.E. and Blane Walberg, EIT with
STAR Energy Services LLC under the direction of Guy Colpron, P.E. of BKI Engineering Services.

                                              iii
iv
TABLE OF CONTENTS

1   EXECUTIVE SUMMARY .....................................................................................................1
       1.1 Introduction .............................................................................................................. 1
       1.2 Summary of Projects ................................................................................................. 1
       1.3 Results of Proposed Projects .................................................................................... 2
2   INTRODUCTION ...............................................................................................................3
       2.1 Service Area .............................................................................................................. 3
       2.2 Distribution System ................................................................................................... 3
       2.3 Power Supplier and Transmission System ................................................................ 3
3   BASIS OF STUDY ...............................................................................................................5
       3.1 Design Criteria ........................................................................................................... 5
       3.2 References................................................................................................................. 5
       3.3 Equipment Loading ................................................................................................... 5
4   LOAD ANALYSIS ...............................................................................................................7
       4.1 Purchases .................................................................................................................. 7
       4.2 Losses ........................................................................................................................ 7
       4.3 Growth Patterns ........................................................................................................ 8
                4.3.1         Energy Sales........................................................................................ 8
                4.3.2         Peak Demand ................................................................................... 10
                4.3.3         Load Factor ....................................................................................... 10
       4.4 System Outages and Reliability ............................................................................... 10
       4.5 Advance Metering Infrastructure ........................................................................... 13
5   REQUIRED CONSTRUCTION ITEMS ..................................................................................15
       5.1 New and Upgraded Services ................................................................................... 15
       5.2 Substation Transformers ......................................................................................... 15
       5.3 Big Bar Substation ................................................................................................... 15
       5.4 Douglas City Substation .......................................................................................... 16
       5.5 Forest Glen Substation ............................................................................................ 16
       5.6 Grouse Creek Substation......................................................................................... 16
       5.7 Hayfork Substation.................................................................................................. 16
       5.8 Hyampom Substation.............................................................................................. 17
       5.9 Lewiston Substation ................................................................................................ 17
       5.10 Mill Street Substation ............................................................................................. 18
       5.11 Trinity Substation .................................................................................................... 19
       5.12 Miscellaneous Replacements & Additions .............................................................. 19
                5.12.1        Underground Cable Replacement .................................................... 19
                5.12.2        Pole Replacements ........................................................................... 19
                5.12.3        Metering Replacements ................................................................... 19
                5.12.4        Transformer Installations ................................................................. 19
                5.12.5        Line Regulators ................................................................................. 19
                5.12.6        Line Reclosers ................................................................................... 19
6   COST BY CODES ..............................................................................................................21

                                                                 v
LIST OF ILLUSTRATIONS
TABLES
Table 1.1 Historical and Projected Total Utility Plant Investments .................................................... 1
Table 1.2 Summary of Costs ............................................................................................................... 2
Table 2.1 Transmission Supply to TPUD Substations ......................................................................... 3
Table 3.1 Equipment Loading Actions ................................................................................................ 6
Table 3.2 Overhead Conductor Thermal Limits .................................................................................. 6
Table 4.1 Energy Purchases by Supplier ............................................................................................. 7
Table 4.2 Historical System Losses ..................................................................................................... 7
Table 4.3 Monthly Energy Usage Residential and Small Commercial Classes.................................... 9
Table 4.4 Historical Load Data .......................................................................................................... 10
Table 4.5 SAIDI Indices by Substation............................................................................................... 11
Table 6.1 Substation and Transmission Changes ............................................................................. 21
Table 6.2 Distribution Line Changes ................................................................................................. 21
Table 6.3 Miscellaneous Line Additions and Replacements............................................................. 22
Table 6.4 Summary of Costs Breakdown .......................................................................................... 22
FIGURES
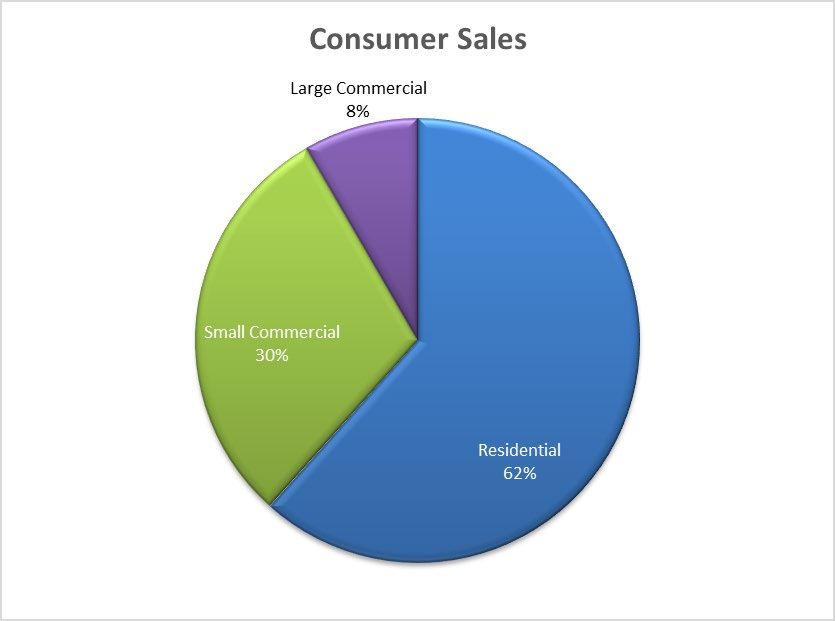
Figure 1 2020 Energy Usage by Classification................................................................................... 8
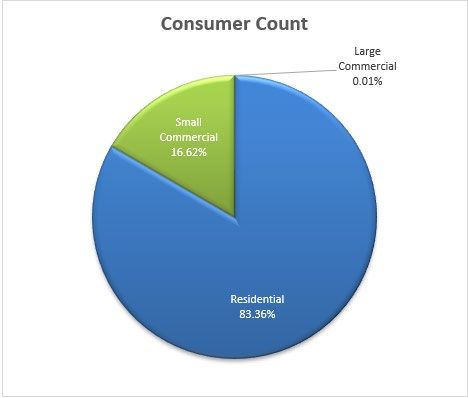
Figure 2 2020 Consumer Classification ............................................................................................. 9
Figure 3 2019 PG&E Substation Outage Causes ............................................................................. 11
Figure 4 2019 WAPA Substation Outage Causes ............................................................................ 12
Figure 5 2020 PG&E Substation Outage Causes ............................................................................. 12
Figure 6 2020 WAPA Substation Outage Causes ............................................................................ 13
vi1 EXECUTIVE SUMMARY
1.1 Introduction
This study was created to outline the proposed distribution and transmission projects for Trinity
Public Utility District (TPUD) for the 2022-2026 time period. This study may be used as an interactive
planning guide for TPUD for the next five years.
This study will review TPUD’s system based on current and forecast conditions, including growth
patterns and distribution facilities statuses. Proposed projects will address changes in system
growth, aging infrastructure, and power quality issues.
TPUD’s historical and projected annual distribution plant investments are shown in Table 1.1. The
distribution capital expenditures proposed for the next four years will result in the total utility plant
increasing at an average annual rate of approximately 3.6%.
Upon completion of the projects proposed in this document, TPUD’s system will continue to be able
to provide adequate and reliable service its consumer base.
Table 1.1 Historical and Projected Total Utility Plant Investments
The goal of this study was to provide a priority list of construction projects to address load growth
and aging infrastructure issues TPUD’s distribution systems is expected to face in during the 2022-
2026 time period. TPUD has experienced growth of large single-phase loads in the recent past, with
additional growth expected in the future. With this growth, potential power quality issues may arise,
which are also addressed within this study. Additional attention was also given to aging facilities that
Trinity Public Utility District (TPUD) 2022-2026 System Improvement Plan Page 1have a direct impact on the reliability of the utility. A summary of the projects identified with in this
study includes:
• Upgrade of Big Bar Substation transformer and high side structure.
• Upgrade of the Grouse Creek Substation structure and transformer replacement.
• Replacement of the Hyampom Substation transformer and regulators.
• Replacement of the Forest Glen Substation transformer.
• Replacement of Mill Street Substation reclosers and controls.
• 8.1 miles of three-phase overhead distribution line replacement to allow for higher
capacity loads.
• An additional 28.9 miles of distribution line identified for potential overhead distribution
replacement.
• A potential extension of 20 miles of 60 kV transmission.
• 5 miles of three-phase underground replacement due to deteriorating cable.
• Various additions and replacements of distribution line equipment.
1.3 Results of Proposed Projects
Upon completion of the recommended projects, TPUD will reduce system losses, provide additional
capacity for current and potential new electric loads, and improve the reliability of service to its
consumers. The summary of costs of the proposed projects are listed in Table 1.2.
Table 1.2 Summary of Costs
Trinity Public Utility District (TPUD) 2022-2026 System Improvement Plan Page 22 INTRODUCTION
2.1 Service Area
TPUD is a distribution cooperative that serves the majority of Trinity County in northern California. With
headquarters in Weaverville, California, TPUD serves 7,322 members. The majority of the members
served are in urban areas. TPUD does serve some rural areas that are mostly residential homes or
agricultural businesses.
2.2 Distribution System
TPUD owns, operates, and maintains a 60 kV transmission and multiple different voltage configurations
of distribution system. Included in TPUD’s system is 600 miles of overhead lines, 150 miles of
underground lines, and nine distribution substations. Of the nine substations, five substations are not
able have a distribution circuit from a neighboring substation provide contingency at the distribution
level. Douglas City, Lewiston, Mill City, and Trinity are able to provide at least partial contingency to
neighboring substations. A summary of the substations owned by TPUD is shown in Table 2.1.
Table 2.1 Transmission Supply to TPUD Substations
TPUD is supplied 100% of the power it needs from Western Area Power Administration (WAPA). WAPA
is a power marketing administration within the US Department of Energy.
TPUD’s substations are served by either 60 kV, 115kV, or 230 kV transmission lines owned and operated by
Pacific Gas & Electric (PG&E) and Western Area Power Administration (WAPA). Transmission supply
accounted for a significant portion of the overall outage time experienced by TPUD’s consumers. In 2019,
consumers on substations served by PG&E transmission lines endured 80 hours of transmission outages
and in 2020, consumers experienced 36 hours of transmission outages. Consumers served by substations
on WAPA transmission lines fared significantly better. In 2019, consumers experienced 19 hours of
transmission outages and in 2020, consumers experienced 5 hours of transmission outages. PG&E
transmission lines have a large amount of exposure and serves the smaller TPUD substations that are in
more rural areas. In recent years, PG&E transmission has been severely affected by wildfires. Additional
information regarding power reliability can be found in Section 4.4.
Trinity Public Utility District (TPUD) 2022-2026 System Improvement Plan Page 3Trinity Public Utility District (TPUD) 2022-2026 System Improvement Plan Page 4
3 BASIS OF STUDY
3.1 Design Criteria
The plans presented in this study are designed to provide a guide for the orderly development of TPUD’s
distribution system. Planning criteria has been established to evaluate the distribution system at TPUD.
The criteria include voltage and line loss levels, conductor and device loading limits, and system
reliability. Other considerations include economic analysis, environmental impact, and future power
supply changes. Some of the specifics of these criteria are as follows:

        •    The minimum voltage on the distribution system is not to be less than 118 volts on a 120-volt
             base under normal peak load conditions. (This assumes the source voltage will be 124 volts.)
        •    The overall design will be based on a balanced system, allowing for one set of voltage
             regulators beyond the substation.
        •    The loading on any conductor is not to exceed 50% of its emergency thermal loading limit.
        •    Single-phase lines with loading of 50 amps or more will be considered to be rebuilt to
             three-phase lines.
        •    Minimum main three-phase feeder size will be 4/0 conductor when reconductoring or
             building new feeder line.
        •    Minimum size conductor considered for use will be either 1/0 ACSR or 1/0 URD.
        •    System improvements will be considered in areas where excessive member outages and
             cable failures occur.
        •    Deteriorated plant replacement, addressing line that is not specifically addressed by excessive
             voltage drop, road projects, or loading, will be a focus to improve reliability. Line replaced
             under this criterion seeks to eliminate undersized wire, reduce voltage drop, decrease losses,
             improve system reliability, and improve safety.
        •    Unfinished work-in-progress projects are assumed to be completed and part of the existing
             system model.

3.2 References
In preparation of this five-year plan, the following documents were used as references:

    •   Trinity Public Utilities District System Improvement Plan – prepared by BKI Engineering, 2016
    •   2012-2021 Fiscal Year Budgets – prepared by TPUD

3.3 Equipment Loading
TPUD designs the distribution system so the minimum voltage is not to exceed 118 volts on a 120-volt
base under normal peak load conditions, assuming a starting voltage of 126 volts. Table 3.1 and Table
3.2 explains the loading levels used by TPUD in planning changes to the distribution system.

Trinity Public Utility District (TPUD) 2022-2026 System Improvement Plan                              Page 5
Table 3.1 Equipment Loading Actions
Assumed conditions are as follows:
2) Wind velocity: 2 feet/second (1.36 mph)
3) Emissivity at 0.5
4) Normal and Emergency limits are based on maximum allowable conductor temperatures of 75o C and 100o
C, respectively
5) Assumed balanced three-phase load at 90% power factor
6) T2-2 and T2-1/0 assumed characteristics thermally of 2/0 and 4/0 ACSR, respectfully
Trinity Public Utility District (TPUD) 2022-2026 System Improvement Plan Page 64 LOAD ANALYSIS
4.1 Purchases
In fiscal year 2020/2021, TPUD purchased 141,300 MWh from WAPA. TPUD is currently forecasting that
energy purchases will stay flat over the next five years for budgeting purposes, as shown in Table 4.1.
However, for this study, moderate and high growth scenarios are assumed.
Table 4.1 Energy Purchases by Supplier
A summary of the energy loss for the past five years is shown below. Energy losses are defined by
subtracting the number of kilowatt-hours sold from the number of kilowatt-hours bought. As shown in
Table 4.2, the five-year average system energy losses remained in the 9% range. Nationally, the average
system losses for electrical utilities are 7%. TPUD’s system losses have been estimated to cost the utility
approximately $317,000 in 2020. As wholesale power costs continue to rise, it is expected that these
same losses will cost the utility more in the future.
One way to decrease electrical losses is to replace older substation and distribution transformers with
more efficient models. Another method to decrease electrical losses is to use larger conductor sizes to
reduce the thermal losses, (Example: using 1/0 or 4/0 ACSR instead of #2 ACSR on main three-phase
lines.) A reduction of 1% in losses results in annual saving of $45,000.
Table 4.2 Historical System Losses
Trinity Public Utility District (TPUD) 2022-2026 System Improvement Plan Page 74.3 Growth Patterns
4.3.1 Energy Sales
In the past ten years, there has been an average of a 0.16%-consumer increase per year; in the past five
years, the average consumer increase per year was 0.12%. During those time periods, energy sales have
increased on average 3.2% per year over ten years and increased on average 4.58% per year over five
years. A summary of the member and load data for the time period of 2009-2021 is presented in Table 4.4.
In 2020, the total energy sales were 141,260 MWh. The breakdown of consumers and energy sales by
consumer classification for TPUD is shown in Figures 1 and 2. A further break down can be found in
Table 4.3.
Figure 1 2020 Energy Usage by Classification
Trinity Public Utility District (TPUD) 2022-2026 System Improvement Plan Page 8Figure 2 2020 Consumer Classification
Residential and small commercial average monthly energy usage has stayed consistent over the past five
years from the average high of 1,173 kWh in 2019/2020 to the low of 1,200 kWh in 2016/2017. It is not
expected that the average monthly energy usage for residential and small commercial services will
increase significantly in the next five years.
Table 4.3 Monthly Energy Usage Residential and Small Commercial Classes
Trinity Public Utility District (TPUD) 2022-2026 System Improvement Plan Page 9Table 4.4 Historical Load Data
• Data compiled from TPUD’s financial reports
• Averages computed by taking average of past 5 or 10 years
4.3.2 Peak Demand
The peak system demand to date was 28,322 kW, which occurred in fiscal year 2020/2021. Historically,
the system peak has occurred in the winter months. As shown in Table 4.4, over the past ten years the
system peak on average has increased by 27.32%.
4.3.3 Load Factor
During the past five years, the average annual load factor has been 56.81%, which is consistent with the
average load factor of 56.05% for the past ten years. It is expected that the load factor will remain at
56% for the next five years.
4.4 System Outages and Reliability
Power reliability varies dramatically for TPUD’s consumers depending on what substation they are
served from. This is mostly due to weather events that may happen, affecting transmission and the
distribution system. In 2019 and 2020, the 341 electric services served from PG&E fed substations, (Big
Bar, Forest Glen, Grouse Creek, and Hyampom), experienced an average outage duration of 124 hours
and 69 hours, respectively. In contrast, the 6,673 electric services served from WAPA fed substations,
(Douglas City, Hayfork, Lewiston and Mill Street), experienced an average outage duration of 24 hours
and 27 hours in 2019 and 2020, respectively.
The substations served by PG&E transmission are very rural; therefore, are more likely affected by the
long transmission exposure. In addition, weather caused outages on the distribution system contribute
to longer restoration durations due to the remote locations of the substations and their electric services.
Trinity Public Utility District (TPUD) 2022-2026 System Improvement Plan Page 10Methods to increase reliability include adding distribution tie lines between separate circuits. Reliability
tracking should also minimize the number of “unknown” outages to better address reoccurring outage
issues.
Table 4.5 SAIDI Indices by Substation
SAIDI: System Average Interruption Duration Index. The total sustained
interruption duration for the average consumer during a calendar year.
Figure 3 2019 PG&E Substation Outage Causes
Trinity Public Utility District (TPUD) 2022-2026 System Improvement Plan Page 11Figure 4 2019 WAPA Substation Outage Causes Trinity Public Utility District (TPUD) 2022-2026 System Improvement Plan Page 12
Figure 6 2020 WAPA Substation Outage Causes

TPUD deployed Aclara TWAC PLC AMI in 2019. The two-way AMI meters will allow for more advanced
metering capabilities, such as automatic outage notification. The AMI deployment was completed in the
2020/2021 fiscal year. TPUD expects only to deploy new metering to approximately 100 services per
year during the next five years.

Trinity Public Utility District (TPUD) 2022-2026 System Improvement Plan                      Page 13
Trinity Public Utility District (TPUD) 2022-2026 System Improvement Plan Page 14
5 REQUIRED CONSTRUCTION ITEMS

5.1 New and Upgraded Services
It is expected TPUD will provide service to approximately 20 new services per year for a total of 100 new
services during the 2022-2026 time period. In addition, TPUD is expected to upgrade approximately 50
services each year. The expense for the new services and service upgrades will be offset by TPUD’s
contribution in aid policy.

5.2 Substation Transformers
In the following sections, there will be discussion to replace the existing substation transformers at
various substation locations. Currently, TPUD prefers to use single-phase substation transformers.
Unfortunately, there are very few transformer manufacturers that will build 60 kV and above single-
phase transformers that transform voltage to 12.5 kV. The industry standard for substation transformers
are now three-phase transformers with the smallest size available typically a 5 MVA. Many transformer
manufacturers will either refuse to build transformers smaller than a three-phase 5 MVA or will charge
more for smaller single-phase substation transformers.

While a few transformer manufacturers, such as Virginia Transformers, will still build a 60 kV/12.5 KV
single-phase transformer, TPUD may choose to request the single-phase substation transformers rebuilt
with various vendors, such as Jordan Transformers, T&R Electric or Solomon Corporation. The cost to
purchase a refurbished unit will be significantly less than purchasing new. Do note, all estimated costs
listed for substation transformers are for new three-phase units.

5.3 Big Bar Substation
The distribution system served by the Big Bar Substation does not require any specific line replacement
or upgrade to serve the existing load. Big Bar Substation is not expected to have much load growth in
the next five years. While the Big Bar Substation does experience a significant duration of power
outages, the outages are mainly due to transmission outages from PG&E.

The Big Bar Substation is currently comprised of three single-phase substation transformers sized at 250
kVA, 333 kVA, and 333kVA with three single-phase regulators sized at 200 amps each. The transformers
in the Big Bar Substation are 1960 vintage and should be either rebuilt or exchanged for a new three-
phase 5 MVA transformer. If the single-phase transformers are changed to a new three-phase
transformer, the foundation for the transformer will most likely need to be expanded. The estimated
cost to expand the substation foundation and change the substation transformers to a three-phase 5
MVA transformer is $350,000. This project is identified as Project BB-1.

In addition to Project BB-1, Project BB-2 is the replacement of the high side structure of the Big Bar
Substation. The high side structure of the Big Bar Substation is currently a wooden structure. The wood
structure is subjected to rot, flashover, and potential wildfires. The cost to replace the high side
substation structure with steel construction is estimated at $200,000.

Trinity Public Utility District (TPUD) 2022-2026 System Improvement Plan                          Page 15
5.4 Douglas City Substation
The Douglas City Substation currently serves approximately 1,630 electric services. The substation area
is expected to grow approximately 2% annually for the next five years. Even with the planned growth,
there are no distribution line projects planned for this substation area.

The Douglas City Substation is comprised of three single-phase 1 MW transformers and three single-
phase 200-amp regulators. The substation equipment is approximately 15-20 years in age and in good
condition. The Douglas City Substation can provide contingency electric supply to Lewiston and Mill
Street Substations.

When Douglas City Substation provides contingency service to Lewiston Substation Circuit 1101, low
voltage can occur and potentially a thermal overload. A lower priority project would be to upgrade
Douglas City Substation Circuit 1101 for 3.5 miles from three-phase #2 ACSR to three-phase 4/0 ACSR.
This project, Project DC-1, is estimated to cost $1,790,000.

5.5 Forest Glen Substation
The Forest Glen Substation serves under 30 services, with most of them idle due to wildfires in the
recent years. There is no expectation that electric load will grow in the next five years.

The transformer in the Forest Glen Substation is approaching the end of its useful life at 53 years old.
However, until a clearer picture of whether electric load will return, the recommendation is to not
replace the substation transformer immediately. If the load was to return during the 2022-2026 time
period, the estimated cost to replace the transformer is $300,000. TPUD may have a suitable three-
phase pad mount transformer already stored in inventory. This project is known as Project FG-1.

5.6 Grouse Creek Substation
The Grouse Creek Substation serves a handful of permanent services with a single-phase 250 kVA
transformer. There is no expectation that electric load will grow in the next five years. There are no
distribution line projects planned for this substation area.

The single-phase transformer in the Grouse Creek Substation is approaching the end of its useful life at
56 years old. By the end of the five-year period, the transformer will be over 60 years old. Oil testing has
not shown signs of deterioration; however, plans should be made to replace this transformer unit.
Project GC-1, the replacement of a 60 KV/12.5 KV 333 kVA transformer, is expected to cost $120,000.

In addition, the substation is currently of wooden frame construction. As wood structures are subjected
to rot, flashover, and potential wildfires, it is recommended to rebuild the substation in steel
construction. The rebuilding of the Grouse Creek Substation, Project GC-2, is expected to cost $200,000.

5.7 Hayfork Substation
The Hayfork Substation is a dual transformer substation, with both a 7 MVA and 12 MVA three-phase
substation transformer inside. There are three circuits that serve the electric load, with Circuit 1201
being the heaviest loaded at 2.2 MW. The Hayfork Substation serves approximately 20% of TPUD’s
consumers.

Trinity Public Utility District (TPUD) 2022-2026 System Improvement Plan                             Page 16
Currently, low voltages issues exist on Circuit 1201, which will only get worse as the Hayfork Substation
continues to see 2% annual load growth. With the expected growth, the existing conductor will be
thermally overloaded by the end of 2026.

Project HF-1 is the rebuilding of Circuit 1201 from #2 ACSR to 4/0 ACSR from the Hayfork Substation for
approximately 1.2 miles. This project is estimated to cost $600,000.

Circuit 1202 and 1203 are also expected to see 2% annual growth. These circuits are currently lighter
loaded than Circuit 1201. While these circuits should not see thermal or power quality issues during the
next five years, it is advisable to consider replacing the first mile of Circuit 1202 out of the substation
with 397 AAC. This project, Project HF-2, is estimated to cost $1,480,000.

The option does exist to extend 14 miles of three-phase 4/0 AL cable from Hayfork Substation Circuit 1203
to the Forest Glen Substation area. This project, Project HF-3, is expected to cost $3,500,000. The three-
phase extension also allows for the possibility to serve the Trinity Pines area and other electrical loads.

5.8 Hyampom Substation
The Hyampom Substation is comprised of three single-phase 667 kVA transformers. Oil testing indicated
significant degrading to the transformers leading to the increase probability of the transformers
malfunctioning. As the Hyampom Substation cannot be back fed by a neighboring substation, an outage
due to the Hyampom Substation transformers failing will lead to a prolonged outage for the 185 electric
services on this substation.

The estimated cost to replace the existing transformers with a 5 MVA three-phase transformer is
$450,000; including foundation modifications and new 219-amp regulators. This is known as Project HY-1.

Minor growth of 1% annual is expected to occur on the Hyampom Substation. With the projected
growth, there are no distribution line projects planned for this substation area.

The electric services on the Hyampom Substation area experienced an average of 131 hours of outage
duration in 2019 and an average of 57 outage hours in 2020. The leading cause of the outages is due to
transmission outages from PG&E. An optional transmission project to increase the reliability to the
Hyampom Substation area, Project HY-2, is to extend 60 kV line approximately 20 miles from Hayfork
Substation. The cost of the transmission line extension is estimated at $4 million per mile, due to the
terrain and right-of-way acquisition.

5.9 Lewiston Substation
The Lewiston Substation is a double-ended substation with each end comprising of three 3,333 kVA
single-phase transformers. The Lewiston Substation can provide contingency power supply to the
Douglas City Substation. Lewiston Substation currently serves approximately 1,630 electric services.

Trinity Public Utility District (TPUD) 2022-2026 System Improvement Plan                            Page 17
During a contingency situation, when Lewiston Substation is providing electric service to Douglas City
Substation load, there will be significant voltage drop issues that cannot all be addressed with additional
distribution regulation. It is recommended that it be the long-term goal to extend three-phase 4/0 AL or
4/0 ACSR to Douglas City Circuit 1101 at Switch 3143. This project, Project LE-1, is approximately 8.5
miles of three-phase #2 ACSR that would need to be rebuilt to 397 AAC at an estimated cost of
$3,590,000.

5.10 Mill Street Substation
The Mill Street Substation is similar in construction to the Lewiston Substation, with three 3,333 kVA
transformers setup in two separated substation bays. Each substation bay has three 668-amp single-
phase regulators. TPUD’s industrial consumer is located on Circuit 1102 and this circuit is expected to
see 2% annual growth over the next five years.

Multiple different distribution line projects have been identified for this substation area. The projects
are due to load growth in the area.

Recommended on the Mill Street Substation area is the rebuilding of three-phase #2 ACSR to three-
phase 4/0 on Circuit 1102 from Fuse 1102 to Pole 10929 for approximately 3.5 miles. This project,
Project MS-1, is needed to address low voltage and potential thermal overloading issues. The cost
estimate of this project is $1,750,000.

It is also recommended as a project to rebuild from three-phase #2 ACSR to three-phase 397 AAC on
Circuit 1103 from the substation for approximately 1 mile. This project, Project MS-2, is needed to address
low voltage and thermal overloading issues. The cost estimate of this project is $511,000.

Another identified project, Project MS-3, is the rebuilding of three-phase #2 ACSR to three-phase 397
AAC on Circuit 1106 from the substation for approximately 1.4 miles. In addition, two sets of distribution
line regulators are recommended to address low voltage issues. The cost estimate of this project is
$715,000.

Lastly, it is highly recommended to rebuild three-phase #2 ACSR to three-phase 4/0 ACSR on Circuit
1107 from the substation for approximately 1 mile. Circuit 1107 has various segments of the distribution
system ranging between #2 ACSR to 4/0 ACSR for the first three miles from the substation. This project,
Project MS-4, is needed to address low voltage issues. The cost estimate of this project is $500,000.

In addition to the distribution projects identified in this section, it is also recommended that the recloser
controls located in the Mill Street Substation be upgraded from the Cooper Form C to Cooper Form 7
controllers. With this change, it is also recommended that any oil filled reclosers within the substation
be changed to vacuum reclosers. Each circuit recloser bank replacement with updated controls is
expected to cost $87,500. In this project, Project MS-5, it is assumed four (4) banks of reclosers are to be
changed out for a total estimated cost of $350,000.

Trinity Public Utility District (TPUD) 2022-2026 System Improvement Plan                             Page 18
5.11 Trinity Substation
The Trinity Substation is owned and operated by WAPA. The substation is comprised of two 30 MW
three-phase three-winding transformers. The 230kV/60 kV windings of the Trinity Substation leave the
Trinity Substation as a transmission circuit to the Lewiston Substation, Douglas City Substation, and Mill
Street Substation. The other transformer winding is 21 KV and is transformed further outside the
substation at a 21kV/12 kV 2.5 MW pad mount transformer. This distribution circuit then continues
north around Trinity Lake towards the Trinity Center Airport. In addition, the 21 kV circuit from the
Trinity Substation extends north approximately 11 miles to where is there is another 21kV/12 kV 2.5
MW pad mount transformer that can be tied into the north Trinity circuit for redundancy. No
distribution or transmission projects have been identified for the Trinity Substation area.

5.12 Miscellaneous Replacements & Additions

5.12.1 Underground Cable Replacement
    TPUD should plan to replace one mile of three-phase underground cable on an annual basis due to
    the eroding of the concentric neutral from cable installed in the 1970-1980s. If the conductor to be
    replaced is part of the circuit backbone, it is strongly encouraged the cable installed be upgraded to
    4/0 AL. The estimated cost annually is $320,000. Environmental planning costs are not included in
    this estimate.

5.12.2 Pole Replacements
    With the existing pole testing process, TPUD should expect to change out approximately 225 poles
    per year. Annually, this would be a cost of approximately $450,000 per year.

5.12.3 Metering Replacements
    TPUD finished the deployment of Aclara TWAC PLC AMI system in the fiscal year 2020/2021. While all
    meters have been changed out, TPUD will still expect to add or change out approximately 100 meters
    annually. The cost of the metering on an annual basis is estimated at $20,000 per year.

5.12.4 Transformer Installations
    While there still are a few new electric services occurring annually, TPUD’s load growth is mainly due
    to existing services upgrading in size. Between the new services and upgrading of existing services,
    along with normal equipment replacement, TPUD will need to budget for approximately $126,000 in
    distribution transformer purchases and installation annually.

5.12.5 Line Regulators
    TPUD should plan to add three (3) line regulators annually to assist with continual growth on the
    distribution system. The cost of the line regulators and installation is estimated at $60,000 annually.

5.12.6 Line Reclosers
    TPUD should plan to add one (1) three-phase bank of line reclosers annually to continue to
    sectionalize the distribution system to help with reliability improvement. The estimated cost of the
    three-phase line reclosers bank and installation is estimated at $60,000 annually.

Trinity Public Utility District (TPUD) 2022-2026 System Improvement Plan                            Page 19
Trinity Public Utility District (TPUD) 2022-2026 System Improvement Plan Page 20
6 COST BY CODES
The following section includes detailed information on the projects planned for the 2022-2026 time
period.

                              Table 6.1 Substation and Transmission Changes

                                                Distribution Line Changes

Trinity Public Utility District (TPUD) 2022-2026 System Improvement Plan                      Page 21
Table 6.3 Miscellaneous Line Additions and Replacements
Table 6.4 Summary of Costs Breakdown
Trinity Public Utility District (TPUD) 2022-2026 System Improvement Plan Page 22You can also read