MELBOURNE WATER'S APPROACH TO RENEWALS AND MAXIMISING ASSET LIFE FOR AERATION BLOWERS AT EASTERN TREATMENT PLANT
←
→
Page content transcription
If your browser does not render page correctly, please read the page content below
MELBOURNE WATER’S APPROACH TO RENEWALS AND MAXIMISING ASSET LIFE
FOR AERATION BLOWERS AT EASTERN TREATMENT PLANT
Scott White 1, John Mieog 1, Julian Morton 1
1. Melbourne Water, Melbourne, VIC, Australia
ABSTRACT over the next 5-10 years (at a replacement cost of
The selection of the number of assets to provide an $3M to $4M per blower) to maintain an appropriate
appropriate level of service is often a challenging level of blower availability. In addition to replacing
aspect of treatment plant design. This challenge is the existing blowers, previous approaches included
further exacerbated when assets are evaluated for the provision of additional blowers to maintain the
renewal due to their perceived or actual past traditional N+2 level of redundancy at average
operational performance, particularly if asset loads as aeration demand increased through load
availability and failure data is not specifically growth. The alternative approach presented here
recorded. The System Resilience approach seeks to define the risk of poor process
quantifies the system demand distribution, future performance based on the composition of blowers
demand forecasts and asset availabilities to installed using a System Resilience approach. This
calculate a probability of servicing these demands. approach can be used to model systems containing
This approach has been applied to the Eastern units with different availabilities to determine if
Treatment Plant Blower Renewal Project and has complete replacement, partial replacement or
allowed Melbourne Water to delay full renewal of higher redundancy will result in the lowest whole-of-
the assets through the quantification and life costs for a given risk profile. In this case the
management of the risks associated with keeping lowest whole of life cost is achieved by maximising
older equipment in service past its nominal design the service life of the ageing Bryan Donkin blowers
life. whilst managing the product water quality and
supply risks associated with older, potentially less
INTRODUCTION reliable assets through refined maintenance
practices.
The secondary treatment process at Melbourne
Water’s Eastern Treatment Plant (ETP) is a step
feed activated sludge process and was constructed TRADITIONAL VS. SYSTEM RESILIENCE
with the original plant in 1975. In 2007 the APPROACH
secondary process was upgraded to include The traditional approach to managing system
ammonia reduction, in 2012 a downstream Tertiary availability is based on fixed asset availability and
Treatment Step (TTS) was added, and in 2013 the fixed levels of service at average and peak
6 aeration tanks were augmented to 10 tanks to demands, which in turn equates to a fixed number
complete the conversion to ammonia reduction and of standby assets at average and peak demands.
accommodate load growth. In order to produce This approach is an event-based approach, treating
Class A recycled water both reliably and cost average and peak demands as events. Historically
effectively the TTS requires secondary effluent with the general approach to designating Levels of
a stable ammonia concentration of less than Service (LoS) and redundancy was largely
5 mg/L. This requires the secondary activated qualitative and was not directly linked back to
sludge process to have an adequate and consistent demonstrable asset availabilities or the broader
supply of oxygen to support the required degree of treatment and service objectives. As a result it was
ammonia reduction through nitrification. The ETP difficult to pin-point the root cause when the system
uses turbo compressor blowers to supply air to the did not perform as anticipated.
secondary process. The current configuration
consists of 6 No. 930 kW Bryan Donkin Blowers The System Resilience approach uses quantitative
that were installed in 1975, a smaller 730 kW Bryan risk-based modelling to assess the capacity of a
Donkin Blower which was installed in 2009 as an system of assets to service a demand. This
emergency replacement and 2 No. 1100 kW HV approach directly links the utilisation of a group of
Turbo Blowers were installed in 2011. assets using a demand profile with their availability.
The output of the modelling exercise is what is
The Bryan Donkin Blowers are 38 years old, are termed “System Resilience”. The System
considered close to the end of their useful life, and Resilience in this case is the probability of the
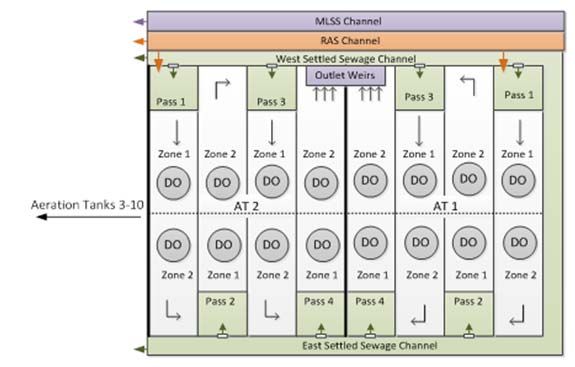
are notionally scheduled for proactive replacement system successfully servicing the full range of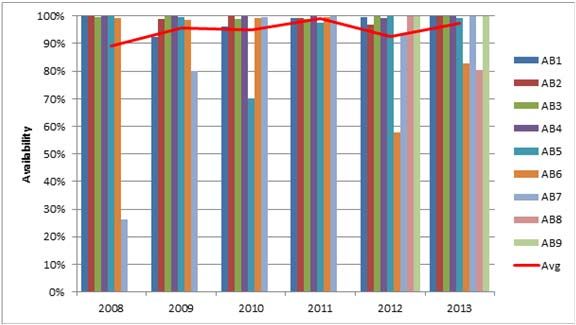
demands it will be subjected to. This approach was       at the head of each pass for partial de-nitrification.
originally developed specifically for the ETP Blower     Return Activated Sludge (RAS) and primary effluent
Renewal Project.         Following this successful       are fed into the anoxic zone of Pass 1 whilst only
application, the System Resilience approach has          primary sewage is fed into the anoxic zones of the
now been formalised as a decision support tool for       other 3 passes as shown below in Figure 2.
similar projects within Melbourne Water.

As with the any model the outputs are open to
interpretation. In order for the data to be useful a
holistic    understanding     of   the    processes
underpinning the operation of the system is
required, as is an understanding of the LoS
required from the system to develop appropriate
System Resilience targets.

DEVELOPMENT OF HOLISTIC
UNDERSTANDING OF THE SYSTEM
Physical System                                                    Figure 2: Process Configuration
In order to apply a quantitative risk-based approach
to the provision of blower capacity a holistic           A benefit of this process configuration is that the
understanding of the system’s physical and process       majority of primary effluent will pass through
response to air supply reliability is required. At the   multiple passes. This configuration provides a
ETP the blowers supply air to a common aeration          degree of inherent elasticity in terms of sensitivity to
header which in turn supplies the aeration zones in      disturbances in the availability of air as the target
the aeration tanks as shown in Figure 1. The             level of nitrification doesn’t need to occur until
blowers then modulate to meet a variable header          discharge via the 4th pass outlet weirs. As a result,
pressure set point based on the current demand of        failing to supply 100% of the instantaneous process
the system. With this configuration the header           air demand in the upstream passes will not
pressure will drop below set point in two                necessarily result in failure to meet the ammonia
circumstances:                                           treatment performance objective (i.e. secondary
    1. If aeration demand exceeds aeration               effluent ammonia >5 mg/L).
        supply the header pressure will drop below
        set point in response to the majority of         The step feed configuration also allows for the
        aeration zone control valves opening up.         relative primary effluent inflow to each pass to be
    2. When blowers are started or stopped the           varied by changing the position of the pass inlet
        header pressure will generally dip below         gates. This feature is used to reduce solids
        set point to prevent the blowers from            loadings on the downstream clarifiers by prioritising
        surging.                                         flow to the 4th pass. This effectively holds the solids
The system also has the capability to vary the           back in passes 1-3, but the reduction in the
header pressure set point to reduce the pressure         hydraulic retention time of the 4th pass can impact
losses across the control valves to reduce power         ammonia reduction and hence secondary effluent
consumption..                                            ammonia concentration. The design intent is to use
                                                         this capability during wet weather flows to maintain
                                                         acceptable treatment while reducing the risk of
         P
                                                         biomass washout. Prior to the commissioning of the
                                                         4 additional aeration tanks this feature was also
          Main Blower

                                                         used during dry weather conditions when the solids
            Header

                               DO
                        FE
                             Control
                                                         inventory was high and settling was poor to reduce
                                                         the solids loading on the clarifiers. This resulted in
                                       DO
                                                         ammonia exceeding the 5 mg/L target during dry
                                                         weather diurnal peaks.

                                                         REVIEW OF HISTORICAL DATA AND
                                                         PERFORMANCE
          Figure 1: Physical Configuration               The historical operating and performance data was
                                                         reviewed to understand the frequency that air
                                                         demand exceeded the supply capacity and the
Treatment Process                                        impact that this had on process performance. The
                                                         first review was of header pressure versus set point
The step feed activated sludge process consists of
                                                         and the number of blowers operating when header
4 passes in each aeration tank with an anoxic zone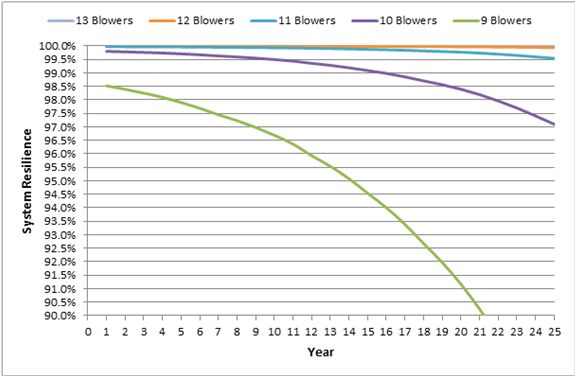
pressure deviated more than 0.5 kPa from the set                                                    control of peak secondary effluent ammonia
point (which is typically between 51 kPa and                                                        concentration. This has effectively reduced the
52 kPa). This provides an indicator of the cause of                                                 tolerable risk of secondary effluent ammonia spikes
the deviation. If the pressure dip occurs when all                                                  due to insufficient activated sludge aeration air
the blowers are operating then it is indicative of                                                  supply. Without higher resolution data (i.e. online) it
demand exceeding supply. However, if the drop is                                                    is not possible to draw conclusions around the
centred around the average number of operating                                                      degree of short term spikes that occurred when the
blowers then it is likely to be caused by blowers                                                   header pressure set point deviation was higher in
turning on or off to meet demand variations. This is                                                the past.
illustrated in Figure 3 below.
                                                                                                                                                   Wet Weather Event(s)   Other Event   Header Pressure Non‐Compliance
From 2008-2010 there were 7 blowers installed at                                                                                           20.0%

the ETP and demand, at times, outstripped supply.

                                                                                                    Header Pressure Set Point Deviations
                                                                                                                                           18.0%

                                                                                                      Samples with Ammonia > 5 mg/L
This is shown in Figure 3 by a relatively large                                                                                            16.0%

deviation from header pressure set point occurring                                                                                         14.0%

when 6-7 blowers where operating. This situation is                                                                                        12.0%

reversed in 2011 when two additional blowers were                                                                                          10.0%

                                                                                                                                            8.0%
added and the header pressure deviations occur                                                                                              6.0%
during the operation of 5-6 blowers. This is                                                                                                4.0%
associated with additional blowers coming online to                                                                                         2.0%
service the diurnal peak.                                                                                                                   0.0%
                                                                                                                                                   2008           2009         2010         2011            2012

                                      14.00%                                                                                               Figure 4: Process Performance vs. Header
  Proportion of Header Pressure Set

                                      12.00%                                                                                                      Pressure Set Point Deviation
                                      10.00%
          Point Deviations

                                       8.00%
                                                                                             2012   APPLICATION OF THE SYSTEM RESILIENCE
                                       6.00%
                                                                                             2011   MODEL
                                                                                             2010
                                       4.00%                                                 2009
                                                                                                    Applying the model to a scenario and interpreting
                                       2.00%                                                 2008
                                                                                                    the results is a four stage process summarised in
                                       0.00%                                                        Figure 5 below. Steps 1 to 3 require the user of the
                                               1   2       3     4    5     6        7   8
                                                                                                    model to gather and critique historical data and
                                                       Number of Blowers Operating
                                                                                                    forecasts to develop the System Resilience
 Figure 3: Cumulative Header Pressure Set Point                                                     forecasts produced for Step 4. The inputs were split
                    Deviation                                                                       into three discrete steps to align with the three
                                                                                                    stakeholder groups within Melbourne Water that will
The next step of the review was to assess the                                                       be responsible for revising the inputs if there is a
impact of header pressure set point deviations on                                                   change (i.e successful optimisation project) or the
process performance and water quality in order to                                                   original values prove to be incorrect. In this
inform the tolerable level of risk to be accepted. As                                               example the Process Management Team is
shown in Figure 4 there is no clear relationship                                                    responsible for the operational distribution, Asset
between the historical levels of header pressure set                                                Planning for demand forecasting and Operations
point deviation and process performance at the                                                      and Maintenance for achieving target asset
levels of deviation experienced. This would indicate                                                availabilities. This approach provides a clear
that the levels of header pressure set point                                                        delineation of accountabilities to achieve agreed
deviation observed in the past were not high                                                        outcomes while also facilitating all three groups to
enough to significantly impact the performance of                                                   work together to achieve the overall service
the process in terms of secondary effluent ammonia                                                  outcome.
concentration. However, the secondary effluent
ammonia samples are 24 hour composite samples.
This will have the effect of dampening the actual
concentration variability and could have masked
short spikes.

While the introduction of the tertiary treatment step
in 2012 was accompanied by more stringent EPA
Victoria environmental discharge limits for
ammonia, the upper limit remains a 90th percentile
which means that short term ammonia spikes are
tolerable for environmental discharge. However, the
reliable production of Class A recycled water using
stable free chlorine disinfection also requires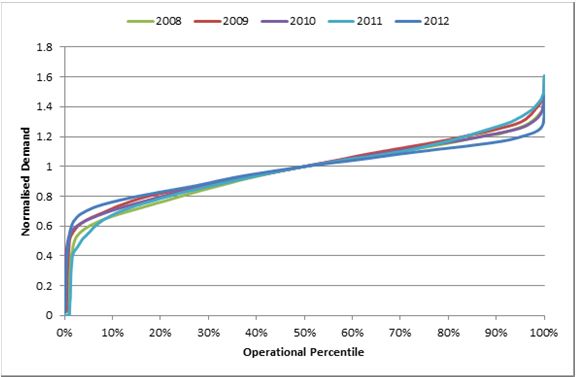
and also to allow the distributions to be used to
              Step 1 ‐ Operational Distribution                     extrapolate future asset utilisation based on a
                          Historical
                                                                    predicted 50th percentile air demand. The 2011
 Historical Data                             Fixed component?       operational distribution was used in the System
                          Performance
                                                                    Resilience Model because it had the highest dry
                                                                    weather water quality, indicating minimal process
                   Step 2 ‐ Demand Forecasting
                                                                    disruptions during this year. The 2011 distribution
 Forecast future P50      Confidence in      Level of
 demands                  forecasts?         conservatism?          also has the highest peaking factor, making it the
                                                                    most conservative distribution to use for forecasting
                                                                    future asset utilisation levels. Overall though the
                   Step 3 ‐ System Composition                      distributions from year to year do not vary
 Asset Availability       Asset Capacity     Asset degredation      significantly, indicating a stable process and
                                                                    sewage quality.
                      Step 4 ‐ System Resilience
 Consequences of          Confidence in
 failure?                 inputs?
                                             Sensitivity analysis   STEP 2: DEMAND FORECASTING
        Figure 5: System Resilience Procedure                       Demand forecasting can be included to extend the
                                                                    System Resilience approach to the provision of
                                                                    future capacity and to optimise investment. This is
                                                                    undertaken by applying the distribution created
STEP 1: PROCESS DEMAND DISTRIBUTION                                 during Step 1 to the estimated demands for future
CREATION AND SELECTION                                              years to create an asset utilisation profile. The
The proposed System Resilience approach is                          System Resilience profile for future years for
underpinned by the selection of an appropriate                      different numbers of installed assets can then be
historical dataset that is reflective of the full range             calculated using the utilisation profile and asset
of demands on the system and their frequency. The                   availabilities.
purpose of this step is to determine the level of
asset utilisation required to service 100% of the                   For the ETP Blower Renewal Project growth in the
demand. The resolution of the dataset must be fine                  air demands consists of an independent fixed
enough to demonstrate peaks that would stress or                    demand (associated with channel mixing and air lift
overcome the system and must also accurately                        pump systems) and a variable component
provide their magnitude. Ideally the dataset will be                associated with the activated sludge biological
collected upstream of the assets so that there is                   treatment process. The fixed demand has the
true independence between the distribution                          potential to increase or decrease over a planning
generated and the reliability of the assets in                      horizon depending on the outcome of a current
question. However, often upstream data will not be                  energy efficiency investigation to replace the return
available as is the case with the aeration blowers,                 activated sludge airlift pumps with centrifugal
which used data from the downstream flow meters.                    pumps, as well as the timing of additional aeration
                                                                    tanks and associated additional channels to cater
                                                                    for growth. The variable process demand
                                                                    component is forecast to grow in-line with growth
                                                                    forecasts for the ETP. The analysis presented here
                                                                    is based on a forecast growth rate of approximately
                                                                    1% per year.

                                                                    STEP 3: SYSTEM COMPOSITION
                                                                    The system composition is the number, capacity
                                                                    and availability of the assets. The availability of the
                                                                    assets is the most complex parameter to forecast
                                                                    as it is impacted on by a number of physical and
                                                                    organisational factors. The organisational factors
            Figure 6: Operational Distributions                     that impact the blowers at the ETP include retention
                                                                    of skilled employees, spares management and
Figure 6 illustrates the operational distributions for              contractor availability which all impact on Mean
the secondary treatment process air demand for                      Time to Repair (MTTR). Physical factors such as
each year from 2008 to 2012. The distributions                      component failure modes and equipment overhaul
were created using normalised airflow data from the                 requirements can also result in inconsistent
sum of flow meters in each aeration zone. The                       availabilities if not accounted for.
airflow data was normalised to the 50th percentile to
allow the direct comparison of the relative                         The approach taken to forecasting the availability of
differences between the distributions for each year                 the blowers at the ETP was a top down approach
                                                                    supported by bottom up risk assessments. Figure 7
illustrates the historical availability of the individual This is calculated by initially giving the event a
blowers and as an average from 2008 to 2013. probability of 1 and then subtracting the
Over the past 6 years individual blower unit probabilities of the event not occurring. Equations 1
availability has varied between 89% and 99% per and 2 define the utilisation and availability of the
year depending on the number of major overhauls subgroups of assets within the system. An example
and catastrophic failures in a given year. If the three of this would be 5 of 9 blowers having a utilisation
catastrophic failures that resulted in prolonged of 80% and availability of 98%. Equation 3 sums
outages are excluded the lower bound of the utilisation and availabilities of the system’s
availabilities over this period increases to 96%. Two individual subgroups for each year to calculate the
catastrophic failures were the result of reverse System Resilience.. This approach requires that
rotation without lubrication and one was caused by availability of the assets is independent from their
the recirculation valve failing to close resulting in utilisation.
overheating. Risk assessments following these
failures have resulted in the installation of additional (Equation 1)
protective systems to reduce the risk of
reoccurrence to negligible levels. (Equation 2)
Based on the historical availability levels and 1 ∑ 1
subsequent risk mitigation of catastrophic failures, (Equation 3)
an individual blower unit design availability of 95%
was selected for the Bryan Donkin Blowers. This The target or design System Resilience will be
provides a safety margin (on historical values) in unique for each system and influenced by the level
the range of 1-3% depending on the scheduling of of performance that is required and the risk profile
major overhauls. The safety margin is equivalent to of the organisation. As System Resilience is a
one blower out of a total of nine being offline for an probabilistic indicator of system performance and is
additional 30 to 100 days per year. The new HV based on a single process input there may be a
Turbo blowers are more reliable and were given a degree of elasticity when comparing the System
design availability of 96.5% Resilience to the process performance, which is
influenced by multiple variables. The key target for
the ETP is to produce Class A recycled water with
an availability of ≥98% of the time.
Figure 8 below plots the System Resilience
calculated from historical data against a number of
system performance metrics. In the order of the
process path, the first of these metrics is header
pressure set point deviations which represents the
capacity of the blowers to meet the process air
demands, and the second is process performance
targets which include a secondary effluent
Figure 7: Historical Availability of Individual Blower ammonia concentration target ofWet Weather Event(s) Other Event the 98% will also be reassessed once the system
Header Pressure Set Point Deviations System Resilience has operated at this level for a prolonged period.
20.0% 100%
Header Pressure Set Point Deviations
Samples with Ammonia > 5 mg/L
18.0% 90%
16.0% 80%
CONCLUSIONS
System Resilience
14.0% 70%
12.0% 60% The application of the System Resilience model to
10.0% 50%
the secondary process at the ETP allowed the
8.0% 40%
6.0% 30%
engineering problem to be redefined from an asset
4.0% 20% centric equipment availability management problem
2.0% 10% to a customer focused product supply problem.
0.0% 0% Redefining the problem and solving it through the
2008 2009 2010 2011 2012
System Resilience approach had several benefits
Figure 8: Historical System Resilience vs. System for Melbourne Water. The first was that it
Performance demonstrated in a quantifiable way that a mix of
new and old blowers was capable of supplying air
The sensitivity of the System Resilience to to the secondary process at an acceptable level of
increases in air demand was also analysed risk. As a result the replacement of the 38 year old
because this is primarily driven by the incoming original plant blowers has been delayed until such a
flows and loads and is the variable Melbourne time that they are no longer able to provide the
Water has the least control over. Figure 9 presents required system resilience economically. This is
the System Resilience for different numbers of projected to significantly reduce the lifecycle costs
blowers over time as the ETP load grows. This for the aeration blowers.
indicates that System Resilience begins to decline
rapidly once it passes below 98% based on a Secondly, through this approach each variable as
modest demand growth rate of 1% per annum. identified in Steps 1-3 could be targeted and
optimised individually. This process of individually
identifying and quantifying the variables improved
Melbourne Water’s understanding of the system
and the variables that impact the greatest on the
system’s overall capacity and service requirements.
The benefit this has had over the traditional
approach is that it has allowed the relevant
stakeholder groups to take ownership of the
variables that are under their control while also
working together to achieve the overall service
outcome. As a result the impact of improving the
availability of existing blowers or reducing the
demand can be quickly calculated and translated
Figure 9: ETP Aeration Blowers System Resilience into real savings for the business through further
Curves deferment of capital expenditure.
The two System Resilience levels considered were
99.5% and 98%. The lower target has the impact of
delaying the installation of additional blowers as
shown in the augmentation profile in Table 1 below.
98% SR 99.5% SR
Blower 10 2018 2013
Blower 11 2034 2022
Table 1: Augmentation Profile
Based on the potential for process elasticity
observed historically, recent commissioning of an
additional 4 aeration tanks, opportunity for demand
reductions through efficiency projects and the
relatively short lead time to install a new blower of 1
year the lower 98% System Resilience target was
selected. To ensure process performance remains
acceptable and capital is spent efficiently the
availability and load assumptions in the model will
be reviewed yearly and the System Resilience
forecast curves updated. The appropriateness ofYou can also read