Trivial and nontrivial error sources account for misidentification of protein partners in mutual information approaches - Nature
←
→
Page content transcription
If your browser does not render page correctly, please read the page content below

www.nature.com/scientificreports
OPEN Trivial and nontrivial error sources
account for misidentification
of protein partners in mutual
information approaches
Camila Pontes1,2, Miguel Andrade1,2, José Fiorote1 & Werner Treptow1*
The problem of finding the correct set of partners for a given pair of interacting protein families based
on multi-sequence alignments (MSAs) has received great attention over the years. Recently, the
native contacts of two interacting proteins were shown to store the strongest mutual information
(MI) signal to discriminate MSA concatenations with the largest fraction of correct pairings. Although
that signal might be of practical relevance in the search for an effective heuristic to solve the problem,
the number of MSA concatenations with near-native MI is large, imposing severe limitations. Here,
a Genetic Algorithm that explores possible MSA concatenations according to a MI maximization
criteria is shown to find degenerate solutions with two error sources, arising from mismatches among
(i) similar and (ii) non-similar sequences. If mistakes made among similar sequences are disregarded,
type-(i) solutions are found to resolve correct pairings at best true positive (TP) rates of 70%—far
above the very same estimates in type-(ii) solutions. A machine learning classification algorithm helps
to show further that differences between optimized solutions based on TP rates are not artificial and
may have biological meaning associated with the three-dimensional distribution of the MI signal.
Type-(i) solutions may therefore correspond to reliable results for predictive purposes, found here to
be more likely obtained via MI maximization across protein systems having a minimum critical number
of amino acid contacts on their interaction surfaces (N > 200).
Coevolution of proteins A and B translates itself into a series of homologous primary-sequence variants encod-
ing coordinated compensatory mutations and, therefore, a specific set of protein–protein interactions between
members of family A and members of family B. The problem of resolving specific protein partners based on
multi-sequence alignments (MSAs) has received great attention over the y ears1,2. Ingenious approaches based on
the correlation of phylogenetic t rees3–5 and p
rofiles6, gene c olocalization7 and f usions8, maximum coevolutionary
9
interdependencies and correlated m utations10,11, maximization of the interfamily coevolutionary signal12, itera-
tive paralog matching based on sequence e nergies13 and expectation–maximization14 have been developed and
applied to resolve interaction partners in single or multiple (paralogous) gene copies in the same genome. Despite
these advances, the problem of protein partners prediction remains unsolved for large sequence ensembles in
general, especially for the case of protein coevolution across independent genomes—examples are phage proteins
and bacterial receptors, pathogen and host-cell proteins, neurotoxins and ion channels, to mention a few. The
problem lacks any suitable solution especially because an effective heuristic to search for the correct set of protein
partners across the space of M! potential matches still misses in case of large number of sequences M (Fig. 1).
In a previous investigation, we showed that the coevolutive information encoded on the interacting amino
acids of proteins A and B can be useful to discriminate the correct set of protein partners based on MSAs,
in contrast to other evolutive and stochastic sources spread over their s equences15. When compared to other
sources, the coevolutive information is the strongest signal to distinguish protein partners derived from coevo-
lution within the same genome and, likely, the unique indication available in the case of protein interactions
in independent genomes. We showed that physically-coupled amino acids at the molecular interface of A and
B store the largest per-contact mutual information ( ÎAB ) to discriminate MSA concatenations with the largest
expectation fraction of correct interaction partners—a result that was found to hold for various definitions of
intermolecular contacts and binding modes. Although that information content might be of practical relevance
in the search of an effective heuristic to resolve specific protein partners, the degeneracy ω , i.e., the number of
1
Laboratório de Biologia Teórica e Computacional (LBTC), Universidade de Brasília DF, Brasília, Brazil. 2These authors
contributed equally: Camila Pontes and Miguel Andrade. *email: treptow@unb.br
Scientific Reports | (2021) 11:6902 | https://doi.org/10.1038/s41598-021-86455-0 1
Vol.:(0123456789)
www.nature.com/scientificreports/
Figure 1. Different scenarios for protein partners determination from multi-sequence alignments. The correct
set of partners is known for systems with a single gene copy per genome and unknown for systems involving
multiple (paralogous) sequences within the same genome or multiple sequences across independent genomes.
This figure was created with Inkscape (https://inkscape.org/).
MSA concatenations with a similar amount of IAB to the native concatenation is expected to be large (ω ≫ M ),
imposing severe limitations to that purpose.
Here, we investigate that hypothesis accordingly for a variety of protein families, including obligate and non-
obligate complexes. It is worth emphasizing that the aim of this work is not to provide a method for the prediction
of protein–protein interactions nor protein–protein interfaces, hence it differs from the studies in which sequence
covariance is used to predict three-dimensional amino acid contacts or to infer specific interactions for a set of
paralogs. Instead, we want to qualitatively explore the MI degeneracy in the space of possible protein partners
associations between two interacting protein families. To approach that, we analyze a set of converged trajectories
produced by a Genetic Algorithm (GA) that maximizes IAB starting from scrambled MSA concatenations of
protein families with known partners in the same genome. Consistent with the expected degeneracy of IAB, GA
optimizations show two subspaces of MSA concatenation solutions: subspace (i), which consists of optimized
solutions with a trivial error source arising from mismatches among similar sequences; and subspace (ii), which
consists of optimized solutions with a non-trivial error source due to mismatches among non-similar sequences.
By disregarding mistakes made among similar sequences, protein partners are resolved at best true-positive (TP)
rates of ~ 70% in type-(i) optimizations – far above best TP rates in type-(ii). Type-(i) and -(ii) solutions are found
to be functionally distinct from each other, with the former presenting a larger near-native content of mutual
information correctly distributed among amino acid contacts. Particularly important, that finding supports the
notion that differences between optimized solutions based on TP rates have a biological meaning associated with
the amount of functional information and its spatial distribution. Type-(i) solutions may therefore correspond
to reliable results for predictive purposes1, more likely obtained via IAB maximization across protein systems
found here to have a minimum critical number of amino acid contacts on their interaction surfaces (N > 200).
Results and discussion
In search of an effective heuristic to resolve specific protein partners based on MSAs with large numbers of
sequences, the degeneracy of the per-contact mutual information ÎAB was investigated here across 26 inde-
pendent protein families with known interaction partners in the same genome (see “Methods” and Table S1).
To approach that, we have performed optimization trajectories produced by a Genetic Algorithm (GA, see
“Methods” and Algorithm S1) that starts from a random concatenation of MSA A and MSA B, and maximizes
ÎAB by performing small changes in the MSA concatenation iteratively (Fig. 2A). Accordingly, Fig. 2B shows
156 optimization trajectories with convergence obtained after 45,000 generations as indicated by their average
time derivative δ ÎAB ≤ 0.001 in Fig. 2C. The average trajectory converges at ~ 98% of the ÎAB reference value in
the native concatenation z*.
Despite presenting near-native values of ÎAB , optimized solutions fail at pairing sequences correctly in con-
sequence of the degeneracy of the space of possible MSA models constrained by the ÎAB maximization criteria.
As made clear in Fig. 3A, there are three groups of solutions: one group of scrambled concatenations with 0% TP
rate and low values of ÎAB (in gray), one group of optimized concatenations with 0% TP rate and near-native ÎAB
(in red), and one group of native concatenations with 100% TP rate and native ÎAB (in green). Careful inspection
of the data reveals that the presence of similar sequences in MSA B contributes to that high error rate by yielding
similar optimized values of ÎAB when paired with a given sequence in MSA A. Indeed, reassessment of TP rates
by disregarding mistakes made among sequences at the 20th percentile of Hamming distances distribution (see
“Methods”—Fig. 9) allows regrouping of solutions into a subspace (i) with TP rates larger than 30% (Fig. 3B).
Scientific Reports | (2021) 11:6902 | https://doi.org/10.1038/s41598-021-86455-0 2
Vol:.(1234567890)
www.nature.com/scientificreports/
Figure 2. Interface mutual information (ÎAB) optimization trajectories. (A) Scheme showing ÎAB optimization
process starting from a scrambled multi-sequence alignment (MSA) concatenation (in gray) and reaching an
optimized concatenation (in blue). Only physically coupled MSA position pairs (shown in purple) are taken
into account. (B) Optimization trajectories for 26 protein systems. For each system, there are six trajectories
with different starting points. The ÎAB normalized by the native interface mutual information (relative ÎAB) is
plotted against the number of generations of the genetic algorithm (gray lines). The average trajectory over
all complexes is shown in black. (C) First-order derivative of the optimization trajectories shown in (B). The
derivatives of individual trajectories are shown in gray, while the average derivative over all trajectories is shown
in black. This figure was generated with Inkscape (https://inkscape.org/) and matplotlib v3.1.2 (https://matpl
otlib.org/).
As a measure of correlation, it is not surprising that mutual information is degenerate given that trivial source of
error. Unexpected however is the fact that degeneracy may also involve another subspace of optimized solutions
(ii) related to the non-trivial mismatch of sequences at larger Hamming distances. Supporting that notion, pro-
tein partners prediction at better TP rates (> 30%) demands a larger fraction of sequence mismatches (above the
20th percentile) to be discounted in optimized solutions (ii). As shown in Supporting Information, conclusions
about subspaces (i) and (ii) hold for mismatches definitions using other Hamming distance cutoffs (Figure S1).
To get further insights on the mismatch problem reported in Fig. 3, the functional distinction of solutions
type-(i) and (ii) was then analyzed according to the three-dimensional distribution of evolutive and coevolutive
sources of the mutual information signal. Implicit in the analysis is the assumption that type-(i) solutions must
necessarily have a near-native content of mutual information correctly distributed among amino acid contacts
i.e., a near-native information content with a high correlation r(Î(Xi ; Yi ), Înat
T (X ; Y )) between the optimized
i i
solution vector Î(Xi ; Yi ) and its native conjugate Înat
T (X ; Y ). Consistent with that assumption, Fig. 4 shows that
i i
the k-nearest neighbor (KNN) machine learning a lgorithm16 discriminates type-(i) and -(ii) solutions with high
accuracy ~ 82%, according to their nativelikeness across the space ÎAB × r . A further decomposition analysis
reveals the information recovered from type-(i) solutions has larger contents of the evolutive (phylogenetic) and
coevolutive signals encoded on the native interacting amino acids of proteins A and B15—as also indicated by
the high accuracy ~ 82% in which such solutions are effectively classified by the KNN algorithm applied on the
correlation space redefined in terms of the specific signals. Here, what is meant by coevolutive signal, as explained
in15, is the surplus of MI stored in residue pairs at the interface (on average) when compared to the MI stored in
residue pairs in general (on average), which is the evolutive, or phylogenetic, signal. For all cases, differentiation
Scientific Reports | (2021) 11:6902 | https://doi.org/10.1038/s41598-021-86455-0 3
Vol.:(0123456789)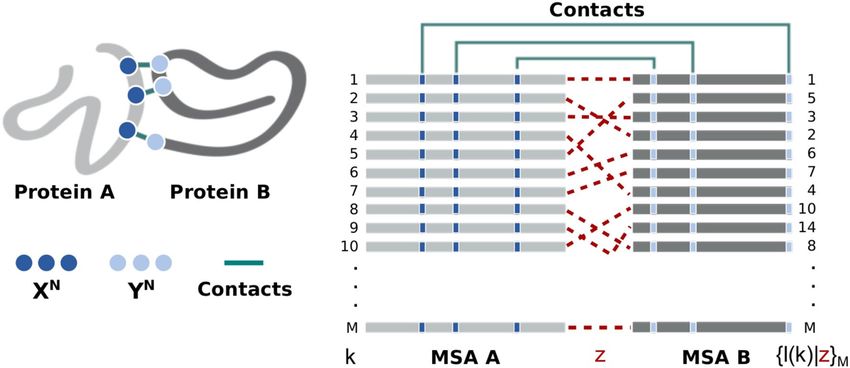
www.nature.com/scientificreports/
Figure 3. Evaluation of optimized MSA concatenations. (A) True positive (TP) rate of random, optimized and
native MSA concatenations. (B) Reassessed TP rate of random, optimized and native MSA concatenations by
discounting wrong pairings among sequences with Hamming distance within the 20th percentile of the distance
distribution. Optimized solutions with TP rate greater than 30% (p = 0.0005) are shown in blue, while optimized
solutions with TP rate lower than 30% are shown in red. Random solutions are shown in gray. (C–G) Hamming
distance distribution of MSA B, TP rates versus Hamming distance discounts (the 20th percentile is shown with
a dashed line), and TP rates of random (rnd) and optimized (opt1–6) solutions for the 20th percentile Hamming
distance cutoff shown for representative systems: 3RRL_AB (C), 1EFP_AB (D), 2NU9_AB (E), 3MML_AB (F),
and 1TYG_BA (G). This figure was generated using matplotlib v3.1.2 (https://matplotlib.org/ ).
Figure 4. (A) Optimized concatenation solutions scattered across the space of relative interface
mutual information (MI), ÎAB, against Pearson correlation between optimized and native MI vectors,
T (X ; Y )). Type-(i) solutions are shown in red and type-(ii) solutions are shown in blue. The
r(Î(Xi ; Yi ), Înat i i
bidimensional space was separated by a k-nearest neighbors (KNN) classification a lgorithm16 (default Python
3 scikit-learn implementation, k = 10, for other k values see Figure S2). Native and scrambled concatenations
were plotted afterwards in the same space and are shown in green and gray, respectively. Analogous plots were
generated for the evolutive (B) and coevolutive (C) components of ÎAB. The decomposition was performed
according to15. This figure was generated using sci-kit learn v0.22.2 (https://scikit-learn.org) and mlxtend v0.18.0
(http://rasbt.github.io/mlxtend/).
Scientific Reports | (2021) 11:6902 | https://doi.org/10.1038/s41598-021-86455-0 4
Vol:.(1234567890)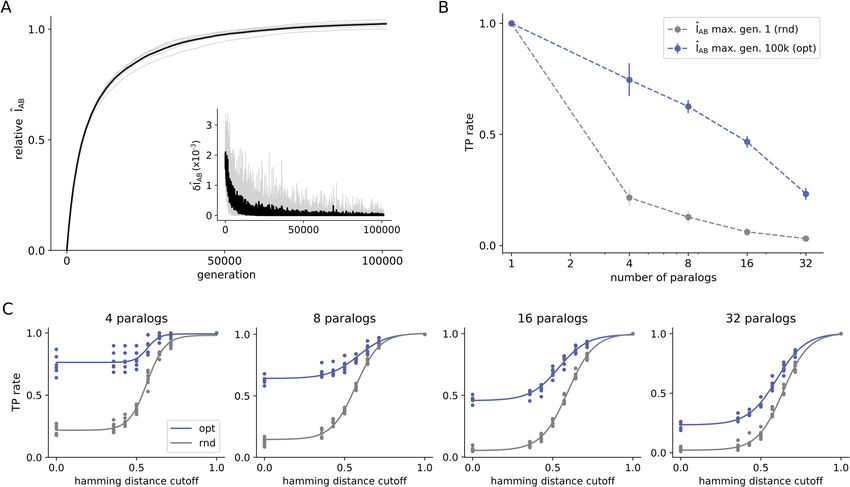
www.nature.com/scientificreports/
Figure 5. (A) Correlation between the true positive (TP) rate of optimized solutions and mutual information
(MI) on the interface IAB. (B) Correlation between TP rate of optimized solutions and IAB regularized by the
joint entropy on the interface, IAB /HAB. (C) Correlation between native IAB /HAB and the number of contacts
on the interface (N). (D) Correlation between TP rate and number of sequences in the alignment (M). Values
on the x-axis in A-B were calculated considering the native pairing. TP rates are shown as averages (n = 6) for
each system. Systems were colored based on groups G1–5: group 1 is composed by systems with only type-(i)
solutions (Fig. 3C and Fig. S3), group 2 by systems with a majority of type-(i) solutions (Fig. 3D and Fig. S4),
group 3 by systems with the same proportions of type-(i) and type-(ii) solutions (Fig. 3E and Fig. S5), group 4 by
systems with a majority of type-(ii) solutions (Fig. 3F and Fig. S6), and group 5 by systems in which optimized
concatenations did not differentiate from the scrambled ones (Fig. 3G and Fig. S7). This figure was generated
using matplotlib v3.1.2 (https://matplotlib.org/).
is far above the non-significant value of 50% thus supporting the conclusion that differences between optimized
solutions based on TP rates may have a biological meaning associated with the amount of functional information
recovered and its spatial distribution.
Given the importance that native-like solutions may have in predictive purposes, the propensity of protein
systems to produce such optimized solutions was further analyzed according to the content of non-trivial errors.
As shown in Fig. 5A,B, protein systems were found to cluster into five distinct groups with average TP rates that
strongly correlate with the amount of mutual information at the interaction surface of proteins, with or without
regularization by the local joint entropy HAB (see “Methods”). According to that analysis, lower contents of
mutual information appear to account for the higher propensity of the system in producing type-(ii) solutions.
Because the mutual information content is proportional to the number of amino acid contacts at the protein
surface, N (Fig. 5C), this result appears to be consistent with the statistical expectation that the distribution of
MI values is broader over systems with fewer degrees of freedom (contacts). More importantly, it indicates N
as an important parameter to discriminate suitable protein systems for which maximization of ÎAB may likely
produce near-native type-(i) solutions with biological meaning as reported in Fig. 4. The relevance of that
parameter becomes clear by noting that the number of MSA sequences (M) does not explain well the content of
non-trivial errors across protein clusters (Fig. 5D), despite the well-documented fact that M may significantly
impact the accuracy of coevolutionary a pproaches17. The condition N > 200 thus emerges here as one plausible
threshold criteria for the classification of protein systems that are suitable for maximization of ÎAB and resolution
of protein partners via type-(i) solutions.
So far, our results were obtained from a set of protein families involving unique sequence pairs per genome
that may not have coevolved under strong selective pressures towards specificity. To better understand any
implicit dependence of the results with that experimental condition, error sources (i) and (ii) were then further
Scientific Reports | (2021) 11:6902 | https://doi.org/10.1038/s41598-021-86455-0 5
Vol.:(0123456789)
www.nature.com/scientificreports/
Figure 6. Evaluation of optimized MSA concatenations of the HK-RR paralogs dataset. (A) Optimization
trajectories for the HK-RR standard dataset. The interface mutual information normalized by the native
interface mutual information (relative ÎAB) is plotted against the number of generations for optimizations
(with 6 replicates each) starting from a solution with a scrambled concatenation within each species. The first
derivative of the trajectory is shown in the smaller plot. (B) True positive (TP) rate of start (in gray) and final
(in blue) solutions after ~ 100,000 rounds of ÎAB maximization. The TP rate is shown in average for bacterial
species containing different numbers of paralogs. (C) TP rate after disregarding mismatches among sequences
considering different Hamming distance cutoffs for bacterial genomes with different numbers of paralogs in the
standard HK-RR dataset. The TP rate is shown for both random (rnd) and optimized (opt) MSA concatenations.
This figure was generated using matplotlib v3.1.2 (https://matplotlib.org/).
investigated in the context of the bacterial two-component system HK-RR featuring highly specific protein–pro-
tein interactions across multiple protein copies per genome. More specifically, histidine kinase (HK) and their
respective response regulator (RR) are paralogous gene families13,18,19, each consisting of multiple sequences
sharing significant homology at the primary and tertiary levels. Despite that signature, HK-RR pairs are highly
specific within the same genome in consequence of evolutive pressures avoiding crosstalk between independent
two-component pathways20—as shown by Rowland and Deeds, the evolution of new HK-RR pairs follows rapid
sequence divergence immediately after duplication e vents21.
Accordingly, Fig. 6 presents another series of ÎAB optimizations performed on the HK-RR dataset contain-
ing around 5000 sequences, coming from ~ 450 bacterial genomes from the P2CS d atabase22–24. Optimizations
were performed with 6 replicates each, starting from a paired alignment with a randomized pairing within each
species. All species were optimized together, which means that each optimization step benefits from the cumu-
lative changes that happened in previous steps (see “Methods”—Fig. 8). As shown in Fig. 6A, optimization to
near-native values of ÎAB is attained after ~ 100,000 generations, with δ ÎAB < 0.001.
When analyzing the TP rate for species with different numbers of paralogs, optimized MSA solutions pre-
sent an improvement over the initial concatenations (Fig. 6B). In this case, TP rates are not null because the
degeneracy of (M ≤32) paired sequences of paralogs is expected to be significantly smaller than that of (M > 200)
paired sequences in Fig. 3. It is interesting to notice that TP rates obtained here by optimizing only the interface
MI are only slightly inferior to the same estimates obtained considering full protein MI found in the l iterature18,
especially for genomes with a higher number of paralogs. Figure 6C shows further the TP rate of optimized
and random MSA concatenations, considering a 20th percentile Hamming distance discount cutoff, for bacte-
rial genomes with different numbers of paralogs. It is possible to observe that random and optimized curves
approximate with increasing numbers of paralogs. Extrapolating for cases with more than 32 paralogs, the two
curves tend to overlap similarly to what occurs in protein systems in which optimized concatenations did not
differentiate from the scrambled ones (Fig. 3G and Fig. S7) and therefore, suggesting that type (i) errors do not
contribute to ÎAB degeneracy in HK-RR system. We hypothesize that the lack of type-(i) error originated from
mismatches among similar sequences is due to the high specificity of this system.
Results in Fig. 6 appear to rationalize the sharp deterioration of TP rates with the number of sequences in
recent investigations of paralogous systems12–14,18,19, by hypothesizing it is due to the lack of type-(i) mismatches
and the great degeneracy involved. In previous works, Bitbol and coworkers developed an iterative pairing
Scientific Reports | (2021) 11:6902 | https://doi.org/10.1038/s41598-021-86455-0 6
Vol:.(1234567890)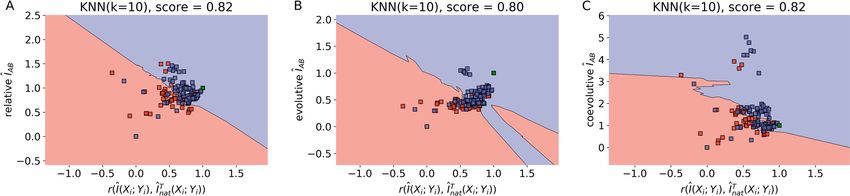
www.nature.com/scientificreports/
algorithm (IPA) capable of inferring protein partners using either direct coupling analysis (DCA-IPA)13, mutual
information (MI-IPA)18, or phylogeny (Mirrortree-IPA)19. When benchmarked for paralog matching on the
standard HK-RR dataset, DCA-IPA was as accurate as MI-IPA, and Mirrortree-IPA was even more accurate.
The performance of these algorithms, however, drops considerably for species with more than 32 paralogs. The
tendency is that the TP rate also drops to zero in a hypothetical genome with hundreds of paralogs19, a situa-
tion analogous to the results in Fig. 6. In conclusion, results presented in Fig. 6 suggest that paralog matching is
only possible because there is usually a small number of paralogous sequences per genome. When extended to
genomes with more paralogs, this problem tends to present only type-(ii) solutions, leaving virtually no room
for improvement of TP rates.
Conclusions and future work
Here, we investigate the hypothesis that the coevolutive information encoded on the interacting amino acids of
proteins A and B ( ÎAB) can be useful to discriminate protein partners based on large multi-sequence alignments
(MSAs). When compared to evolutive and stochastic sources, ÎAB was previously found as the strongest signal to
distinguish protein partners derived from coevolution within the same genome and likely the unique indication
in the case of independent g enomes15. In contrast to other coevolutionary signals that may also be considered
in purpose9,10,12–14, ÎAB thus corresponds to a small and still important fraction of the total information available
in protein sequences making it especially suitable for specific partners inference via fast algorithmic routines.
Despite these aspects, the degeneracy of ÎAB is expected to be large and may impose severe limitations to practi-
cal applications.
Indeed, ÎAB optimization across the space of possible MSA concatenations is shown here to resolve specific
protein partners at very low true positive (TP) rates in consequence of error sources (i) and (ii). As a measure
of correlation, it is not surprising that ÎAB is degenerate given trivial mismatches (i) among similar sequences.
Unexpected however is the fact that degeneracy may also involve another subspace of optimized solutions (ii)
with the non-trivial mismatch of sequences at larger Hamming distances. If trivial error sources are disregarded,
further analysis indicates, however, that protein partners may be resolved in the context of type-(i) solutions at
best TP rates of ~ 70%—far above the same estimates in type-(ii) solutions.
Type-(i) and -(ii) solutions are found to be functionally distinct from each other, with the former presenting
a larger near-native content of mutual information correctly distributed among amino acid contacts. Particularly
important, that finding supports the notion that their differentiation based on TP rates is not just a theoretical
construct but instead has a biological meaning associated with how much functional information is recovered
and how accurately distributed this information is. Type-(i) solutions may therefore correspond to reliable results
for predictive purposes1, more likely obtained via ÎAB maximization across protein systems with a minimum
critical number of amino acid contacts on their interaction surfaces (N > 200).
Finally, as a special case of a highly specific system of paralogs, HK-RR interactions are resolved here at very
low TP rates following ÎAB maximization, which is consistent with TP rates reported in the l iterature19 employing
other more complex optimization algorithms, such as DCA-IPA13. As shown in Fig. 6, the HK-RR system was
found not to present type-(i) degeneracy and, as such, its TP rates sharply deteriorate with M ≥32 sequences per
genome and cannot be improved by any means. Exclusive existence of type-(ii) errors in the HK-RR system thus
suggests another layer of complexity that sequence diversity and specificity may add to the problem. Investigation
of these aspects as key determinants for error sources (i) and (ii) is therefore another important perspective of
the presented work. In this direction, we speculate that HK-RR pairs within the same genome are highly specific
and this is the reason why there is no type (i) error in this system. In contrast, systems with only one pair of
interacting proteins per genome do not suffer selective pressure to avoid cross-binding homologs occurring in
other species and, therefore, present both type (i) and type (ii) errors.
Overall, the investigations performed in this work provide some clarifications into the general problem of
protein coevolution from the perspective of sequence diversity. It is difficult to say to which point homologous
sequences were selected to selectively bind to their native partners since there is a huge degeneracy in the space
of possible sets of partners. Despite the intrinsic complexity of the problem of specific protein partners prediction
for large sequence ensembles, the novel theoretical insights presented here might provide relevant information
for future studies and should contribute to advancing our knowledge in the field.
Methods
Consider two interacting protein families, A and B. It is possible to construct two MSAs, MSA A and MSA B,
containing M sequences from families A and B, respectively. A specific coevolution process z ∈ {1, . . . , M!}
associates each sequence l in MSA B to a sequence k in MSA A in a unique arrangement of size M (see Fig. 7).
Given that members of A and B interact via formation of N independent amino acid contacts at molecular level,
it is possible to extract from these MSAs only the columns corresponding to sites that are in contact, belonging
to the complex interface. In this context, the interacting amino acids of families A and B are described by two N
-length blocks of discrete stochastic variables, X N = (X1 , . . . , XN ) and Y N = (Y1 , . . . , YN ), with associated prob-
ability mass functions (PMFs) {ρ(x1 . . . xN ), ρ(y1 . . . yN ), ρ(x1 . . . xN , y1 . . . yN |z)|xi , yi ∈ �, ∀i ∈ {1, . . . , N}}.
Here, the alphabet has size 21 and contains all 20 amino acids and the gap symbol ’–’. Note that only the joint
PMF will depend on process z.
Here, we approximate each site-specific PMF {ρ(xi ), ρ(yi ), ρ(xi , yi |z)|i ∈ {1, . . . , N}} by the empirical amino
acid frequencies {f (xi ), f (yi ), f (xi , yi |z)|i ∈ {1, . . . , N}} obtained from the concatenated MSAs. Note that each
coevolution process z determines a specific concatenation, as illustrated in Fig. 7. It means that, essentially, the
search will be guided by the amount of information XN stored about YN conditional to different coevolution
processes z.
Scientific Reports | (2021) 11:6902 | https://doi.org/10.1038/s41598-021-86455-0 7
Vol.:(0123456789)
www.nature.com/scientificreports/
Figure 7. Structural contacts mapped into M-long multi-sequence alignment of protein interologs A and B. A
set of pairwise protein–protein interactions is defined by associating each sequence l in MSA B to a sequence k
in MSA A in one unique arrangement, {l(k)|z}, determined by the coevolution process z to which these protein
families were subjected. This figure was created with Inkscape (https://inkscape.org/).
Shannon mutual information. The Shannon mutual information contained on the interface of interact-
ing proteins A and B conditional to a given coevolution process z is calculated as follows
N
1 1
ÎAB = I(X N ; Y N |z) = I(Xi ; Yi |z)
N N
i=1
(1)
1 f (xi , yi |z)
= f (xi , yi |z) ln , xi , yi ∈ �
N f (xi )f (yi )
�x�
where N is the number of contacts at the AB complex interface, f (xi ) is the empirical frequency of xi as a realiza-
tion of Xi , f (yi ) is the empirical frequency of yi as a realization of Yi , and f (xi , yi |z) is the empirical frequency
of pair (xi , yi ) as a realization for the i-th contact given a specific coevolution process z.
The empirical values of single and joint frequencies were corrected considering a pseudocount, as follows
fi (xi ) ← (1 − )fi (xi ) +
Q
fij (xi , xj |z) ← (1 − )fij (xi , xj |z) +
Q2
where, Q is the size of alphabet and is the pseudocount parameter. In this work, we adopt a small pseudo-
count of = 0.001.
The joint entropy of the interface was calculated for individual contacts
H(Xi , Yi |z) = f (xi , yi |z) ln(f (xi , yi |z))
where f (xi , yi |z) is the empirical frequency of pair (xi , yi ) as a realization for the i-th contact given a specific
coevolution process z. Afterwards, the regularization IAB /HAB was obtained according to
N
IAB /HAB = I(Xi ; Yi |z)/H(Xi , Yi |z)
i=1
where N is the number of contacts.
Systems under investigation. Protein complexes under investigation are shown in Table S1. MSAs A
and B for all protein families were obtained from Ovchinnikov and coworkers25. Amino acid contacts defining
the discrete stochastic variables XN and YN were identified from the x-ray crystal structure of the bound state
of a representative protein pair from families A and B using a typical contact definition considering maximum
separation distance of 8 Å between amino acids carbon beta. The full dataset of protein systems validated in25
was considered here, except for systems 2Y69_BC, 2ONK_AC, 3A0R_AB, 3RPF_AC, and 4HR7_AB, which
were considered outliers in terms of M/N values 469.3, 87.7, 192.3, 150.6, and 45.3 significantly larger than their
typical estimates described in Table S1.
Scientific Reports | (2021) 11:6902 | https://doi.org/10.1038/s41598-021-86455-0 8
Vol:.(1234567890)www.nature.com/scientificreports/
Figure 8. Scheme showing interface mutual information (ÎAB) optimization process for the HK-RR standard
dataset. It starts from a within-species scrambled MSA concatenation and reaches an optimized concatenation.
Different species are shown in different colors. Only physically coupled MSA position pairs (shown in purple)
are taken into account and only within-species changes are made in each generation. This figure was created
with Inkscape (https://inkscape.org/).
Additionally, the HK-RR standard dataset containing around 5000 sequences, coming from around 450 bacte-
rial genomes from the P2CS database22–24 was included. This paired MSA was produced and validated by Bitbol
and coworkers13 in paralog matching experiments. The PDB complex 5UHT (chains A and B) was selected as a
representative for this system. The reason for including this system containing paralogous proteins is to have a
baseline for comparison with previous related studies.
Genetic algorithm. The mutual information contained on the interface of the protein complexes, calcu-
lated as described in Eq. (1), was maximized using a Genetic Algorithm (GA, Algorithm S1). For each of the
protein complexes considered, six independent optimization trajectories were obtained, starting from different
randomly generated populations. Each optimization was performed with a population of eight individuals with
unique genomes encoding a specific concatenation z of MSAs A and B. In each generation, the elite (top-50%
individuals with the best fitness) reproduces and replaces the remaining 50% individuals with lower fitness with
new individuals with genomes that are mutated copies of the elite. A mutation in the genome of an individual
consists of swapping positions of two sequences on MSA B, and thereby slightly changing the concatenation
z. The fitness of the individuals is calculated in each generation and corresponds to the total interface mutual
information obtained considering an individual unique genome, i.e., a specific concatenation of MSAs A and B.
The optimization was stopped after a predefined number of 50,000 generations was reached.
A slightly different optimization procedure was implemented for the special case of the HK-RR standard
dataset (Fig. 8). In this case, the initial population is composed of within-species scrambled solutions and, in
each generation, only within-species changes are allowed. More specifically, each time a new mutated individual
is generated, one of the species that compose the MSA is randomly selected, and a change in the concatenation
within this species is performed. The optimization was stopped after a predefined number of 100,000 genera-
tions was reached.
The optimal set of parameters for the GA were derived from a series of tests performed on six representa-
tive systems. In each test, one of these parameters varied, assuming a range of values while all other parameters
remained fixed (Table S2). All tests were performed with a predefined seed for the random number generator,
which means that the starting point and the sequence of mutations performed are constant for all trajectories of
the same system. This was done to ensure that any effects observed in the final results were due solely to varia-
tions in the GA parameters.
Figure S8 shows how parameter values correlated with relative ÎAB at the end of test trajectories. Given that
both the number of individuals and the elite proportion correlated positively with relative ÎAB (Figure S8A,B),
the values selected for these parameters were the maximum tested, i.e., 8 and 0.5, respectively. The number of
mutations, on the other hand, correlated negatively with relative ÎAB (Figure S8C), thus the value selected for this
parameter was 1. Results for parameter were not so conclusive (Figure S8D) and, since this parameter was set
to 0.001 in previous w ork15, its value was maintained the same. As shown in Figure S9, GA parameters do not
influence TP rates observed at the end of trajectories thus supporting that our conclusions are robust over GA
parameters, with the possible exception of , which will be investigated in future work.
Scientific Reports | (2021) 11:6902 | https://doi.org/10.1038/s41598-021-86455-0 9
Vol.:(0123456789)www.nature.com/scientificreports/
Figure 9. Mismatch discounting based on a Hamming distance cutoff. Scheme showing how the accuracy of
the same MSA concatenation would be assessed with (B) and without (A) mismatch discounting. This figure
was created with Inkscape (https://inkscape.org/).
Assessment of optimized solutions accuracy. The true positive (TP) rates of optimized concatena-
tions obtained at the end of the genetic algorithm (GA) ÎAB maximization trajectories were calculated in two
different manners: with and without mismatch discounting. TP rate assessment without mismatch discounting
consists simply of counting how many sequence partners were correctly paired in the target solution and divided
by the total number of sequences (Fig. 9A). TP rate assessment with mismatch discounting, on the other hand,
consists of counting how many sequences were paired either with their correct partner or with a partner that is
close enough to the correct one in terms of Hamming distance (Fig. 9B). Hence, mismatch discounting depends
on a predefined Hamming distance cutoff, below which sequences are considered similar enough for the mis-
takes to be forgiven. Here, we consider the 20th percentile of a given protein family B distance distribution as
the predefined cutoff for mismatch discounting. Figure S1 shows that the relaxation of that parameter does not
affect qualitatively the results.
A K-Nearest Neighbors (KNN) classifier was used to investigate if MSA pairing solutions with trivial and
non-trivial error sources scattered differently in the space of relative ÎAB against correlation of individual MI
values with the native solution, r(Î(Xi ; Yi ), Înat
T (X ; Y )). All type-(i) and type-(ii) solutions obtained were used
i i
to train a KNN classifier with default scikit-learn (https://scikit-learn.org) parameters, except for the number
of neighbors (K). Values of K were tested ranging from 2 to 20, but little variation in the accuracy score was
observed, with scores ranging from 0.76 to 0.87. Therefore a value of K = 10 was chosen as a compromise between
a possible overfit when considering too few neighbors and losing accuracy when considering too many neighbors
(results for other values of K are shown in Figure S2). The accuracy score was calculated using the scikit-learn
function .score() on the model inferred by the KNN classifier. This function indicates how well the model fits
the provided data points, i.e., it calculates the accuracy on the training set.
Received: 14 October 2020; Accepted: 15 March 2021
References
1. Morcos, F. & Onuchic, J. N. The role of coevolutionary signatures in protein interaction dynamics, complex inference, molecular
recognition, and mutational landscapes. Curr. Opin. Struct. Biol. 56, 179–186 (2019).
2. de Juan, D., Pazos, F. & Valencia, A. Emerging methods in protein co-evolution. Nat. Rev. Genet. 14, 249–261 (2013).
3. Goh, C. S., Bogan, A. A., Joachimiak, M., Walther, D. & Cohen, F. E. Co-evolution of proteins with their interaction partners. J.
Mol. Biol. 299, 283–293 (2000).
4. Pazos, F. & Valencia, A. Similarity of phylogenetic trees as indicator of protein–protein interaction. Protein Eng. Design Select. 14,
609–614. https://doi.org/10.1093/protein/14.9.609 (2001).
5. Gertz, J. et al. Inferring protein interactions from phylogenetic distance matrices. Bioinformatics 19, 2039–2045 (2003).
6. Pellegrini, M., Marcotte, E. M., Thompson, M. J., Eisenberg, D. & Yeates, T. O. Assigning protein functions by comparative genome
analysis: protein phylogenetic profiles. Proc. Natl. Acad. Sci. U.S.A. 96, 4285–4288 (1999).
7. Dandekar, T., Snel, B., Huynen, M. & Bork, P. Conservation of gene order: A fingerprint of proteins that physically interact. Trends
Biochem. Sci. 23, 324–328 (1998).
8. Marcotte, C. J. V. & Marcotte, E. M. Predicting functional linkages from gene fusions with confidence. Appl. Bioinform. 1, 93–100
(2002).
9. Tillier, E. R. M., Biro, L., Li, G. & Tillo, D. Codep: maximizing co-evolutionary interdependencies to discover interacting proteins.
Proteins 63, 822–831 (2006).
10. Pazos, F. & Valencia, A. In silico two-hybrid system for the selection of physically interacting protein pairs. Proteins Struct. Funct.
Genet. 47, 219–227. https://doi.org/10.1002/prot.10074 (2002).
11. Burger, L. & van Nimwegen, E. Accurate prediction of protein–protein interactions from sequence alignments using a Bayesian
method. Mol. Syst. Biol. https://doi.org/10.1038/msb4100203 (2008).
12. Gueudré, T., Baldassi, C., Zamparo, M., Weigt, M. & Pagnani, A. Simultaneous identification of specifically interacting paralogs
and interprotein contacts by direct coupling analysis. Proc. Natl. Acad. Sci. U.S.A. 113, 12186–12191 (2016).
13. Bitbol, A.-F., Dwyer, R. S., Colwell, L. J. & Wingreen, N. S. Inferring interaction partners from protein sequences. Proc. Natl. Acad.
Sci. https://doi.org/10.1101/050732 (2016).
Scientific Reports | (2021) 11:6902 | https://doi.org/10.1038/s41598-021-86455-0 10
Vol:.(1234567890)www.nature.com/scientificreports/
14. Marrero, M. C., Immink, R. G. H., de Ridder, D. & van Dijk, A. D. J. Improved inference of intermolecular contacts through pro-
tein–protein interaction prediction using coevolutionary analysis. Bioinformatics 35, 2036–2042. https://doi.org/10.1093/bioin
formatics/bty924 (2019).
15. Andrade, M., Pontes, C. & Treptow, W. Coevolutive, evolutive and stochastic information in protein-protein interactions. Comput.
Struct. Biotechnol. J. 17, 1429–1435. https://doi.org/10.1016/j.csbj.2019.10.005 (2019).
16. Dasarathy BV. Nearest Neighbor (NN) Norms: Nn Pattern Classification Techniques (1991).
17. Mao, W., Kaya, C., Dutta, A., Horovitz, A. & Bahar, I. Comparative study of the effectiveness and limitations of current methods
for detecting sequence coevolution. Bioinformatics 31, 1929–1937 (2015).
18. Bitbol, A.-F. Inferring interaction partners from protein sequences using mutual information. PLoS Comput. Biol. 14, e1006401
(2018).
19. Marmier, G., Weigt, M. & Bitbol, A.-F. Phylogenetic correlations can suffice to infer protein partners from sequences. PLoS Comput.
Biol. 15, e1007179 (2019).
20. Laub, M. T. & Goulian, M. Specificity in two-component signal transduction pathways. Annu. Rev. Genet. 41, 121–145. https://
doi.org/10.1146/annurev.genet.41.042007.170548 (2007).
21. Rowland, M. A. & Deeds, E. J. Crosstalk and the evolution of specificity in two-component signaling. Proc. Natl. Acad. Sci. U.S.A.
111, 5550–5555 (2014).
22. Barakat, M. et al. P2CS: A two-component system resource for prokaryotic signal transduction research. BMC Genomics 10, 315
(2009).
23. Barakat, M., Ortet, P. & Whitworth, D. E. P2CS: A database of prokaryotic two-component systems. Nucleic Acids Res. 39, D771–
D776 (2011).
24. Ortet, P., Whitworth, D. E., Santaella, C., Achouak, W. & Barakat, M. P2CS: Updates of the prokaryotic two-component systems
database. Nucleic Acids Res. 43, D536–D541 (2015).
25. Ovchinnikov, S., Kamisetty, H. & Baker, D. Robust and accurate prediction of residue-residue interactions across protein interfaces
using evolutionary information. Elife 3, e02030 (2014).
Acknowledgements
We would like to thank Caio Souza for his work in the early stages of this project and Antônio Francisco Pereira
de Araújo for useful discussions. This work was supported by National Council for Scientific and Technological
Development CNPq [Grant number 302089/2019-5 (WT)], Coordenação de Aperfeiçoamento de Pessoal de
Nível Superior CAPES [Grant number 23038.010052/2013-95 (WT)], and Fundação de Apoio à Pesquisa do
Distrito Federal FAPDF [Grant number 193.001.202/2016 (WT)].
Author contributions
C.P., M.A. and W.T. designed research; C.P., M.A. and J.F. performed research; C.P., M.A., J.F. and W.T. analyzed
data; C.P. and W.T. wrote the original and the reviewed manuscript; C.P. and M.A. contributed equally to this
work.
Competing interests
The authors declare no competing interests.
Additional information
Supplementary Information The online version contains supplementary material available at https://doi.org/
10.1038/s41598-021-86455-0.
Correspondence and requests for materials should be addressed to W.T.
Reprints and permissions information is available at www.nature.com/reprints.
Publisher’s note Springer Nature remains neutral with regard to jurisdictional claims in published maps and
institutional affiliations.
Open Access This article is licensed under a Creative Commons Attribution 4.0 International
License, which permits use, sharing, adaptation, distribution and reproduction in any medium or
format, as long as you give appropriate credit to the original author(s) and the source, provide a link to the
Creative Commons licence, and indicate if changes were made. The images or other third party material in this
article are included in the article’s Creative Commons licence, unless indicated otherwise in a credit line to the
material. If material is not included in the article’s Creative Commons licence and your intended use is not
permitted by statutory regulation or exceeds the permitted use, you will need to obtain permission directly from
the copyright holder. To view a copy of this licence, visit http://creativecommons.org/licenses/by/4.0/.
© The Author(s) 2021
Scientific Reports | (2021) 11:6902 | https://doi.org/10.1038/s41598-021-86455-0 11
Vol.:(0123456789)You can also read