HALF YEAR RESULTS PRESENTATION - HALF YEAR ENDED 31 DECEMBER 2020 - Bell Direct

Page created by Andrew Chang
 
CONTINUE READING
HALF YEAR RESULTS PRESENTATION - HALF YEAR ENDED 31 DECEMBER 2020 - Bell Direct
HALF YEAR
RESULTS
PRESENTATION
HALF YEAR ENDED 31 DECEMBER 2020
HALF YEAR RESULTS PRESENTATION - HALF YEAR ENDED 31 DECEMBER 2020 - Bell Direct
DISCLAIMER AND NON-IFRS INFORMATION

  Disclaimer                                                                                      Non-IFRS Financial Information
  The material in this presentation has been       preparation of such statements, actual         carsales' results are reported under
  prepared by carsales.com Limited (ASX:           results may vary in a material manner.         International Financial Reporting
  CAR) ABN 91 074 444 018 (“carsales") and         Information in this presentation, including    Standards (IFRS). This presentation also
  is general background information about          forecast financial information, should not     includes certain non-IFRS measures
  carsales’ activities current as at the date of   be considered advice or a                      including “adjusted”, “underlying”
  this presentation. The information is given      recommendation to investors or potential       “proforma” and “look-through”. These
  in summary form and does not purport to          investors in relation to holding, purchasing   measures are used internally by
  be complete. In particular you are               or selling securities. Before acting on any    management to assess the performance
  cautioned not to place undue reliance on         information you should consider the            of our business and our associates, make
  any forward looking statements regarding         appropriateness of the information having      decisions on the allocation of resources
  our belief, intent or expectations with          regard to these matters, any relevant offer    and assess operational management.
  respect to carsales’ businesses, market          document and in particular, you should         Non-IFRS measures have not been subject
  conditions and/or results of operations, as      seek independent financial advice.             to audit or review. All numbers listed as
  although due care has been used in the                                                          reported comply with IFRS.

                                                                                                                                              2
HALF YEAR RESULTS PRESENTATION - HALF YEAR ENDED 31 DECEMBER 2020 - Bell Direct
CONTENTS

       Key Highlights & COVID-19 Observations     4–7

       Financial Review                          8 – 14

       carsales Australia                       15 – 19

       carsales International                   20 – 23

       Strategy Update                          24 – 32

       FY21 Outlook                             33 – 34

       Appendix                                 35 – 40

                                                          3
HALF YEAR RESULTS PRESENTATION - HALF YEAR ENDED 31 DECEMBER 2020 - Bell Direct
H1 FY21 HIGHLIGHTS

    • Strong earnings growth across our Domestic and International businesses.
    • Delivered 3% growth in Adjusted Revenue excluding the decline in low margin tyresales volumes, reflecting the resilience of the business.
    • $11m in dealer support demonstrating commitment to industry stake holders and reflected in reported financial metrics.
    • Excellent free cash flow generation and a strong balance sheet support an interim dividend of 25.0 cents per share, up 14% on pcp2.
    • Very strong international result with South Korean EBITDA up 30%4 and International now representing 25% of look-through3 revenue.
    • Significant growth potential in Domestic and International businesses with trends coming out of COVID-19 generally positive for carsales.

      Revenue                                                                              EBITDA                                                                                  Net Profit After Tax

                       Adjusted Revenue1                                                                       Adjusted EBITDA1                                                           Adjusted NPAT1

                                2%                                                                                       18%                                                                   17%
                              $210m                                                                                    $126m                                                                   $74m

                      Reported Revenue                                                                        Reported EBITDA                                                              Reported NPAT

                                  7%                                                                                     9%                                                                    14%
                              $199m                                                                                    $114m                                                                   $61m

 1. Adjusted Revenue excludes COVID-19 support rebate provided to dealers, Adjusted EBITDA and Adjusted NPAT stated above is post non-controlling interests and excludes certain
    non-recurring or non-cash items. See slide 36 regarding the disclosure of non-IFRS information and slides 37-38 for a reconciliation of Reported to Adjusted Financials.
 2. pcp refers to prior corresponding period
 3. For look-through definition refer slide 10                                                                                                                                                             4
 4. Refers to local currency growth.
HALF YEAR RESULTS PRESENTATION - HALF YEAR ENDED 31 DECEMBER 2020 - Bell Direct
MARKET-LEADING OPERATIONAL METRICS

                                     Metrics reflect the value we offer to customers and our leading position in key markets

               ~ 573,000 cars                                                        time to sell                                                               ~ 23 million                                                          ~ 560 million
                  for sale                                                         reduced by 40%                                                                  leads                                                                sessions
         around the world at any point                                           In Australia compared to the                                          on all carsales sites around                                             on all carsales sites around
           in time down 33% on pcp1                                                 same period last year2                                              the world up 69% on pcp3                                                 the world up 19% on pcp4

                      > 535,000                                                > 110,000                                                                      Most trusted                                                                  9x
                         cars                                             guarantee inspections                                                                  place                                                                   more time
          Australian Member cars in                                              cars up 38% In South Korea                                            for buying and selling cars in                                          spent on carsales.com.au
         our Virtual Garage up 32% on                                                      on pcp6                                                      Australia (+107% vs nearest                                          than nearest auto competitor
                      pcp5                                                                                                                                      competitor)7                                                         in Australia8

1. Stock published for websites in Australia, South Korea, Brazil, Mexico, Argentina and Chile on 31 Dec 2020 v 31 Dec 2019. I 2. Median time to sell Dec 2020 v Dec 2019. I 3. Leads from websites in Australia, South Korea, Brazil,
Mexico, Argentina and Chile Jul-20 – Dec-20 v Jul-19 – Dec-19. I 4. Google Analytics, sessions for websites in Australia, South Korea, Brazil, Mexico, Argentina and Chile Jul-20 – Dec-20 v Jul-19 – Dec-19. 5. carsales internal data. 6.

                                                                                                                                                                                                                                                               5
carsales internal data, cars inspected Jul-20 – Dec-20 v Jul-19 – Dec-19. 7. Study conducted by independent research agency Nature Pty Ltd Market brand health tracker. Dec-20. Reputation - Is Trustworthy (Rated 7-10). 8. Nielsen
DCR, Sep-20 – Dec-20.
HALF YEAR RESULTS PRESENTATION - HALF YEAR ENDED 31 DECEMBER 2020 - Bell Direct
EXTENDING OUR AUSTRALIAN MARKET LEADERSHIP

            Unique Audience1                                                                                  Total Sessions2                                                                             carsales has a comprehensive
                                                                 4.5x
                                                                                                                                                                6.7x                                      advantage in key
                                                                                                                                                                                                          engagement metrics.

                                                                                                                                                                                                           Unique audience5
                                                                                                                                                                                                           Nearly 20% of the Australian
                                                                                                                                                                                                           population visits carsales in an
                                                                                                                                                                                                           average month.

                                                                                                                                                                                                           Total sessions2
                       3                 1                2            carsales                                       3                2                1            carsales
                                                                                                                                                                                                           There are c.700 sessions per minute
                                         carsales             Competitor 1                  Competitor 2                  Competitor 3                                                                     on carsales, 6.7x more than the
                                                                                                                                                                                                           nearest competitor.

            Total Time on Site3                                   9x                                             Page Views4                                    25x                                        Total time on site3
                                                                                                                                                                                                           For every minute spent on our nearest
                                                                                                                                                                                                           competitor’s site, users spend 9
                                                                                                                                                                                                           minutes on carsales.

                                                                                                                                                                                                           Page Views4
                                                                                                                                                                                                           carsales serves c.9,000 page views
                                                                                                                                                                                                           every minute, 25x more than the
                                                                                                                                                                                                           nearest competitor.

                       3                 2                1            carsales                                       3                2                1            carsales

                                  We send the largest quantity and highest quality of leads, helping our customers sell more cars

1. Nielsen Digital Content Ratings, Daily, H1FY21, P2+, Digital C/M, Text, Carsales.com.au (Jul-Dec 2020), Competitor 1 (Sep-Dec 2020), Competitor 2 (Jul-Dec 2020), Competitor 3 (Jul-Dec 2020), Average Daily Unique Audience
2. Nielsen Digital Content Ratings, Monthly - Tagged, H1FY21 Sep - Dec 2020 Average, P2+, Digital C/M, Text, Total Sessions

                                                                                                                                                                                                                                                   6
3. Nielsen Digital Content Ratings, Monthly - Tagged, December 2020, P2+, Digital C/M, Text, Time Spent
4. Nielsen Digital Content Ratings, Monthly - Tagged, December 2020, P2+, Digital C/M, Text, Views
5. Nielsen Digital Content Ratings, Monthly Tagged, H1FY21, Jul-Dec 2020 P2+, Digital C/M, Text, Average Monthly Reach %
HALF YEAR RESULTS PRESENTATION - HALF YEAR ENDED 31 DECEMBER 2020 - Bell Direct
RECENT COVID-19 RELATED OBSERVATIONS

                                Strong growth in car ownership demand and traffic to our platform through COVID-19 continues.
                           Consumers avoiding public transport and air travel restrictions have been previously identified as key drivers.
                                        In addition, we have identified the following more recent COVID-19 observations:

           1. Flexible work arrangements are                                                                    2. Online shopping migration                                  3. Resilient industry and
             making driving more attractive                                                                            has accelerated                                            customer support

            Key observations from a recent carsales                                                         Key observations:
            survey on online automotive shopping:                                                                                                                        •   Lockdowns forced our dealer customers
                                                                                                            •    COVID-19 has accelerated the migration of                   to close, particularly evident in Victoria
            •    COVID-19 has resulted in an increase in                                                         offline to online shopping habits with                      where metropolitan dealers were forced
                 flexible work arrangements.                                                                     lockdowns forcing shoppers online                           to close for almost three months from the
                                                                                                            •    This migration trend is most apparent for                   start of August to the end of October.
                                                                                                                 consumers aged 57-75.
                Flexible work arrangements mean                                                                                                                          •   Carsales provided dealer support of
                  I’m more likely to drive to work                                                                                                                           ~$11m in H1 bringing total dealer
                     than take public transport                                                                                                                              pandemic support to c.$40m.
                                                                                                                                           1.5x
                                                                                                                                                                         •   The automotive industry in Australia has
                                                                                                                                                         37%                 been resilient throughout the pandemic,
                                                                                                                                                                             despite the challenges associated with
                                                                                                                                                                             temporary retail closures.
                                        53%                                                                                    25%
                                                                                                                                                                         •   The industry finished the year with
                                                                                                                                                                             buoyant levels of activity which has
                                                                                                                                                                             continued into the start of CY21.

                                                                                                                               2020                      2021
                              Agree        Disagree         Neutral

              53% of respondents indicated that                                                              Consumers aged 57-75 have increased
              flexible work arrangements meant                                                              their online spending as a share of total
            they were more likely to drive to work1                                                         from 25% to 37% during the pandemic2

1. carsales survey. ‘Flexible working arrangements will mean I am more likely to drive to work than take public transport.’ Conducted 14th–17th January 2021, n=4,847.
2. The Economist Intelligence Unit’s Influential Shopper Survey September 2020, n = >4,000. Sponsored by SAP Customer Experience.

                                                                                                                                                                                                                          7
HALF YEAR RESULTS PRESENTATION - HALF YEAR ENDED 31 DECEMBER 2020 - Bell Direct
GROUP
FINANCIAL
REVIEW

            8
HALF YEAR RESULTS PRESENTATION - HALF YEAR ENDED 31 DECEMBER 2020 - Bell Direct
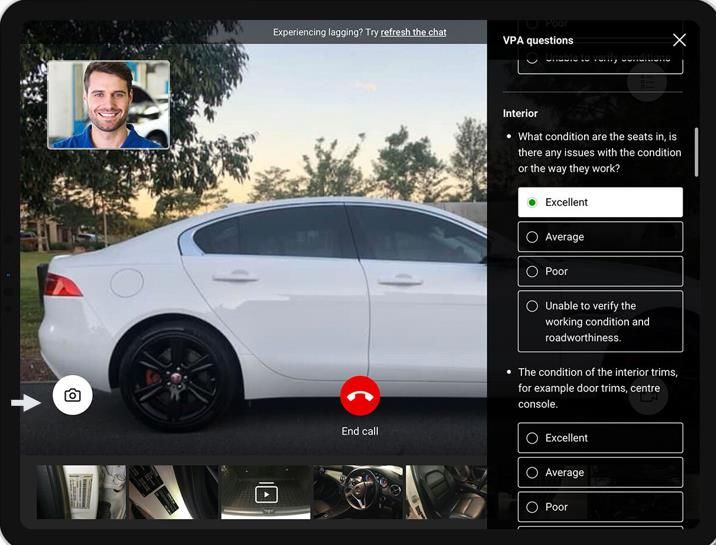
STRONG TRACK RECORD OF SUSTAINED GROWTH

                      Well positioned to continue delivering long-term shareholder value through world-class capability,
                           exposure to international growth markets and investment in new products and services.

               Adjusted Revenue1 ($m)                                                                  Adjusted EBITDA1 ($m)                                                                  Adjusted NPAT 1 ($m)

               CAGR                                                                                    CAGR                                                                                 CAGR
                  8%                                                                                  11%                                                                                     8%                              74.0
                                                                                                                                                              125.5
                                                         213.4                                                                                                                                                        63.4
                                           204.9                       209.5                                                                                                                           60.2   59.4
                                                                                                                                                106.7
                                                                                                                                  100.9                                                         53.9
                             169.5
                                                                                                                     88.6
               153.6                                                                                   81.4

                                                                   2
             H1 FY17 H1 FY18 H1 FY19 H1 FY20 H1 FY21                                                H1 FY17 H1 FY18 H1 FY19 H1 FY20 H1 FY21                                                  H1 FY17 H1 FY18 H1 FY19 H1 FY20 H1 FY21

1. Adjusted Revenue excludes COVID-19 support rebate provided to dealers, Adjusted EBITDA and Adjusted NPAT is post non-controlling interests and excludes certain non-recurring or non-cash items.
  See slide 36 regarding the disclosure of non-IFRS Information and slides 37-38 for a reconciliation of Reported to Adjusted Financials.
2. FY20 Asia segment revenue has been restated to align with carsales’ group accounting policy.
                                                                                                                                                                                                                                       9
HALF YEAR RESULTS PRESENTATION - HALF YEAR ENDED 31 DECEMBER 2020 - Bell Direct
LOOK-THROUGH FINANCIALS

              • International now contributes 25% of look-through1 revenue and 20% of look-through1 EBITDA.

              • International look-through1 revenue and EBITDA grew 17% and 41% respectively.

                            Look-through1 Adjusted Revenue2 ($m)                                                                                                Look-through1 Adjusted EBITDA2 ($m)

                                     0%                                                           CAGR
                                                                                                                                                                         18%                                                        CAGR
                                  to $217m                                                           8%                                                               to $129m                                                      11%

                                                                                     215.6              216.5                                                                                                                           129.3
                                                                 203.8
                                                                                                                                                                                                                            109.2          20%
                                              176.2                                   21%                25%                                                                                           103.3
                           158.6                                  20%                                                                                                                92.2
                                               12%                                                                                                                                                                          17%                  EBITDA
                                                                                                                                                                  83.7                                  15%
                            11%                                                                                          Revenue                                                      9%                                                         contribution
                                                                                                                         contribution                              8%

                                                                                      79%                                                                                                                                                  80%
                                               88%                80%                                    75%                                                                         91%                85%                 83%
                            89%                                                                                                                                   92%

                         H1 FY17            H1 FY18            H1 FY19            H1 FY20             H1 FY21                                                 H1 FY17             H1 FY18            H1 FY19               H1 FY20     H1 FY21

                                  carsales Domestic                      carsales International                                                                       carsales Domestic                      carsales International

1. carsales “look-through” methodology: For equity accounted associates and consolidated subsidiaries, add the total revenue or EBITDA for the period of ownership within the reporting period multiplied by the
  % ownership over the period. Some “look-through” numbers involve the disclosure of non IFRS information - Refer to carsales’ Disclosure of Non IFRS information on slide 36 for further details.
2. Adjusted Revenue and Adjusted EBITDA stated above excludes currency fluctuation, certain non-recurring or non-cash items relating to restructuring and M&A transaction cost. See slide 36 regarding the disclosure of
   non-IFRS information and slides 37-38 for a reconciliation of Adjusted EBITDA to Reported EBITDA.                                                                                                                                                            10
SUMMARY ADJUSTED REVENUE & ADJUSTED EBITDA PERFORMANCE

                                                       $A Millions                        Growth                  Constant                  Revenue
Half Year Ending
                                                                                                                  Currency
31 Dec 2020                                      H1 FY201          H1 FY21             $'s             %                                 • Delivered 3% growth in Adjusted                                      • Reduction in media revenue due to
                                                                                                                    (%)
                              2
                                                                                                                                              Revenue2 excluding decline in low                                   challenging new car supply and
Adjusted Revenue
                                                                                                                                              margin tyresales volumes.                                           advertising conditions.
 Online Advertising                                 152.6            143.9            (8.7)          (6%)             (6%)
      Dealer                                        79.4              87.0             7.6           10%              10%                • Solid results from Dealer segment                                    • Delivered growth in DR&S segment
      Private                                       44.3              33.6           (10.8)         (24%)            (24%)                    reflecting strength of the car                                      excluding intentional exit of low
      Media                                         28.8              23.4            (5.5)         (19%)            (19%)                    market and strong carsales value                                    margin warranty product.
 Data, Research and Services                        21.8              21.6            (0.2)          (1%)             (1%)                    proposition.
                                                                                                                                                                                                                • Excellent Asia result driven by
 Asia                                               34.6              40.7             6.1           18%              21%
                                                                                                                                         • Core private revenue in line with                                      strong growth in South Korea.
 Latin America                                       4.4               3.3            (1.1)         (25%)             (5%)                    pcp. tyresales volumes impacted
                                                                                                                                                                                                                • Latin America performance
Adjusted Revenue2                                  213.4             209.5            (3.9)          (2%)             (1%)                    by COVID-19 and focus on
                                                                                                                                                                                                                  impacted by COVID-19 restrictions.
                                                                                                                                              profitable sales.
                          2
Adjusted EBITDA
 Online Advertising                                 78.5              89.5            11.0           14%              14%
 Data, Research and Services                        13.4              14.3             0.9            7%               7%                EBITDA
 Asia                                               17.5              21.8             4.3           25%              28%                 • Pleasing to see EBITDA expand                                        excellent results in South Korea
 Latin America                                      (2.7)             (0.1)            2.6           97%              95%                     across all segments with                                           and Brazil.
Adjusted EBITDA
                          2
                                                   106.7             125.5            18.8           18%              18%                     Adjusted EBITDA2 up 18% on pcp.
                                                                                                                                                                                                          • Higher Asia margin reflects
                                                                                                                                          • Growth in Online Advertising &                                       operating cost leverage in South
EBITDA Margin                                        50%              60%                                                                     DR&S reflects resilient revenue                                    Korea.
                                                                                                                                              performance augmented by
                                                                                                                                                                                                          • Break even result achieved in the
                                                                                                                                              strong cost discipline and
                                                                                                                                                                                                                 Latin America segment reflecting
                                                                                                                                              operating leverage.
                                                                                                                                                                                                                 strong operating cost discipline.
                                                                                                                                          • Strong international result with
                                                                                                                                              look-through3 Adjusted EBITDA2
                                                                                                                                              up 41%4 underpinned by.

1. FY20 Asia segment revenue has been restated to align with carsales’ group accounting policy.
2. Adjusted Revenue excludes COVID-19 support rebate provided to dealers and Adjusted EBITDA stated above excludes certain non-recurring items. See slide 36 regarding the disclosure of non-IFRS Information
   and slides 37-38 for a reconciliation of Adjusted EBITDA to Reported EBITDA.
3. For look-through definition refer slide 10.                                                                                                                                                                                                         11
4. Represents constant currency growth.
GOOD DOMESTIC AND INTERNATIONAL MARGIN PERFORMANCE

                                                                       Strong margin performance across all segments

                                                                                                                                                                                 1.5%             59.9%
                                                                                                         3.7%                                    0.5%
                                                                 4.2%
                         50.0%

                H1 FY20 Adjusted                            Domestic Core                 Other Domestic Investments                              Asia                        Latin America   H1 FY21 Adjusted
                 EBITDA1 Margin                                                                                                                                                                EBITDA1 Margin

                  Domestic                                                                                                                        International

                  • Domestic core business margin of 67% in H1 FY21, reflecting                                                                   • Asia growth reflects margin expansion in South Korea
                    a resilient revenue performance supplemented by strong cost                                                                     delivering positive operating leverage whilst continuing
                    discipline, including reduced marketing spend, wages and                                                                        to invest in growth initiatives. Expect margin to be lower
                    other discretionary costs. Expect core operating costs to be                                                                    in H2 due to investment in Dealer Direct growth.
                    higher in H2 due to investment in marketing and the absence
                    of wage subsidies which were c.$6m in H1 FY21.                                                                                • First break even result across Latin American segment
                                                                                                                                                    reflecting strong cost and operating discipline, which had
                  • Improved margins in Other Domestic Investments primarily                                                                        a positive contribution on overall margins.
                    reflects a greater focus on profitability in tyresales and
                    improved margins in Redbook Inspect.

1. Adjusted EBITDA stated above is on a continuing basis, excludes certain non-recurring or non-cash items relating to restructuring and M&A transaction cost. See slide 36
   regarding the disclosure of non-IFRS information and slides 37-38 for a reconciliation of Reported to Adjusted Financials.

                                                                                                                                                                                                                 12
ADJUSTED NET PROFIT AFTER TAX SUMMARY

           Half Year Ending                                                           $A Millions                         Growth
                                                                                             1
                                                                                                  H1 FY21              $'s            %
                                                                                                                                                            • D&A increased by $2.0m due to increased depreciation of
           31 Dec 2020                                                        H1 FY20
                                       2
                                                                                                                                                                 building fit outs and software assets. The software
           Adjusted Revenue                                                       213.4              209.5            (3.9)         (2%)
                                                                                                                                                                 investment continues to support ongoing growth and
           Total operating expenses                                               106.7               84.0            22.7          21%
                                                                                                                                                                 development of our global technology platform.
           Adjusted EBITDA2                                                       106.7              125.5            18.8          18%
             EBITDA margin                                                        50.0%             59.9%                                                   • Net finance cost increase reflects marginally higher average
           Depreciation & amortisation                                             13.6               15.6            (2.0)         (14%)                        debt balance over the period.
           EBIT                                                                    93.1              109.9            16.8          18%                     • Profits from associates largely reflects contribution from
           Net finance costs                                                        7.3                8.0            (0.7)         (10%)                        Webmotors and is lower than pcp due to unfavourable
           Profit Before Tax                                                       85.9              101.9            16.1          19%                          exchange rate.
           Income tax expense                                                      25.7               30.3            (4.6)         (18%)
                                                                                                                                                            • Negative impact of non-controlling interest reflects
           Profits from associates                                                  2.7                2.6            (0.1)         (3%)
                                                                                                                                                                 improved profitability in non-wholly owned subsidiaries.
           Non-controlling interests (NCI)                                          0.6               (0.2)           (0.8)          n/a
           Adjusted NPAT
                                  2
                                                                                   63.4               74.0            10.6          17%                     • Interim dividend of 25.0 cents per share declared, up 14%
           Adjusted Earnings per share (cents)                                     25.9               30.1             4.2          16%                          on pcp.
           Interim Dividend per share (cents)                                      22.0               25.0             3.0          14%

           Summary of Reported Results                                                                                                                      • Reported results impacted by $11m COVID-19 dealer
                                                                                                                                                                 support package. Refer to slides 37-38 for a reconciliation
           Reported Revenue                                                       213.4              198.9            (14.5)        (7%)
                                                                                                                                                                 between reported and adjusted results.
           Reported EBITDA                                                        104.5              113.8             9.3           9%
           Reported NPAT                                                           71.2               61.1            (10.1)        (14%)
           Reported Earnings per share (cents)                                     29.1               24.8            (4.3)        (15%)

           The analysis above shows the Adjusted net profit after tax results of the business. Details of the
           reconciliation between Adjusted and Reported results are shown on slides 37-38. This analysis
           better reflects the underlying trading performance of the Group.

1. FY20 Asia segment revenue has been restated to align with carsales’ group accounting policy.
2. Adjusted Revenue, Adjusted EBITDA and Adjusted NPAT stated above is post non-controlling interests and excludes certain non-recurring or non-cash items. See slide 36 regarding the disclosure of

                                                                                                                                                                                                                               13
   non-IFRS information and slides 37-38 for a reconciliation of Reported to Adjusted Financials.
STRONG CASH FLOW FROM OPERATIONS AND ROBUST BALANCE SHEET

               Cash flow1 (column) and conversion                                                                      Capital expenditure ($m)                                                  • Excellent conversion of EBITDA to cash
               from Reported EBITDA to cash (line)                                                                                                                                                    flow reflects the attractive working capital
                                                                                                                                                                                                      profile of the business and good cash
                                                                          126.6                                                               +7%                                                     collections.
                                                            114.4
                                             104.9
                                                                                                                                                                                                 • Capex up 7% reflecting continued
                 81.3          81.3                                                                                                                                                                   investment in technology platforms and
                                                            110%           111%                                                                                                                       new products to drive future growth.
                                              104%
                100%
                                                                                                                                  15.6                   16.7
                                92%                                                                                                                                                              • Leverage ratio has decreased and remains
                                                                                                                                                                                                      prudent at 1.5x.

                                                                                                                                                                                                 • Reduction in net debt reflects repayment
             H1 FY17 H1 FY18 H1 FY19 H1 FY20 H1 FY21                                                                           H1 FY20                H1 FY21                                         of borrowings and favourable FX on cross
                                                                                                                                                                                                      currency swaps.

                            Leverage ratio2                                                                                            Net debt2
                     (net debt2/Adjusted EBITDA3)

                                                                                                          $A Millions                    Dec-19 Dec-20                   %
                                                                                                          Borrowings                        482.6          463.2         4%
                                                                                                          Swaps                               15.2             4.0      74%
                                      1.7
                                                          1.5
                                                                                                          Cash                             (108.6)        (106.6)       -2%

                                                                                                          Net Debt                           389.2          360.6        7%

                                  H1 FY20             H1 FY21

1. Operating cash flow less tax.
2. Net debt includes total borrowings and cross currency interest swaps less total cash as at 31 December 2020 as per published balance sheet, excluding lease liabilities. Ratios above are based on reported
   financial outcomes and may vary with bank covenant definitions.
3. Adjusted EBITDA stated above excludes certain non-recurring items. See slide 36 regarding the disclosure of non-IFRS Information and slides 37-38 for a reconciliation of Reported to Adjusted Financials.                                        14
CARSALES
AUSTRALIA

            15
DEALER

                         Dealer Adjusted Revenue1 up 10% to $87m

                                                             +10%                                                                                                    Solving Dealer Car Sourcing

                       ($m)                                                                   79.2
                                                79.4                      87.0             (reported)
                                                                                                                                                           Instant                 Live               Appraisal
                                                                                                                                                            Offer                 Trade                Tools

                                             H1 FY20                   H1 FY21

           • Pleasing growth in Dealer segment reflecting strength of used car
                market and carsales’ continued market leadership.

           • Used car lead volumes were the key growth driver with demand
                positively impacted by trends from COVID-19, including acceleration of
                structural migration to online sales channels as well as positive trends in
                car ownership and usage.                                                                                                                    carsales helps dealers solve supply challenges by
                                                                                                                                                           providing sourcing tools that enable faster access to
           • Growth also supported by compelling suite of inventory sourcing                                                                                 inventory from private sellers and other dealers
                products, helping dealers to address supply challenges they are facing in
                the market.

           • Depth growth subdued given strong underlying demand for cars and
                very low organic time to sell.

1. Adjusted Revenue stated above excludes COVID-19 support rebate provided to dealers. See slide 36 regarding the disclosure of non-IFRS information and
   slides 37-38 for a reconciliation of Reported to Adjusted Financials.
                                                                                                                                                                                                                   16
PRIVATE

           Private revenue down 24% to $33.6m
                                                                                          Remote Video Assessment

                                  -24%

         ($m)
                         44.3
                                          33.6

                       H1 FY20           H1 FY21

   • Core private revenue was flat on pcp, a positive outcome given
      Q1 was negatively impacted by social distancing measures,
      particularly in Victoria. Instant Offer volumes have recovered       Designed to provide a seamless, device agnostic and scalable
      well, demonstrating very strong growth on pcp in Q2.                              solution for remote data gathering

   • Decline in overall private revenue largely attributable to                                 How does it work
      materially lower tyresales volumes, reflecting the impact of
      COVID-19 and a greater focus on profitability.

   • Redbook Inspect volumes were significantly impacted by the
      restrictions in Victoria, but have recovered well.
                                                                       We contact sellers via video    We then gather    A detailed report is collated
                                                                       chat to discuss their vehicle   additional data   and delivered to your inbox

                                                                                                                                                         17
MEDIA

                 Media Adjusted Revenue1 down 19% to $23.4m
                                                                                                                                                                                         VFACTS reported new car sales2
                                                               -19%
                                                                                                                                                                                                                                                                              -14%

                                                                                                                                                                       1.16                 1.18                    1.19                   1.15
                                                                                                                                                                                                                                                                  1.06
                                                                                                                                                                                                                                                                                            0.92

                         ($m)
                                                  28.8                                          22.9                                                               2015                    2016                     2017                  2018                    2019                      2020
                                                                            23.4             (reported)

                                                                                                                                                                                                                                                                                                     8%

                                               H1 FY20                   H1 FY21

                                                                                                                                                              Mar-17
                                                                                                                                                                       Jun-17

                                                                                                                                                                                                           Jun-18

                                                                                                                                                                                                                                               Jun-19
                                                                                                                                                                                         Dec-17
                                                                                                                                                                                                  Mar-18

                                                                                                                                                                                                                             Dec-18
                                                                                                                                                                                                                                      Mar-19

                                                                                                                                                                                                                                                                 Dec-19
                                                                                                                                                                                                                                                                          Mar-20
                                                                                                                                                                                                                                                                                   Jun-20

                                                                                                                                                                                                                                                                                                     Dec-20
                                                                                                                                                                                Sep-17

                                                                                                                                                                                                                    Sep-18

                                                                                                                                                                                                                                                        Sep-19

                                                                                                                                                                                                                                                                                            Sep-20
             • Very challenging advertising environment due to the significant
                  reduction in new car sales and associated reduction in OEM
                  advertising budgets. Despite new car sales returning to growth in
                  December, advertising budgets are proving slower to recover.
                  Nevertheless, we are continuing to observe a gradual recovery in                                                                            New car sales in 2020 declined 14% on 2019 however the
                  media revenue run rate against pcp.                                                                                                        last quarter of sales have grown 8% on pcp indicating signs
                                                                                                                                                                          of recovery in the new car market.
             • The media business increased its share of a contracted market.
                  This is testament to the continued attractiveness of our site as a
                  digital marketing channel, the strong growth in our audience
                  metrics and the benefits of our enhanced native and video product
                  offering.

1. Adjusted Revenue stated above excludes COVID-19 support discount provided to dealers. See slide 36 regarding the disclosure of non-IFRS information and
   slides 37-38 for a reconciliation of Reported to Adjusted Financials.

                                                                                                                                                                                                                                                                                                              18
2. Reported new car sales, Federal Chamber of Automotive Industries.
DATA RESEARCH & SERVICES

                    DR&S Adjusted Revenue1 down 1% to $21.6
                                                                                                                                                                                                      RedBook

                                                                -1%

                        ($m)
                                                 21.8                       21.6                19.2
                                                                                             (reported)

                                              H1 FY20                    H1 FY21

               • Revenue growth impacted by intentional exit of our lower
                    margin warranty product. Underlying revenue growth of 2%
                    excluding this impact, reflecting resilience of the segment.

               • RedBook business continues to deliver pleasing revenue growth                                                                                 RedBook is the pre-eminent provider of vehicle specification,
                    despite difficult macroeconomic conditions, demonstrating                                                                                  valuation and pricing services in Australia. These services are
                                                                                                                                                              delivered through various products and services catered to the
                    strong value proposition as a market leading source of vehicle
                                                                                                                                                                  public, the automotive industry, finance and insurance
                    specification, valuation and pricing data.                                                                                                companies and the Government. Redbook has remained at the
                                                                                                                                                                   forefront of innovative products in Australia and Asia.

1. Adjusted Revenue stated above excludes COVID support discount provided to dealers. See slide 36 regarding the disclosure of non-IFRS information and slides 37-38 for a reconciliation of Reported to Adjusted Financials.

                                                                                                                                                                                                                                 19
CARSALES
INTERNATIONAL
ASIA –ENCAR (SOUTH KOREA)

                                                Strong performance reflecting good momentum in new product performance

                                      $A Millions                           Growth                   Constant
                                                                                                                      • Acceleration of revenue and EBITDA growth rates reflecting
                                H1 FY20 H1 FY21                        $'s           %              Currency (%)
                                                                                                                            • the benefits of the online migration driven by COVID-19;
    Revenue         1
                                    32.4             38.6              6.2           19%                23%                   and
                                                                                                                            • new growth drivers, particularly the Dealer Direct product
    EBITDA                          16.3             20.6              4.3           26%                30%
                                                                                                                              which is now a meaningful revenue contributor.
                                                                                                                      • Key revenue growth drivers were:
                                                                                                                            • Guarantee vehicle inspection service opening of 3 new
                                                                                                                              branches and continued improvements in utilisation of
          Revenue (KRW bn)                                                   EBITDA (KRW bn)
                                                                                                                              existing branches;
                                                                                                                            • Good growth in standard dealer listing volumes;
           CAGR                                                             CAGR
          16%                                                               19%                                             • Very strong growth in Dealer Direct product; and
                                                                                                                            • Strong growth in Home Delivery service.

                                                        32.2                                                          • Very good growth in traffic reflecting continued market
                                                                                                              17.2      leadership.
                                             26.3
                                 23.8                                                                 13.2            • Improved margins through operating leverage whilst continuing
                        19.9
                                                                                                                        to invest in future growth, with a step up of investment
          17.9                                                                               10.6                       expected in the second half.
                                                                               8.6    8.7

        H1 FY17 H1 FY18 H1 FY19 H1 FY20 H1 FY21                             H1 FY17 H1 FY18 H1 FY19 H1 FY20 H1 FY21

1. FY20 revenue has been restated to align with carsales’ group accounting policy.

                                                                                                                                                                                           21
LATIN AMERICA – WEBMOTORS (BRAZIL)
30% owned – equity accounted

                Resilient performance reflects strength of Webmotors’ market position and ongoing growth potential

    Pro-forma                        $A Millions                        Growth                          Constant                                   •    Positive performance given material impact of COVID-19.
    100%                      H1 FY20 H1 FY21                       $'s              %                 Currency (%)                                     Growth in AUD impacted by unfavourable exchange rate.

    Revenue1                      41.1            32.5            (8.7)           (21%)                       11%
                                                                                                                                                   •    Finance revenue now a material contributor to business,
    EBITDA
                1
                                  18.2            15.4            (2.8)           (15%)                       21%                                       comprising more than 15% of revenue and growing rapidly.
                                                                                                                                                        Growth driven by Santander bank integration, which allows
                                                                                                                                                        seamless credit integration into Cockpit (Webmotors’ CRM).

                                                                                                                                                   •    Recommenced large scale regional expansion plan at end of
        Revenue1           (BRLm)                                         EBITDA1        (BRLm)                                                         Q2. Pre-COVID, this strategy was showing very positive signs
                                                                                                                                                        with a material uplift in dealer numbers, traffic and leads.

          CAGR                                                          CAGR                                                                       •    Good margin expansion reflecting operating leverage and
         25%                                                            54%                                                                             strong cost control measures.

                                                                                                                                                   •    Excellent growth in non-financial KPIs in H1, with Leads2 up
                                                   126.6                                                             61.6                               82% and Dealer customer2 numbers up 2% on pcp.
                                        113.7
                                                                                                          49.8
                              88.7
                                                                                              37.0
                    67.5
        51.8                                                                      24.1

                                                                       10.8

      H1 FY17 H1 FY18 H1 FY19 H1 FY20 H1 FY21                       H1 FY17 H1 FY18 H1 FY19 H1 FY20 H1 FY21

1. Revenue and EBITDA stated is 100% of the revenue and EBITDA for the business.
2. Lead volume generated for the period Jul-20 to Dec-20 compared with Jul-19 to Dec-19 and Dealer Customer number represents Dec-20 count compared to Dec-19.
                                                                                                                                                                                                                       22
LATIN AMERICA

                                      Break even results across Latin America segment reflecting strong cost discipline, a
                                                           positive result given COVID-19 challenges

                                                                                                                    Visits 1            Leads 1
                                                                                                                     +77%               +134%          •   Revenue performance in Chile impacted by
                                            $A Millions                    Growth                Constant                                                  COVID-19 albeit with an improving run rate
      CHILE

                                       H1 FY20 H1 FY21               $'s            %
                                                                                                Currency (%)                                               in Q2. Lead volumes were strong, up 15%
                                                                                                                                                           on pcp driven by strong demand for cars.
                  Revenue                  2.6          2.3         (0.3)        (12%)              (4%)

                  EBITDA                   0.9          1.0          0.1          11%               25%                                                •   Positive EBITDA result through good
                                                                                                               H1 FY20   H1 FY21   H1 FY20   H1 FY21
                                                                                                                                                           operating cost discipline.

                                                                                                                                                       •   Positive revenue result despite the
                                                                                                                    Visits 1            Leads 1
                                                                                                                     -40%
                                                                                                                                                           challenging trading environment. The
                                           $A Millions                  Growth                   Constant                               +100%              business is realising benefits from the global
      MEXICO2

                                                                                                Currency (%)                                               technology and platform strategy.
                                       H1 FY20 H1 FY21               $'s           %
                  Revenue                  1.0          0.9         (0.1)        (6%)               6%
                                                                                                                                                       •   Reduced losses reflecting strong cost
                  EBITDA                  (2.4)        (0.6)         1.8         75%                70%                                                    management.

                                                                                                               H1 FY20   H1 FY21   H1 FY20   H1 FY21

                                                                                                                    Visits 1            Leads 1
                                                                                                                                                       •   Continued challenging macro conditions
      ARGENTINA

                                                                                                                     -16%                -30%
                                           $A Millions                  Growth                   Constant                                                  exacerbated by the pandemic. Good cost
                                       H1 FY20 H1 FY21               $'s           %
                                                                                                Currency (%)                                               control delivered a positive EBITDA
                                                                                                                                                           outcome.
                  Revenue                  0.4          0.2         (0.2)       (50%)              (33%)

                  EBITDA                  (0.8)        (0.4)         0.4         50%                33%

                                                                                                               H1 FY20   H1 FY21   H1 FY20   H1 FY21

1. Visits and leads generated for the period Jul-20 to Dec-20 compared with Jul-19 to Dec-19.
2. Mexico represents soloautos entity and excludes the Mexican inventory management business.
                                                                                                                                                                                                            23
STRATEGY
UPDATE
CARSALES STRATEGY

                        OUR PURPOSE: We empower people to move freely through our world-leading marketplaces

                                                                  Value added services
                           Digital marketplaces                                                             Future horizons
 We are focused                                               To build a compelling ecosystem
                        To grow our global leadership                                                Leveraging consumer insights and
                                                              of services that support dealers,
on three strategic      in digital automotive classified                                              industry trends to explore new
                                                                OEMs, corporate and private
   priorities…              solutions for consumer
                                                               consumers through the buying,
                                                                                                     opportunities in core and adjacent
                          and commercial customers                                                         markets, and beyond
                                                              selling and ownership of vehicles

                     Data | To become a ‘best-in-class’ data-driven company, with unrivalled data and analytics to help customers
                     understand their audience and commercial clients to grow their businesses
… supported by       People | To be an employer of choice and destination for talent by continuously evolving our culture of
three enablers…      inclusion, learning, leadership, performance and passion
                     Technology | To build ‘best-in-class’ global platform-based software services that exceed the expectations
                     of our customers and drive continued growth in the carsales business

     … and
 underpinned                          Our DNA                                                     Our Values
 by our unique
                       Innovation | Simplicity | Customer focus         Enjoyment | Respect | Integrity | Communication | Honesty
    culture

                                                                                                                                          25
AUSTRALIA FY21 KEY FOCUS AREAS

   Investing in improved customer experience and value based outcomes to underpin future growth

                   Key Strategic Objectives                             FY21 Focus Areas

                 • Grow ROI for dealers on core transaction
                                                                    •   Launch dealer ratings on details pages to improve lead conversion
                   products
                                                                    •   Expand usage of recurring, no-touch promote products
                 • Increase penetration and usage of listing
                                                                    •   Commence monetisation of dealer finance
      Dealer       depth products
                                                                    •   help our dealers deliver an online car selling experience (update
                 • Monetise dealer finance
                                                                        on following slides)
                 • Update: Facilitate an increasingly digital car
                   buying process
                 • Grow penetration of trust and safety
                                                                    • Launch enhanced buyer insights products (update on following
                   products
                                                                        slides)
     Private     • Yield optimisation on core private revenue
                                                                    • Increase yield through dynamic pricing models
                 • Drive growth in inspection volumes through
                                                                    • Commence inspection and certifications of non-auto brands
                   new service offerings

                                                                    • Grow share of non-automotive media spend through broader
                 • Diversify customer base
                                                                        industry targeting and a tailored product set
      Media      • Increase programmatic capability
                                                                    • Upgrade ad server tech functionality to increase programmatic
                                                                        capability and monetisation of inventory

                 • Expand dealer product portfolio to address       • Release new value added products for dealers
      Data,
                   gaps in the market                               • Increase feature experience for logged-in members
    Research &
                 • Build and enhance engagement with                • Execute Owner Accelerate membership program to drive better
     Services
                   members                                              engagement with our Virtual Garage (update on following slides)

                                                                                                                                            26
DIGITAL CAR BUYING

        We are focused on helping dealers to bring more of the car buying process online

        •    Increasingly more of the car buying process is taking place online
        •    Our focus is on helping dealers digitise their products and consumer experiences with carsales

        FIND YOUR CAR             INSPECT THE CAR             PAY FOR THE CAR         SELL YOUR CAR            TAKE DELIVERY

                                                        Consumer demand trends

    •   Having the best       •   Buying without          •   Accept deposit      •   Movement away        •   Collect from the
        selection of online       physical inspection         online                  from negotiating         dealer or have the
        listings                                                                      and toward fixed         car delivered
                              •   Preference for          •   Faster credit           pricing
    •   Personalised,             minimum quality             checking and                                 •   Warranties and
        relevant content          standards                   approvals for       •   Less time spent          money-back
                                                              finance                 administering sale       guarantees
                                                                                      of car

                                      How carsales is building the digital experience for dealers

    •   The #1 site for new   •   Remote                  •   Dealer finance      •   Valuations           •   Dealer delivery
        and used cars             Assessment                  products            •   Private used             badges
                              •   RedBook Inspect         •   Escrow                  classifieds
                              •   Facts +                                         •   Instant offer

                                                                                                                                    27
PROVIDING CAR BUYERS WITH BETTER INSIGHTS AND CONFIDENCE

          FACTS+ gives car buyers added confidence and peace of mind in their next car purchase

           Car History                     Market Insights                 Pricing Guides                Reviews and Ratings

         What you need to                        View real                  Compare similar                   See what the
        know before buying                     time activity                  & sold cars                      experts say

   •   Written off and stolen status   •   See current level of      •   Historical price change     •    Ratings from our team of
   •   Finance owing status                demand for similar cars       information and real time        auto experts across key
   •   Rego validation                     and median time to sell       updates                          categories
   •   Any identified odometer                                       •   Compare prices of similar   •    Reviews from past owners
       discrepancies                                                     cars currently published         on their experience
   •   Official PPSR certificate                                         or recently sold

                                                                                                                                     28
PLACIE NOW IN BETA

                           Placie is an app that helps customers seamlessly combine, compare, & book 8+ modes of transport to
                                                         get from place to place faster and cheaper

                                  Transport mega trends are                                     More than a regular journey planner:
                                                                                                •   One stop (mobility) shop for consumers to save time, money and effort
                                    changing how we move                                        •   Real-time data for on-demand and scheduling multi modal journeys
                                                                                                •   One account for all private partner bookings
             •    The rise of ride-sharing and on-demand services have                          •   Transport partners all natively integrated (no need to leave the app)
                  resulted in a the proliferation of transport options
             •    COVID-19 is also accelerating change and disruption

                                 carsales is a world leader in
                                    digital marketplaces

             •    One of Australia’s biggest tech enabled businesses
             •    Proven leader in B2C aggregation
             •    Track record for driving innovation and growth

                           Strong Mobility as a Service (MaaS)
                                growth outlook globally

             •    Global Transport spend 20181:                                       A$8.7tn   What’s coming up next:
             •    Global MaaS Penetration % 20181:
INTERNATIONAL FY21 KEY FOCUS AREAS

        Investing in products and leveraging global technology platform to underpin the growth

               Key Strategic Objectives                                FY21 Focus Areas
                                                                   • Open new Guarantee sites in strategic locations and continue
                                                                       increasing utilisation by enhancing efficiency at sites to allow
             • Increase penetration and usage of Guarantee
                                                                       inspection of more vehicles
    South      product
                                                                   • Strengthening consumer awareness and improving user
    Korea    • Update: expand our Dealer Direct product offering
                                                                       experience for Dealer Direct. (update on following slides)
             • Update: expand our Home Service product offering
                                                                   • Expanding the supply of participating Home Service dealers
                                                                       and strengthening operational processes including payment.

             • Increase monetisation of Cockpit products           •   Commence monetisation of CRM +smart subscription
             • Increase contribution of finance revenue            •   Expand volume of eligible home delivery cars
             • Increase traffic and lead volumes to dealers        •   Broaden customer base of OEMs using display products
    Brazil
             • Expand Webmotors regional brand presence            •   Restart regional brand marketing and expansion campaign if
               (conditions permitting)                                 conditions allow

                                                                   • Deploy new inventory and lead management platform, which
             • Continue to invest in global platform and product
                                                                       will complement improved dealer monetisation
               optimisations to drive key operating metrics and
                                                                   • Drive enhanced data and analytics capabilities across the
    Other      consolidate market leading positions
                                                                       region
    LATAM    • Optimise finance opportunity
                                                                   • Chile and Argentina – execute finance partnerships with local
             • Deploy new inventory and lead management
                                                                       banks
               platform

                                                                                                                                          30
SOUTH KOREA KEY FOCUS AREAS

                       Encar’s Dealer Direct product represents a substantial growth opportunity

            The trade-in market is substantial                                                           Encar is well positioned to
             and moving increasingly online                                                                capture market share

  •   Trade-ins are more common in South Korea when compared with               •   Encar Dealer Direct is similar to carsales’ Instant Offer product,
      Australia and other automotive markets.                                       enabling a private seller to sell their car directly to a dealer at a
                                                                                    transparent price, in an efficient manner.
  •   Relatively low proportion of consumer-to-consumer transactions,
      which is driven by market culture in South Korea.                         •   Encar currently has low double-digit penetration of online trade-in
                                                                                    market but is well positioned to capture additional share given it has
  •   Trade-ins are beginning to migrate online, which makes this a                 some strong competitive advantages:
      very attractive market for Encar.                                                  • Strong and trusted brand;
                                                                                         • Largest automotive classifieds audience in South Korea which
                                                                                            can leverage to the Dealer Direct product;
                                                                                         • Large dealer customer network;
                                                                                         • Unrivalled data assets; and
                                                                                         • Technology leadership

                                                   Total vehicle sales                                Dealer Direct Revenue (KRW, millions)
               5.0m                                New and used cars

                                                   Offline trade-ins
               1.5m                                Declining a c.5% per annum

                                                   Online trade-ins
                150k                               Growing at c.50% per annum
                                                                                              H1 19        H2 19       H1 20        H2 20        H1 21

                                                                                                                                                             31
SOUTH KOREA KEY FOCUS AREAS

  Product description and charging model
  • Key difference between carsales’ Instant Offer and Encar’s Dealer
    Direct product is pricing approach. Dealer Direct price is established
    via a virtual dealer auction process, whereas carsales determines the
    Instant Offer price using its own pricing engine.
                                                                                 Dealer Direct Quotation App
  • Dealer Direct consumer lists car onto Encar’s auction site and
    receives up to 20 bids from participating dealers. The highest
    bidding dealer wins right to contact the consumer and arrange the
    sale.

  • Successful dealer pays Encar a c.1% success fee of the vehicle’s value
    as well as a recurring flat monthly fee to participate in auctions.

  Focus areas for the next six months
                                                                                 Bids
  • Given size and growth of Consumer-to-Business channel, we are
    planning to increase focus and investment in following key areas:            Leader

       i.     Consumer marketing that will specifically target Consumer-
              to-Business channel and also benefit the broader Encar
              business;
       ii.    Facilitate increasingly seamless consumer application
              experience through better vehicle specification data and
              improved photo upload process;
       iii.   Improving dealer pricing behaviour with guidelines and
              consumer feedback; and
       iv.    Acquiring new dealers onto the Dealer Direct platform, key
              to generating competitive pricing and high consumer
              satisfaction levels. The dealer pool has increased significantly
              with more than double the total number of participating
              dealers in HFY21 v pcp.

                                                                                                               32
FY21 OUTLOOK
FY21 OUTLOOK

                                                                                               Consolidated Outlook

              We forecast moderate Adjusted revenue growth and solid Adjusted EBITDA and Adjusted NPAT growth in FY21, assuming a continuation of
              the current operating environment for the balance of the second half of the year.

              This reflects higher operating costs in the second half of FY21 largely due to increased investment in domestic and international growth
              initiatives and the absence of wage subsidies. We note significant uncertainty remains given the COVID-19 pandemic and make the
              following specific observations:

              carsales Domestic Observations                                                                  carsales International Observations1

              •    Dealer & Private:                                                                          •   Korea:
                        • In January 2021, overall traffic and lead volumes growth                                      • Key operating metrics of inventory, listing volumes and
                           was good on the prior corresponding period (pcp).                                              traffic showed good growth in January 2021 on pcp.
                        • Private listing volumes have recovered in January to pre-                                     • We are planning increased investment in key growth
                           COVID levels.                                                                                  initiatives in H2, particularly the Dealer Direct product
                        • Instant Offer continues to build scale showing very                                             which has strong momentum. This should positively
                           strong growth on pcp in January 2021.                                                          impact revenue and earnings growth beyond this
                        • Consistent with H1, tyresales has continued to operate                                          financial year. In FY21 we expect very good growth in
                           at lower volume levels in January 2021. We expect to                                           revenue and solid growth in EBITDA.
                           deliver similar volumes in H2 FY21 when compared with                              •   Brazil:
                           H1 FY21.                                                                                     • Key operating metrics of traffic and leads showed very
              •    Media and new car market:                                                                              good growth in January 2021 on pcp.
                        • The new car market continues to demonstrate signs of                                          • We expect strong growth in revenue1 and EBITDA1 on
                           improvement as evidenced by new car sales volume                                               pcp in the second half, supported by the resumption of
                           growth in December 2020 and January 2021. This has                                             the regional expansion plan.
                           resulted in some improvement in media revenue run
                           rate against pcp, providing confidence that we can
                           deliver good growth on pcp in the second half.
              •    Domestic Core expenses
                        • Anticipating core expenses to be higher in H2 compared
                           to H1 reflecting investment in domestic growth
                           initiatives as well as the absence of wage subsidies.

1. All financial references in the International Observations section are in local currency.

                                                                                                                                                                                      34
APPENDIX
OVERVIEW OF CARSALES NON-IFRS FINANCIAL INFORMATION

  What is IFRS and non-IFRS financial                        information presented is sourced directly             presentations in order to allow the reader to
  information?                                               from financial information prepared in                clearly reconcile between the IFRS and non-
                                                             accordance with all relevant accounting               IFRS financial information.
  •   IFRS financial information is financial                standards and has been subject to either
      information that is presented in accordance            review or audit by carsales’ external auditors    Why does carsales disclose non-IFRS
      with all relevant accounting standards.                (PwC).                                            financial information in its half year
                                                                                                               and full year results presentations?
  •   Non-IFRS financial information is financial        •   In carsales’ investor presentations the
      information that is presented other than in            company aims to provide equal or greater
                                                             prominence to IFRS financial information.         •   carsales has invested in businesses in
      accordance with all relevant accounting                                                                      Malaysia, Thailand, Indonesia, South Korea,
      standards. For example:                                However, we also present or refer to non-IFRS
                                                             financial information. Please note, all               Mexico, Chile, Brazil and Argentina and has
                                                             information labelled “Reported” in this               become a global portfolio of online
      o Revenue or profit information calculated                                                                   automotive assets. Accordingly carsales
         on a basis other than under accounting              presentation complies with IFRS.
                                                                                                                   management believes that the presentation
         standard definitions or calculated with                                                                   of additional non-IFRS information in its half
         accounting standards and then adjusted          •   Non-IFRS financial information is calculated
                                                             based on statutory IFRS financial information         year and full year results presentations
         e.g. “adjusted”, “underlying” or “look-                                                                   provides readers of these documents with a
         through”.                                           and adjusted to show either a position
                                                             excluding significant items which have been           greater understanding into the way in which
                                                             removed OR presented based on carsales’               management analyses the business as well as
                                                             effective equity ownership interest of an             meaningful insights into the financial
                                                             entity’s underlying revenue, EBITDA or NPAT.          conditions of carsales overall performance.
  What non-IFRS financial information
  does carsales disclose in its half year                •   Any non-IFRS financial information is clearly     •   The Australian Securities and Investment
  and year end results presentations?                        labelled as “underlying”, “Adjusted” or “look-        Commission (“ASIC”) acknowledges the
                                                             through” to differentiate it from reported/IFRS       relevance of non-IFRS financial information in
  •   carsales presents reported financial                   financial information.                                providing “meaningful insight” as long as it
      information for its business segments,                                                                       does not mislead the reader.
      associates and investments where applicable        •   carsales provides reconciliations on the face
      IFRS financial information exists. The financial       of slides, appendices and in footnotes of

                                                                                                                                                                    36
RECONCILIATION OF REPORTED TO ADJUSTED NPAT

                                                                                                            H1 FY201                       H1 FY21
                 $A Millions                                                                      Revenue      EBITDA    NPAT    Revenue      EBITDA    NPAT
                 Reported Financials                                                               213.4         104.5   71.2     198.9         113.8   61.1
                 Dealer Support Package                                                              -             -       -       10.6         10.6     7.4

                 Restructuring and M&A transaction costs                                             -            2.2     2.0       -            1.1     0.8

                 Hedge Close out                                                                     -             -       -        -             -      1.4

                 Option Movement in Fair Value                                                       -             -     (5.2)      -             -       -

                 Loss / (Gain) on disposal of business                                               -             -     (1.1)      -             -       -

                 Fair value revaluation post NCI                                                     -             -     (7.1)      -             -       -

                 Total acquired intangible amortisation                                              -             -      3.6       -             -      3.3
                 Adjusted Financials                                                               213.4         106.7   63.4     209.5         125.5   74.0

1. FY20 Asia segment revenue has been restated to align with carsales’ group accounting policy.

                                                                                                                                                               37
ADJUSTED FINANCIALS

                                                                                                   H1 FY201                             H1 FY21                     Growth %

                 $A Millions                                                     Reported         Adjustments   Adjusted   Reported   Adjustments   Adjusted   Reported   Adjusted

                 Revenue                                                            213.4              -         213.4      198.9        10.6        209.5       (7%)       (2%)

                 Total operating expenses                                           108.9            (2.2)       106.7       85.1        (1.1)        84.0       22%        21%
                 EBITDA                                                             104.5             2.2        106.7      113.8        11.7        125.5       9%         18%

                 EBITDA margin                                                      49.0%                        50.0%      57.2%                    59.9%
                 Depreciation & amortisation                                         17.6            (4.0)        13.6       19.5        (3.9)        15.6      (11%)      (15%)
                 EBIT                                                                86.9             6.3         93.1       94.3        15.6        109.9       9%         18%

                 Net financing cost                                                   2.1             5.2         7.3        9.4         (1.4)        8.0       (360%)     (10%)
                 Profit Before Tax                                                   84.8             1.0         85.9       84.9        17.0        101.9       0%         19%

                 Income Tax Expense                                                  24.8             0.9         25.7       26.0         4.3         30.3       (5%)      (18%)

                 Profits from associates                                              2.4             0.3         2.7        2.4          0.2         2.6        (0%)       (3%)

                 Fair value revaluation                                               9.8            (9.8)         -           -           -            -        n/a        n/a

                 Gain / (Loss) on business disposal                                   1.1            (1.1)         -           -           -            -        n/a        n/a

                 Non-controlling interest (NCI)                                      (2.0)            2.6         0.6        (0.2)         -          (0.2)      89%       139%

                 Net profit after tax (continuing)                                   71.2            (7.8)        63.4       61.1        12.9         74.0      (14%)       17%

1. FY20 Asia segment revenue has been restated to align with carsales’ group accounting policy.

                                                                                                                                                                                     38
CARSALES “LOOK-THROUGH4” P&L ANALYSIS

                                                                           H1 FY201                                                 H1 FY21                                          Growth %
                                                                                               Look-                                                    Look-                                            Look-
                                                                              Look-          Through 4                                Look-           Through 4                          Look-         Through 4
                $A Millions                              Reported                                                 Reported                                              Reported
                                                                           Through 4        (Constant                               Through 4        (Constant                         Through 4      (Constant
                                                                                            currency)                                                currency)                                        currency)
                Adjusted Revenue2
                carsales International
                 Brazil                                Equity Acc'ted          12.3             8.8             Equity Acc'ted          9.7              9.7                n/a           -21%            11%
                 South Korea                                32.4               32.4             31.4                 38.6               38.6             38.6              19%            19%             23%
                 Chile                                      2.6                2.6              2.4                  2.3                2.3              2.3               -12%           -12%             -4%
                 Mexico                                     1.3                1.3              1.1                  0.9                0.9              0.9               -31%           -31%            -18%
                 Argentina                                  0.4                0.4              0.3                  0.2                0.2              0.2               -50%           -50%            -33%
                 Other Asia and NZ                          2.2                2.2              2.2                  2.1                2.1              2.1                -5%            -5%             -5%
                Total International                          38.9              51.2             46.2                  44.1             53.8              53.8              13%             5%             17%

                carsales Domestic
                  Domestic Core                             150.3             150.3             150.3                150.9             150.9             150.9              0%              0%             0%
                  Domestic Investments 3                     24.2              19.2             19.2                  14.5              11.8             11.8              -40%           -39%            -39%
                Total Domestic                              174.5             169.5             169.5                165.4             162.7             162.7              -5%            -4%            -4%

                Adjusted Revenue2                           213.4             220.7             215.7                209.5             216.5             216.5             (2%)            (2%)            0%

                Adjusted EBITDA2
                carsales International
                 Brazil                                Equity Acc'ted           5.5              3.8            Equity Acc'ted          4.6               4.6              n/a            -16%            21%
                 South Korea                                16.3               16.3             15.8                 20.6              20.6              20.6              26%            26%             30%
                 Chile                                       0.9                0.9              0.8                  1.0               1.0               1.0              11%            11%             25%
                 Mexico                                     (2.7)              (2.7)            (2.4)                (0.6)             (0.6)             (0.6)             78%            78%             75%
                 Argentina                                  (0.8)              (0.8)            (0.6)                (0.4)             (0.4)             (0.4)             50%            50%             33%
                 Other Asia and NZ                           1.2                1.2              1.2                  1.1               1.1               1.1              -8%             -8%            -8%
                Total International                          14.9              20.4             18.6                  21.7             26.3              26.3              46%             29%            41%
                carsales Domestic
                  Domestic Core                              91.9              91.9             91.9                 101.1             101.1             101.1             10%             10%            10%
                  Domestic Investments 3                     (0.1)             (1.3)            (1.3)                  2.7              1.9               1.9             2800%           246%           246%
                Total Domestic                               91.8              90.6             90.6                 103.8             103.0             103.0             13%             14%            14%

                Adjusted EBITDA2                            106.7             110.9             109.2                125.5             129.3             129.3             18%             17%            18%

1 FY20 South Korea revenue has been restated to align with carsales’ group accounting policy.
2 Adjusted Revenue and Adjusted EBITDA stated above is on a continuing basis, excludes certain non-recurring or non-cash items. see slides 37-38 for a reconciliation of Adjusted EBITDA to Reported EBITDA
3 Domestic Investments comprises RedBook Inspect, Appraisal solutions, Ratesetter and tyresales
4. Look-Through Methodology - carsales “look-through” methodology: For equity accounted associates and consolidated subsidiaries, add the total revenue or EBITDA for the period of ownership within the reporting period
   multiplied by the % ownership over the period. Some “look-through” numbers involve the disclosure of non IFRS information - Refer to carsales’ Disclosure of Non IFRS information on slide 36 for further details.
                                                                                                                                                                                                                            39
40
You can also read