Trust, Values, Power Transition and the Future of the EU
←
→
Page content transcription
If your browser does not render page correctly, please read the page content below
Trust, Values, Power Transition and the Future of the EU

 Birol A Yeşilada
 Mark O. Hatfield School of Government
 Portland State University & TransResearch Consortium
 World Values Survey

 Jacek Kugler
 Claremont Graduate University & TransResearch Consortium

 Osman Göktuğ Tanrıkulu
 Mark Hatfield School of Government
 Portland State University & TransResearch Consortium

Paper prepared for presentation at the 2017 Annual conference of the European Union Studies Association in
Miami, FL., May 4-7. This paper is part of a book project with Gaspare Genna, Global Power Transition and the
Future of the European Union (Routledge: forthcoming August 2017).

 1
Introduction

 The challenges facing the EU require political leaders and the European citizenry to

follow through on the commitment made in the Solemn Declaration of European Union to

produce “an ever closer union among the peoples and Member States.”1 On the economic

front, a deepening of integration will enhance the advantages of the EU’s internal market (yet to

be completed) and protect its members against external and domestic shocks by creating

symmetry across the regions. Politically, a deeper union will legitimize governance of a more

united EU and bring its institutions closer to the people. Such deepening of political integration

will also provide protection against nationalistic outlooks that favor a dissolution of the Union

which became a potential reality with Britain voting to leave the EU. At the same time, political

union will go a long way in legitimizing the EU as a true global actor.

 One could argue that perhaps creating the Economic and Monetary Union prior to

completion of the Common Market (Single Market) was premature but external systemic

challenges pushed European leaders to make that decision. Subsequent monetary union

among some of the states further created division within the union and created a two-track

Europe. When we add to this the very slow pace of political union, the future of regional

integration looks quite shaky. As some economists would say, “monetary union without a

political union would not work.”2 It only takes one major financial crisis to bring that monetary

union down like a house of cards. The EU is currently working hard to ensure that will not

happen by pushing ahead with new formulas for fiscal coordination that blends its

supranational and intergovernmental decision-making mechanisms. Yet, ordinary citizens rarely

possess ample information on the EU, its institutions, or its policies. In other words, while the

 2
EU knows a lot about its citizens through extensive surveys, the same cannot be said the other

way around.

 In light of these challenges, this paper analyzes the determinants of European

integration, from 1980 to the present, to determine which factors are important at which stage

of integration. We also extended our analysis timeline to 2021 in an effort to determine what

factors are needed, and to what degree, for the EU to achieve further integration and perhaps

full political union.

Power Transition Approach to Regional Integration

 There are several theories of regional integration that range from functionalism and

neofunctionalism to neoliberal institutionalism.3 In this paper we break tradition with the EU

integration theorists and adopt a revised version of Power Transition theory that captures the

entire continuum of interstate interaction from full integration to total war.

 Power transition theory provides a systematic perspective to analyze conflict and

cooperation concurrently. The theory is based on A. F. K. Organski’s pioneering work that

describes a hierarchical global system.4 The theory has traditionally focused on the initiation of

war because of the severe consequences of major wars, and the implications for integration

were not the main focus of that work.5 However, today the likelihood of major war has receded

while the process of integration expands worldwide. Unlike realism that covers confrontation or

neofunctionalism and supranationalism that covers integration, power transition provides a

perspective on both processes within one general perspective.

 3
We begin by providing an overview of the theory, as originally formulated. We then

extend it to an explanation of integration with implications for the EU. Gaspare, Genna and

Brian Efird first extended the theory into this less explored area of cooperation 6 and other work

on integration shows that the same principles that account for conflict can be generalized to

apply to cooperation among allies and integration.7 Past research gives us a good starting

theoretical structure to account for the ongoing dynamic changes experienced by the EU and

forecast their longer-term implications. In doing so, we will bring in two major clarifications to

the theory: how trust binds states to the status quo and the driving force behind status quo

satisfaction – the convergence of social values. Critical components of power transition theory

are hierarchy (determined by power), satisfaction of stake holders with the status quo, and how

they determine conflict or cooperation between them.8 While the original theory postulated by

Organski focused on global confrontational interactions, Douglas Lemke in his careful empirical

analysis shows that the same principles that hold at the global level define interactions within

regional hierarchies determined by relative power of states; and Michelle Benson and Jacek

Kugler further show that similar principles apply to civil war.9 For power transition theory,

power is viewed as the capacity of one nation to advance policy goals by altering the policy of

another through persuasion or coercion. While the concept is transparent, its measurement is

not simple. The perspective stresses economic, demographic, and political elements. The

original conception focused on the intersection between demography and economics and

politics was added later.

 According to Power Transition theory, distributions of power set the preconditions of

war and peace in the international system. The underlying assumption of global and regional

 4
hierarchies rejects the neorealist notion of anarchy. Instead, all actions are conditioned by the

distribution of power, the change in that distribution, and the relative commitment to the status

quo. Power is the ability to compel opponents to conform to the prevailing status quo. Nations

with high capabilities have the ability to persuade or impose their goals on less endowed

entities. Unlike an idealized democratic domestic political system, the international

environment is populated by the great powers with massive capabilities that they can transfer

into a greater say; middle range powers that have less but still consequential influence; and the

majority of nations whose capabilities have limited external impact. Finally, the critical

triggering mechanism differentiating periods of war and peace is captured by commitment to

the status quo. The status quo is defined as the rules and norms of the international/regional

system. When the challenger state reaches parity with the hegemon, their relative satisfaction

with the status quo would be a determining factor on whether or not the two sides will move

towards confrontation or cooperation. Integration-Conflict continuum then is a function of

hierarchy (power) and satisfaction with the status quo which we measure by two indicators

trust and values convergence (explained below).

 Figure 1 illustrates how our pieces fit together. Under massive power asymmetry a

preponderant can maintain or impose peace. Although limited wars such as Korea 1950 or

terrorist attacks by groups like Al Qaeda can take place as the dissatisfied opponents acquire

sufficient capabilities they produce massive losses for the weak participants and pose a very low

threat to the stability of the international system or its rules. At parity, conflicts that challenge a

state’s survival take place –as illustrated by the Austro-Prussia war – that become total severe

conflicts – like World War I – as status quo satisfaction decreases, as does trust. Cooperation at

 5
parity takes place when the overtaking challenger is reasonably satisfied with the existing status

quo and has some trust for the dominant state. The condition produces alliances as illustrated

by the US-British relationship. Critical to our work, regional integration is where the competing

sides are highly satisfied, are mutually trusting, and disregard parity as a precondition for war.

Under these conditions, like the ones characterized by German and French leadership, with the

support of the US, EU integration took place. Since 1945, the world should have noticed that

Germany overtook France and Britain, yet without the conflicts that characterized these states

for generations. Clearly, the satisfactory integration agreements among European states had

much to do with the persistence of peace and the evolution of a supranational entity.

Figure 1 Power Transition Relation to Conflict & Integration:

 Figure 1 also illustrates, normal, competitive relations take place among states. This

condition represents the majority of international interactions where nations seek to preserve

 6
their identity and interests but are open to trade with other nations. In this area, states are

somewhat trusting, satisfied with status quo, and under power asymmetry. Competitive states

follow international rules and contracts but do not necessarily establish institutional structures

to secure them. In this idealized competitive environment, nations depend on market forces to

determine the quality and quantity of economic and social transactions within the confines of

loosely defined international rules and non-binding international laws. Before 1900, the US was

a state that fits this description – avoiding rigid alliances and pre-commitments – but still willing

to support freedom of the seas by forcefully opposing piracy when it interfered with freedom of

navigation and commerce.

 Normal interstate interactions also take place when the key actors in the hierarchy

support the existing status quo and do not increase their levels of trust. Reagan’s famous

restatement of a Russian old proverb “trust but verify” suggests animosity but no expectation

that commitments made will necessarily be complied with. For this reason, when satisfaction

drops, completive interactions become confrontational and severe wars can be waged among

contenders that reach parity since each expects to change the rules in their favor following the

war. This aspect of the original theory shows that global and regional severe wars are waged at

parity and are initiated by the dissatisfied challenger seeking to alter the status quo. 10 This book

is concerned with the far less visited deductions that anticipates the possibility of free trade

agreements, integration, and possibly federation/political union between sovereign states.

 Figure 2 is one cross section of Figure 1 that illustrates how satisfaction conditions

regional relationships. The top section provides the traditional power transition explanation: as

satisfaction moves from moderate to low levels, competitive relations move to confrontational

 7
ones. Note that there is a strong arc upwards after a seemingly plateaued competitive set of

relations. In other words, a state would need to be extremely dissatisfied before choosing

confrontation, which can lead to war.

Figure 2. Process of Confrontational and Cooperative Integration

 The bottom section of Figure 2 illustrates the stepwise movement towards deeper

cooperation as satisfaction improves. While at a moderate state of satisfaction, states choose

preferential trade agreements (PTAs) because such agreements liberalize some trade while

protecting some economic sectors. The condition is still competitive since states have not fully

decided that trade will result in mutual benefit. A free trade agreement (FTA) provides a special

 8
set of norms and rules relating to trade and financial transactions across societies. Based on

arguments regarding the effectiveness of free trade and the benefits of economies of scale

connected to large markets, trading nations can choose to join agreements that regulate their

trade. Such agreements seek to attain a stable joint optimal outcome that are superior to gains

nations can attain individually (Pareto optimal vs. Nash equilibrium).11 A number of bilateral

trade agreements and some multilateral trade agreements (i.e. NAFTA; WTO) follow this

pattern. Trade liberalization agreements restrict tariffs, limit domestic subsidies and control

dumping to gain market size. Such agreements restrict national sovereignty minimally and are

frequently overridden when domestic demands surface.

 As we move towards higher levels of satisfaction, we start to see integration developing.

Integration is a process where nations agree to not only liberalize trade, but also encourage

financial transactions and joint financial ventures, harmonize roads, power grids and

transportation systems connecting communities across national borders, reduce border

restrictions eventually allowing labor mobility that recognizes levels of human capital achieved

and adopt a common currency. Experience has shown that this process usually starts with

economic coordination at the lowest possible level such as preferential trade agreement, then

moves to infrastructural synchronization, removal of border constrains on trade and labor

culminating in monetary policy harmonization. Further integration includes securing a common

border and creating a common military unit led not by national but by union representatives.

Beyond this point a federation emerges. These are the steps categorized by forming a customs

union, common market, economic union, and then a political union. Each step also requires

satisfaction among the member states that the institutions created by the integration agency

 9
will enhance the common good. We now turn to the two components trust and value

convergence that reflect commitment to the status quo. At present, the EU is distinct form

other regional integrations because in this region – regardless of power overtaking – the

commitment to the status quo exceeds levels found in any other region. The free movement of

money, labor, and trade is permitted by most members and security arrangements are shared.

EU policy encourages the maximization of opportunity to exploit the economic theories of

liberal exchange and mobility. Figure 3 shows different membership levels and commitments of

EU countries. The establishment of a Schengen region is an important step in establishing a

deeper level of regional integration. States that accept the Schengen norms, trade agreements,

labor mobility, and adopt the euro as their currency have crossed the border between nation

state sovereignty and a supranational community. While not a federation or a full political union

– Schengen member states have adopted rules and norms established by monetary transactions

and removed borders so individuals can travel freely and seek employment. This arrangement

approximates a federated community. It is therefore unsurprising that the move towards

monetary integration, which moves away from the common market category that

accommodates labor mobility, is the point at which member states begin to fear the process of

integration because such a deepening may lead to a confederation and eventually a federation.

 Let us now move to the connection between power dynamics and changes in the status

quo to explain the likelihoods of conflict and cooperation. According to Power Transition

theory, distributions of power set the preconditions of war and peace in the international

system. The underlying assumption of global and regional hierarchies rejects the neorealist

notion of anarchy. Instead, all actions are conditioned by the distribution of power, the change

 10
in that distribution, and the relative commitment to the status quo. Power is the ability to

compel opponents to conform to the prevailing status quo. Nations with high capabilities have

the ability to persuade or impose their goals on less endowed entities. Unlike an idealized

democratic domestic political system, the international environment is populated by the great

powers with massive capabilities that they can transfer into a greater say; middle range powers

that have less but still consequential influence; and the majority of nations whose capabilities

have limited external impact. Finally, the critical triggering mechanism differentiating periods of

war and peace is captured by commitment to the status quo. Again, the status quo is defined as

the rules and norms of the international/regional system. As will be explained later, we

postulate two indicators of satisfaction based on citizens’ trust towards the EU, as our unit of

analysis is European integration, and convergence of values between EU citizens across member

states. But first, we will present an outline of the general argument for conditions of

cooperation (i.e. integration) and conflict which is the key concept found in power transition.

 11
Figure 3. Degrees of Integration Between EU Member States

source: Birol Yesilada, et. al. (2017 forthcoming), Global Power Transition and the Future of the European Union.

Peoples’ Trust in the EU

 One crucial element of satisfaction with the status quo is trust. For sure, at each step in

an integration process participating nations lose some sovereignty in exchange for gains in

security and economic prospects. The cautious confrontational, “trust and verify” is slowly

replaced by increased trust in the institutions created, meaning that each advance in integration

transfers regulatory rights that places some aspect of national independence at risk. During the

integration process, nations cannot continue to maximize net gains. Integration does not

proceed by allocating equal shares to all. At every step, there are some winners and some losers

 12
even though the overall pie may be growing. Participants in the integration process must trust

that their partners will not take advantage and will compensate unexpected losses when they

take place.

 Trust acts like a gravity well. It reinforces status quo satisfaction and eases states into

each stage of integration like a ball rolling downhill. Trust among partners develops when they

mutually believe they are being treated fairly, meaning that outcomes are not due to biases but

due to capabilities.12 Trust is also important in explaining European integration because the

varying levels of economic development can often lead to concerns about free-ridership.13

Without trust, integration is constrained and therefore becomes an uphill battle, requiring

further reliance on power asymmetry to provide negative incentives (i.e. force) under low status

quo satisfaction, or positive incentives under higher levels of status quo satisfaction. Integration

relies on the creation of a supranational entity so that the process evolves peacefully and

cooperatively. Figure 4 shows average trust level of member states’ citizen towards EU

institutions.

 13
Figure 4. Trust in the EU

Note: Excluded nations are: Portugal, Czech Republic, Bulgaria, Croatia, Cyprus, Denmark, Estonia, Finland,
Hungary, Ireland, Latvia, Lithuania, Luxembourg, Malta, Slovakia, and Slovenia.

Values Convergence

 We propose that the convergence of social values between member states’ as an

additional requirement for satisfaction with the status quo. Value convergence is a crucial factor

behind preparing the groundwork for the emergence and growth in trust that reinforces the

status quo.14 In general, linking values convergence and regional integration has not been

studied.15 Our argument is rooted in how human development (HD) theory addresses the way

cultures evolve over time and the implications of cultural development for political

development. These are complex issues that have been central to a wide range of social science

disciplines, from economics, politics, and sociology to cultural anthropology. How and why

 14
human values change and how these changes affect the way in which societies govern

themselves has kept scholars busy for some time. In the more contemporary era, since the late

eighteenth century, social scientists have identified causal linkages between economic

modernization, cultural change, and political development.16 Ronald Inglehart and Christian

Welzel provide some direction through their two compound variables from the World Values

Survey analysis that captures more than 78 percent of cross-national variance in social change

across the world.17

 To reflect value convergence, they measure individual’s relative religiosity and social

values along two dimensions. The first dimension is religious (traditional)-secular (autonomy)

values, which reflect the contrast between societies over religion and religiosity. The more

traditional societies place greater emphasis on religious principles, structures, and institutions

while more secular-rational ones do not. Inglehart and Welzel also found that a wide range of

values is associated with this dimension. For example, societies near the traditional pole

emphasize the importance of parent-child ties and deference to authority, along with absolute

standards and traditional family values, and reject divorce, abortion, euthanasia, and suicide.

They tend to have high levels of religious values and national pride coupled with a nationalistic

outlook. Societies with secular-rational values have the opposite preferences in all of these

areas.

 The second key dimension of cross-cultural variation is linked with the transition from

industrial society to postindustrial societies – which brings a polarization between materialist

(survival values associated with industrialization phase of development) and postmaterialist

(self-expression/postindustrial) values.18 It corresponds to the transition to the post-industrial

 15
phase of economic development and an advanced welfare system which provides many

individuals with an overwhelming sense of existential security.19 Factor analysis of the mean

national scores reveals that individualism, autonomy, and self-expression (measures of the

postmodernist value system) all tap a single underlying dimension that accounts for 91 percent

of cross-national variance.20 The basic argument maintains that the unprecedented

accumulation of wealth in advanced societies during a prior generation results in a greater

portion of the population that takes basic survival for granted. These individuals shift their

priorities from an overwhelming emphasis on economic and physical security toward an

increasing emphasis on subjective well-being, self-expression, and quality of life. It corresponds

to the transition to the postindustrial phase of economic development and an advanced welfare

system, which provide many individuals with an overwhelming sense of existential security.21

Birol Yesilada et. al. examined values convergence along the above two dimensions of social

values and measured average factor loading for each year of the European Values Survey and

World Values Survey.22 Figure 5 provides a values map for EU countries. As the figure shows,

the EU countries converge in the postmaterialist and secular quadrant of the values map. The

direction for Eastern enlargement countries show predominantly materialist values but with

most recent observations indicating significant move in the postmaterialist direction.

 16
Figure 5. EU Values Map

source: calculated from the World Values Survey (1981-2013) data.

 The two value dimensions are critical for deep cooperation. Imagine two societies, one

more materialist and traditional and the other more postmaterialist and secular. If the two wish

to develop deeper economic ties, they will be faced with a large set of problems and issues that

will be difficult to resolve due to their preferences. Take our previous example of environmental

regulations. Such regulations add costs to production. If one society adopts such regulations

and the other does not, then the adopter will not be able to compete with the other since

products from the adopter will be more expensive. The postmaterialist society will insist on

such regulations because they believe the value a cleaner environment over economic gain. The

 17
materialist society will have the opposite view. In the end, they may agree on a PTA, but a FTA or

beyond will be unlikely. Another example could be laws associated with marriage/domestic

partnerships. The traditional society would not allow laws that guarantee rights to homosexual

partners or unmarried heterosexual partners due to religious reasons, while the secular society

would adopt such laws. If the two states develop a common market, what will happen to the

labor mobility rights of those individuals that are in such relationships? Without congruence,

such people will be denied such rights. In sum, value convergence allows for easier agreements

and less issue areas requiring protracted negotiations

Modeling

 We modified Power Transition Theory for analyzing determinants of integration. The

theory predicts integration to develop when there is power asymmetry among regional partners

that also possess satisfaction with the status quo. We modified the theory by specifying the

heart of the satisfaction variable, namely value convergence, and introducing trust as an

important factor. The remainder of this chapter will describe the variable operationalization and

test the hypotheses. Afterwards, we will use our model outcomes to determine what amounts

of power asymmetry, value convergence, and trust is needed for further integration.

 For our dependent variable, regional integration, we use the Integration Achievement

Score (IAS).23 IAS provides the measure of deepening of integration in the EU and the data of

2016 are taken as constant until 2021. Given Brexit, we also assume that the UK leaves the EU

in 2019 for estimation purposes. The IAS codes the level of integration in a given year using six

categories of institutionalized cooperation among two or more countries using information

 18
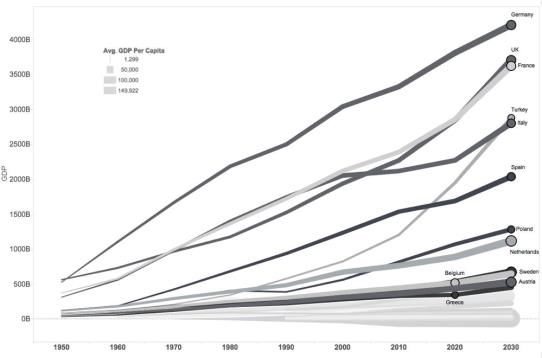
found in the implemented treaties. Coding is sensitive to the fact that obligations often take

time to implement. Therefore, coders conduct a yearly monitoring of actual implementation.

The categories include liberalization of trade in goods and services, degree of capital mobility,

degree of labor mobility, level of supranational institution importance, degree of monetary

policy coordination, and degree of fiscal policy coordination. Each category has a value of 0

(low) through 5 (high) and is coded using a Guttman scale (see Appendix A for explanation of

variable measurement). When we look at the level of integration in the EU, it is clear that this is

a two-track process. Those members that are in the Eurozone are more integrated than others

who are only in the economic union.

 For the operationalization of the independent variables, we use hierarchy, values

convergence, and trust in the EU. As previously discussed, for power transition theory,

hierarchy, which is based on relative power of each state to all other states, is an important

variable for system stability and promoting cooperation and integration. To approximate the

degree of hierarchy within the EU, we construct the following simple measure that scores the

relative impact of the dominant nation (Germany) on the largest members of the integrated EU

community:

 (1) ℎ = ′

 As Figures 6a&b indicate, Germany has been the dominant nation in Europe but its

status has been on a steady decline over time as other members of the EU have increased their

relative power. However, one of the bigger factors in the decline of German power asymmetry is

 19
the expansion of membership. The grand eastern enlargement in 2004 added eight new

continental members of various sizes and two small Mediterranean islands. With Brexit, we

project a slight increase in Germany’s hierarchy once again. The EU demonstrates that power

preponderance is useful but not a precondition for stability – it is merely one condition for

peace. Satisfied nations whose values are converging can maintain a lasting and profitable

peace.

Figure 6a: EU hierarchy with German leadership

Unlabeled nations are: Portugal, Czech Republic, Bulgaria, Croatia, Cyprus, Denmark, Estonia, Finland, Hungary,
Ireland, Latvia, Lithuania, Luxembourg, Malta, Slovakia, and Slovenia

And when we calibrate dyadic relations of power against that of Germany we get the following

distribution for German dominance in the EU.

 20
Figure 6.b. Germany’s Position in the EU Hierarchy against all other Members

 The second independent variable for integration is the convergence of social values. As

previously explained, we use this variable as an indicator of satisfaction with the status quo.

Given the role of Germany in the EU hierarchy, we measure convergence towards its values. As

the largest economy, Germany has the ability to use its economic influence to direct the process

and progress of integration. However, this capacity will be limited by how far its values are from

the other member states. Therefore, we measure value convergence by calculating the distance

between Germany’s values from the other EU member states based on I-W values indices.

Recall that the I-W indices capture two value dimensions: materialist-postmaterialist values on

one axis and traditional-secular on the other.

 All survey data used for calculating value convergence come from various years of World

Values Surveys (WVS). For 2017, we use estimates since the seventh wave of the WVS has not

been completed. To do this, we used moving averages for previous survey years to project

values for materialist-postmaterialist and tradition-secular values for each EU member state in

 21
2017. We then took 2017-2021 as constant to estimate the values data to match estimates for

hierarchy and trust in the EU.

 The value convergence variable is calculated by using a Euclidean distance formula and

measures the distance of post-materialist-materialist and secular-traditional values between

two countries:

(2) d = (Xa - Xb )2 + (Ya -Yb )2

 where; X represents the country’s value on the secular-traditional axis and Y represents

the country’s value on the post-materialist-materialist axis.

 The statistical model that is utilized in the analyses focuses on value convergence towards

Germany. This variable centers on the value distances of all the EU countries towards Germany.

The value convergence variable is abbreviated as ‘VcGMY’ in the formula(s) and is calculated

using a modified version of equation 2:

(3) , = √( − )2 + ( − )2

 Values generated by equation 3 are high when values are divergent. Since the variable

needs to measure convergence, and to better interpret the results of our statistical analysis, we

need to transform the values by multiplying each by -1. The higher, transformed, values can now

be interpreted as having higher convergence. Theoretically, when countries are closer to each

 22
other in terms of values (convergence), the level of cooperation or integration is expected to

increase.

 Value convergence with the regional leader and a select sample of member states is

depicted in Figure 7 using pre-transformed values: the larger the number, the less observed

value convergence. According to this figure, among the major EU countries, France is the closest

country to the leader in terms of values. After France, Spain and Italy have near values with

Germany. Compared to these three, the UK and Poland fall farther away from the leader.

Overtime, we are witnessing greater convergence among the larger EU member states.

Figure 7: Values Convergence with the Regional Leader (Germany)

 The third independent is the amount of trust citizens of member states have toward the

European Union. Like value convergence, this variable also helps us gauge the amount of

member state satisfaction with status quo. Data come from various years of the Eurobarometer

surveys. The Eurobarometer survey responses are a rich source of information regarding EU

 23
citizen views on European integration because of the frequency of repeated questions. By

aggregating the respondents’ answers to the national level, we are able follow trends in our

timeframe.

 Unfortunately, the survey series does not ask the ideal question, “How much trust do

you have in the EU?” for the entire time series of our analysis. As a result, we selected questions

that can best approximate this question and captures the latent value of trust in the EU. There

are questions regarding trust in various EU institutions. We believe that the institution that is at

the epicenter of European integration in the minds of citizens is the European Commission. It

drives not only the enforcement of EU laws and regulations – thereby being the face of Europe –

it also introduces the legislation for European Council and Parliament deliberations. The

question that asks how much the respondent trusts the European Commission fills in the 2002-

2016 data points.

 The earlier data points (1973-2001) used another question, which we believe also

approximates trust in the EU. The survey series asks the respondent if membership in the EU (or

the European Community if it is an early survey) is a good thing, a bad thing, or neither good

nor bad. This question has been used in various analyses that attempt to explain general

support for European integration. 24Public support for integration is highly correlated with trust

because favorable support of integration is generally perceived when trust is present.25

 The only annual data points that are missing are country values for 1998. For this year,

we linearly interpolate these values. For the countries that are extrapolated, these two

measures correlate at 67% for the overlapping period. Adjusting commitment to the status quo

by levels of trust to anticipate the degree of support for integration is a path we wish to follow

 24
to clarify intra-EU relations. For operationalization of trust variable in our model, we calculate

the variable, Trust towards the European Commission (TrustEC), by a trend function which

utilizes the least squares method to calculate the line of best fit for a supplied set of y- and x-

values. We further estimated TrustEC for 2017-2021 assuming high trust, a normal moving

average, and low trust. Figure 8 provides trust levels for Germany and EU average.

Figure 8: German & EU Average Trust to the European Commission

It is apparent that the level of trust in the EU fell significantly during and since the last financial

crisis and recovered to its pre-crisis level in 2015. However, the overall trend is a steady decline

since 2003. This raises another concern for EU integration, that of legitimacy. Several factors can

be identified that result in low democratic citizen trust: problems of legitimacy, recession,

mistrust, anti-EU propaganda of nationalist political parties, and negative attitudes towards

migration.

Model Estimate – With Trust Projected at Current Trend Levels

 25
This Model tests the relationship between integration (IAS dependent variable) and

value convergence on Germany, trust towards the EU, and regional hierarchy. Table 1 presents

the results of the multinomial regression. We estimated projections for each variable until 2021

using forecasts for GDP, hierarchy, and trust. For trust in the EU we estimated post-2016 data

points based on the moving average of time series data from 2003-2016 for each member state.

The model gives a Cox and Snell pseudo-R2 of 58.5 and Negelkere pseudo-R2 of 64.1 percent

respectively and the Likelihood Ratio Tests are significant at 0.000 for all variables.

 ( ): 1980−2021 = + _ +

Table 1 Parameter Estimates

 Integration Independent B Std. Wald Sig. Exp(B) 95% Confidence
 Achievement Variables Error Interval for
 Score (IAS)a Exp(B)
 1.16 Intercept -21.77 11.57 3.54 0.060
 (Free Trade Value 0.018 0.019 0.83 0.361 1.02 0.980-1.06
 Area) Convergence
 Normal Trust -0.311 0.178 3.06 0.080 0.733 0.517-1.04
 Hierarchy 1.147 0.431 7.07 0.008 3.15 1.35-7.33
 2.67 (Customs Intercept -58.37 10.58 30.43 0.000
 Union) Value 0.005 0.010 0.202 0.653 1.01 0.99-1.03
 Convergence
 Normal Trust 0.177 0.038 22.08 0.000 1.19 1.101-1.29
 Hierarchy 1.758 0.370 22.59 0.000 5.80 2.81-11.97
 3.17 Intercept -15.04 8.68 3.00 0.083
 (Common Value 0.015 0.007 4.90 0.027 1.02 1.00-1.03
 Market) Convergence
 Normal Trust 0.049 0.024 4.21 0.040 1.05 1.00-1.10
 Hierarchy 0.713 0.340 4.41 0.036 2.04 1.04-3.97
 3.50 Intercept -27.19 8.97 9.18 0.002
 (Economic Value 0.019 0.008 5.71 0.017 1.02 1.00-1.04
 Union) Convergence
 Normal Trust 0.105 0.031 11.40 0.001 1.11 1.05-1.18
 Hierarchy 0.983 0.345 8.11 0.004 2.67 1.36-5.26

 26
3.83 Intercept -6.14 8.69 0.499 0.480
 (EMU) Value 0.033 0.007 21.03 0.000 1.03 1.01-1.05
 Convergence
 Normal Trust 0.039 0.024 2.73 0.099 1.04 0.993-1.09
 Hierarchy 0.480 0.340 1.99 0.158 1.62 0.83-3.15
aThe IAS reference category is 0.00

Classification of each IAS category (denoted by the IAS number) is an approximation of
corresponding level of regional integration.

 These results show that at the earlier stage of integration, the only variable that is

significant is German leadership (hierarchy). This is consistent with the power transition

argument that a leader (regional or global) must be present to promote cooperation between

the participating states. Hierarchy continues to be a significant factor until the deepening of

integration reaches the level of EMU. At that point (IAS=3.83), which is deepest level of

integration attained by some of the EU members thus far, hierarchy loses its effect on

integration indicating that it is now more important for the leader and other member states to

project a collective effort to push for deeper integration (political union).

 Convergence of values with Germany become significant around midlevel integration,

the customs union, and continues to be an important factor for deepening of integration. This is

an important result since it suggests the need of value convergence to the regional leader as

integration deepens over time.

 Finally, trust in the EU becomes crucial as soon as integration moves from early stage of

trade agreement into the customs union. However, given the current steady decline in citizens’

trust in the EU, the last stages of integration, EMU and beyond, do not show this variable being

very significant (sig=0.099). In other words, falling trust levels are not helpful for predicting the

deepening of integration.

 27
Estimating Further Integration

 The pervious section assumed stable or deepening integration. The question that

remains unanswered is: what are the prospects for the member states to deepen the

integration? By utilizing the results obtained in the multinomial regression model in the

previous section, we can estimate the likelihood of further integration. Since it is difficult to

forecast integration through the use of the multinomial model, we construct an Integration

Factors Index (IFI), which provides a benchmark for furthering of integration (see Appendix B for

details). The IFI reflects the average levels of value convergence, trust, and hierarchy at every

stage of integration.26

Table 2: 2019 – 2021 Impact of Brexit with Values, Trust Scenarios and Hierarchy

 Integration Achievement Integration
 Independent Variables N* Mean
 Score (IAS) Factors Index
Country: UK
UK’s Integration Level after Brexit Value Convergence 3 1.3086252
(Customs Union) Hierarchy 3 0.2947608
 Low Trust 3 0.1461217 0.03
 Normal Trust 3 0.1826510 0.04
 High Trust 3 0.2191803 0.05

Countries: Poland, Sweden, Romania, the Czech Rep., Hungary, Denmark, Bulgaria, and Croatia
3.50 Value Convergence 24 1.4995956
(Economic Union) Hierarchy 24 0.2947608
 Low Trust 24 0.3335608 0.07
 Normal Trust 24 0.4165723 0.08
 High Trust 24 0.4995837 0.10

Countries: France, Spain, Italy, Netherlands, Belgium, Austria, Greece, Portugal, Finland, Ireland, Slovakia, Slovenia,
Latvia, Lithuania, Luxemburg, Estonia, Cyprus, and Malta
3.83 Value Convergence 54 1.0267418

 28
(Eurozone + partial financial integration) Hierarchy 5 0.2947
 4 608
 Low Trust 5 0.3135
 0.09
 4 296
 Normal Trust 5 0.3916
 0.11
 4 334
 High Trust 5 0.4697
 0.14
 4 372

 *Country-year

 Table 2 presents the IFI estimates and mean compositions for the time period between

2019 and 2021. As in our prior analysis, we assume that the UK is going to leave the EU in 2019.

IFI values above 0.10 indicate movement towards further integration; 0.09- 0.06 suggest

stability current levels; 0.05 and below suggest lower levels of integration. The estimates

provide important but rather complex results. We begin from the first section where we hold

the integration achievement score (IAS) to the level of a customs union. Even at this low level of

integration, the UK will seek further separation from the EU as indicated by the low IFI values.

This is reinforced at all three trust scenarios – low, normal and high. Therefore, the UK is

expected to seek a hard exit and continue to distance itself from the EU.

 We then set the IAS value to the level of the economic union (3.50) to see how the

members listed are likely to press for further integration at varying levels of trust. At low or

normal trust levels, members will likely stay at their current levels of integration. If trust

increases, they may take steps towards further integration. The incentive to do so, however, is

not high since the IFI values of 0.10 is a weak indicator of further integration. The last section of

Table 2 increases the IAS to the EMU level (3.87). States that have low trust are likely to resist

 29
major increases in integration (i.e. fiscal union). However, if trust increases to normal or high

levels, integration is likely to increase swiftly.

Conclusions

 Findings of these models are quite telling. For the EU to move beyond its current

challenges and achieve stable and successful fiscal and political union, trust in EU must improve

among the citizens. Convergence of values among Europeans also shows that there are indeed

emergent European values and that convergence on these value goes a long way in promoting

the deepening of integration in the EU. Finally, hierarchy is important in the early stages of

integration as a leader is essential in providing the guidance and public goods for pulling

everyone together. However, as power asymmetry declines by either bringing in new members

and/or improvements in the member states’ economies, hierarchy and the ability of the

regional leader to provide resources for public goods decreases. From here on, hierarchy stops

being a significant factor for the deepening of integration. The regional leader is needed for the

early institutional construction needed to establish the framework of future integration. As

integration shifts to greater political cohesion, convergence of values and trust are more

necessary for further development of common policies and the supranational quality of

institutions.

 Our findings also indicate that further divergence of a two speed Europe is likely (Table

2). The EU will be stable but will only inch forward to further integration if trust in the EU

increases. Unlike current analysists that predict other countries to follow Brexit’s example, we

predict no country currently in the Economic Union or the Eurozone would leave the EU

 30
anytime soon. In sum, the EU is fairly stable. Finally, if we consider prior expectations derived

from a British lack of trust in the EU and its movement away from value convergence with the

core EU nations, a comparison of the results in Table 2 to similar assessments of the EU’s

probability of deepening of integration without the UK, we find that integration will increase

after Brexit. Furthermore, Brexit would increase Germany’s power asymmetry in the European

hierarchy and improve values converge among the remaining leading EU countries. This leads to

improved prospects for further integration rise concurrently.

Appendix A

A. Integration Achievement Score (coding system)

1. Trade in Goods and Services
0 = No agreements made to lower tariffs and non-tariff barriers
1 = Preferential Tariff Agreement
2 = Partial Free Trade Area
3 = Full Free Trade Area
4 = Customs Union (Common External Tariffs)
5 = No barriers among member countries

2. Degree of Capital Mobility
0 = No agreements made to promote capital mobility
1 = Foreign Direct Investment allowed in limited form
2 = Capital withdrawal allowed
3 = Full access for foreign investment and capital withdrawal, except for national government
procurement
4 = Full capital mobility expect for large scale mergers and acquisitions
5 = Full capital mobility without restriction

3. Degree of Labor Mobility
0 = No agreements made to promote labor mobility
1 = Right of movement granted for select professions
2 = Full right of movement
3 = Transferability of professional qualifications granted
4 = Transferability of pensions and other retirement devices
5 = Full freedom of movement

 31
4. Level of Supranational Institution Importance
0 = No supranational institutions
1 = Establishment of nominal institutions
2 = Information gathering and advisory role
3 = Ability for institutions to amend proposals
4 = Ability for institutions to veto proposals
5 = Supranational institutions operate as primary decision node

5. Degree of Monetary Policy Coordination
0 = No monetary policy coordination
1 = Consultation regarding policy
2 = Commitment to maintain parity
3 = Coordinated interventions
4 = Regional Central Bank establishment
5 = Single currency

6. Degree of Fiscal Policy Coordination
0 = No fiscal policy coordination
1 = Consultation regarding policy
2 = Commitments regarding deficit spending and taxation
3 = Sanctions regarding breaking commitments
4 = Uniform tax code
5 = Single budget

•Each category has a value of 0 (low) through 5 (high) along a Guttman scale:

B. Hierarchy
 Hierarchy is one of the independent variables used in the multinomial regression model.

This variable measures the difference between relative power a regional leader and other

states in the EU. We take Germany as the regional leader of the European system.

Consequently, Hierarchy variable points out the relative power difference between Germany

 32
and the rest of the member states of the EU. We take the GDP (in purchasing power parity) of

states and calculate hierarchy in the following way:

 =
 ( )

Data for Hierarchy come from the International Monetary Fund, World Economic Outlook

Database (April 2016). The higher the Hierarchy, the higher the capability of the regional leader

over the other states in the region. If hierarchy declines, it is an indication that the power gap

between the regional leader and other countries is decreasing.

C. Value Convergence

 The distance of values between two countries is called ‘value convergence’. This

variable is calculated by measuring the Euclidean distance between the points on the values

vectors, which can be seen on the values map. The X-axis represents the Traditional-Secular

Values, and the Y-axis displays the Materialist-Post Materialist Values on the map. Value

Convergence (value distance) of Country a and Country b is calculated as follows:

 , = √( − )2 + ( − )2

The statistical model that is utilized in the analyses focuses on value convergence towards

Germany. This variable centers on the value distances of all the EU countries towards Germany.

This value convergence indicator is abbreviated as ‘VcGer’. Value Convergence towards

Germany (VcGer) is calculated as follows:

 33
 , = √( − )2 + ( − )2

Value Convergence data is multiplied by -1 after being calculated. Since this variable is about

distances between value points, when countries are closer to each other in terms of values, the

level of cooperation or integration is expected to increase. Therefore, the value distance

between countries and the level of integration have an inverse relationship. This inverse

relationship would create a negative coefficient for Value Convergence in statistical tables and

can be confusing for the audience when interpreting the results. As a result, Value Convergence

calculations are multiplied by -1; the meaning of the conception is preserved: the higher the

level of value convergence between countries, the higher the level of cooperation/integration.

Multiplying the calculation results of Value Convergence has no effect on the weight of the

variable. Therefore, this procedure does not affect the coefficients of the statistical results. It

only changes the sign of VcGer to (+) from (-).

D. Trust Estimation

 Trust is calculated via Excel’s Trend function. The Trend function is adjusted to take into

account the previous 4 years of data for every estimated year.

APPENDIX B

Integration Factors Index

 It is possible to make estimations about furthering of integration by using the variables

that are obtained from the multinomial regression model. Since our multinomial model does

 34
not let us insert variables and make estimations in the same fashion of a linear model, we

should think in a way that takes into account the categorical nature of the dependent variable

(Integration Achievement Score). The independent variables in the multinomial model tests the

elements on, or factors of integration. We need to understand how these independent

variables, Value Convergence, Trust and Hierarchy, differentiate in different integration

categories. Table B.1 displays the average level of every independent variable in the integration

categories. The means of the independent variables at every integration category display

certain levels. In other words, factors of integration have to come to a certain level in order to

witness integration.

Table B.1: 1980 – 2011 Benchmark for the Index
 Integration
 Independent Std. Factors
 IAS Variables N* Minimum Maximum Mean Deviation Index
 .00 Value Convergence 127 0.17500 2.86007 1.5883041 0.65747531 0.097
 Trust 14 0.33850 0.62504 0.4493635 0.09524567
 Free Trade
 Hierarchy 339 0.23758 0.42784 0.3438517 0.04530341
 Valid N 14
 Countries: Spain, Poland, Romania, Greece, Czech Republic, Hungary, Finland, Bulgaria, Croatia, Slovakia,
 Slovenia, Latvia, Lithuania, Estonia, Cyprus, Malta
 2.67 Value Convergence 75 0.67382 1.73667 1.2049535 0.27654858 0.1914
 Trust 130 0.24000 0.88000 0.6265385 0.15382821
 Customs
 Hierarchy 130 0.33118 0.42784 0.3681142 0.03326596
 Union
 Valid N 75
 Countries: France, Spain, Italy, Netherlands, Belgium, Greece, Portugal, Denmark, Ireland, Luxemburg, UK
 3.17 Value Convergence 168 0.15811 2.66133 1.3639665 0.47136607 0.1038
 Trust 192 0.17027 0.68912 0.5005842 0.10410617
 Common
 Hierarchy 192 0.23758 0.35302 0.2827435 0.04054722
 Market
 Valid N 168
 Countries: France, Spain, Italy, Netherlands, Hungary, Finland, Bulgaria, Belgium, Greece, Portugal, Denmark,
 Ireland, Poland, Sweden, Austria, Romania, Czech Republic, Slovakia, Slovenia, Latvia, Lithuania, Estonia,
 Cyprus, Malta, Luxemburg, UK
 3.50 Value Convergence 31 0.60381 2.52982 1.2397807 0.58833121 0.1305
 Trust 31 0.40152 0.65455 0.5353495 0.06489291
 Hierarchy 31 0.30038 0.30463 0.3022428 0.00179534

 35
Economic Valid N 31
 Union

 Countries: France, Spain, Italy, Netherlands, Belgium, Austria, Greece, Portugal, Finland, Ireland,
 Luxembourg
 3.83 Value Convergence 124 0.35355 2.24473 1.1053302 0.48202021 0.1230
 Trust 127 0.27550 0.69860 0.5374050 0.08116768
 EMU
 Hierarchy 127 0.23758 0.29576 0.2529337 0.01862016
 Valid N 124
 Countries: France, Spain, Italy, Netherlands, Belgium, Austria, Greece, Portugal, Finland, Ireland, Slovakia,
 Slovenia, Luxembourg, Estonia, Cyprus, Malta
 * Country year

When the means of the independent variables, denoting factors of integration, come to a

certain level, they demonstrate a level of sufficiency for furthering of integration. By multiplying

the means of the independent variables, it is possible to measure the overall impact of the

factors of integration. This calculation is called the Integration Factors Index (IFI):

 1
 = × ×

Since Value Convergence is a distance measurement between countries, the inverse mean is

taken: 1/MeanVcGer - the lower the values distance between countries, the higher the level of

integration. Therefore, in this analysis, a decreasing mean of VcGer, which denotes converging

values, is ideal, and it would increase the IFI. In contrary, the higher the mean of TrustEC, the

higher the level of integration. Similarly, the higher the mean of HierGer, the higher the

integration factors index, representing increasing likelihood for integration. In conclusion, the

IFI measures the overall level of the factors of integration or the general impact of the drivers of

integration. The higher the IFI among countries, the higher the likelihood of developing

 36
integration among them. And if there is already some level of integration among these

countries, the higher the IFI, the higher the chances of deepening of integration. In opposite,

the lower the IFI among a group of countries, the lower the possibility of integration (or

deepening of integration if there is already some level of integration among them).

 The Integration Factors Index results of Table B.1 can be utilized as a comparative

standard estimating further integration. Table B.1 focuses on the period between 1980 and

2011, which is the most reliable section of the dataset in this study because there is no

estimation. As it can be seen from the table, the smallest IFI number, which is 0.097, appears

under the 0.0 category where there is no integration between countries. This situation is not

surprising since it indicates that the combination of Value Convergence, Trust, and Hierarchy is

not at a sufficient level for integration. All the integration categories have higher IFI numbers

than the 0.0 level. However, with 0.1038, the 3.17 level displays the lowest level of IFI among

the integration categories. Thus, the lowest IFI number among the actualized integration

categories, can be taken as a comparative benchmark as 0.10 in order to estimate the

probability of furthering integration in the future. As result, the higher the Integration Factors

Index than 0.10, the higher the probability of integration among the EU countries. When the IFI

falls below 0.10, the probability of integration decreases among the members.

 Table B.2 depicts the chances of future integration if the UK does not leave the EU in

2019. Table 2 (see analysis section in paper) portrays the impact of Brexit for the future

integration potential in the EU. Table B.2 is provided in this section to demonstrate that with

the UK in the Union, the likelihood for deepening of integration decreases. The IFI numbers of

both integration groups, Economic Union countries and the Eurozone countries, are smaller

 37
when the UK does not leave. In all three scenarios of Trust, the countries that are only in the

Economic Union (3.17) fall behind the IFI threshold 0.10. Even in a high trust scenario, these

countries fall two points short in terms of demonstrating a potential for furthering integration.

On the other hand, if the UK does not leave, the Eurozone countries would be affected as well.

Even though the UK is not in the 3.83 integration group, it is weakening the German hierarchy

which influences all the member countries. As a result, only in a high trust scenario, the

Eurozone countries demonstrate a potential for deepening of integration. Consequently, if the

UK does not leave the Union, all the factors of integration, Values Convergence, Hierarchy and

Trust would be negatively influenced and the likelihood for further integration would decrease

in all integration categories.

Table B.2: What if the UK does not leave? (2019-2021)
 Integration Achievement Integration
 Independent Variables N* Mean
 Score (IAS) Factors Index
 3.50 Value Convergence 27 1.478376691
 (Economic Union) Hierarchy 27 0.243017254
 Low Trust 27 0.312734275 0.05
 Normal Trust 27 0.39058104 0.06
 High Trust 27 0.468427805 0.08
 Countries: UK, Poland, Sweden, Romaine, the Czech Rep., Hungary, Denmark, Bulgaria, and Croatia

 3.83 Value Convergence 54 1.026741786
 (Eurozone + partial financial integration) Hierarchy 54 0.243017254
 Low Trust 54 0.313529587 0.07
 Normal Trust 54 0.391633371 0.09
 High Trust 54 0.469737155 0.11
 Countries: France, Spain, Italy, Netherlands, Belgium, Austria, Greece, Portugal, Finland, Ireland, Slovakia,
 Slovenia, Latvia, Lithuania, Luxemburg, Estonia, Cyprus, and Malta
 *Country-year

 38
You can also read