Tuna - freshwater eels - UNDERSTANDING FRESHWATER FISHERIES IN - Te Wai Maori
←
→
Page content transcription
If your browser does not render page correctly, please read the page content below
Tuna – freshwater eels
U N D E R S TA N D I N G F R E S H WAT E R F I S H E R I E S I N
AOTEAROA
3          Tuna (Freshwater Eels)
Family: Anguilla

Species: Anguilla australis, Anguilla diffenbachii

There are currently 18 recognised species/subspecies of freshwater eels worldwide (Tesch 2003),
distributed in both tropical (around the equator) and temperate (between the tropics and polar
circles) zones, with some species overlapping between these two zones. Recent studies indicate that
tropical eels make much shorter migrations (c. 100’s km) to spawn in areas near their freshwater
habitats when compared to the long distances travelled by temperate (e.g., Aotearoa-NZ) eels (c.
1000’s km) (Aoyama 2009).

Māori have an extensive knowledge of tuna. It is not the place of this report to collate and publicise
the extensive body of mātauranga Māori that has been actively practised over centuries by whānau,
hapū and iwi. While our tuna species are often characterised in terms of biophysical science (family,
genus, species), mana whenua have an extensive range of classifications for tuna related, for
example, to appearance, colouration, season of the year, size, behaviour, locality, and palatability.
According to science, three tuna species occur in Aotearoa-NZ (Figure 4); the longfin (Anguilla
dieffenbachii), which is only found in Aotearoa-NZ; the shortfin (A. australis), which also occurs in
eastern Australia and the Pacific; and the Australian speckled longfin1 (A. reinhardtii), which has
recently been confirmed as present in Aotearoa-NZ, and is also found in Australia and New
Caledonia.

Longfins are distinguished from shortfins by the length of the dorsal (top) fin; when viewed side on,
the dorsal fin is longer than the anal (bottom) fin, and extends well forward past the end of the anal
fin. In shortfins, the dorsal and anal fin ends are almost the same length (Figure 4). The Aotearoa-NZ
longfin is one of the largest eel species in the world (Tesch 2003) and can get to more than 50 kg
(Potts 1882, Cairns 1941, Graham 1956). Shortfins do not grow as large as longfins. The Australian
speckled longfins look like our longfins but have black blotches all over their body, except for their
belly (Figure 4). Although the habitat of the Australian longfin overlaps that of the A. dieffenbachii, it
is thought that there is little danger that the Australian longfin will edge out A. dieffenbachii because
researchers believe that each eel species has a single spawning ground. It is thought that the arrival
of A. reinhardtii in Aotearoa-NZ will continue to be erratic and intermittent, although the confirmed
presence of several year classes suggests their migration to Aotearoa-NZ is not an isolated event
(Jellyman et al. 1996, McDowall et al. 1998, Chisnall 2000a).

3.1        Life Cycle
To complete their life cycle, tuna must be able to move freely between fresh water and the ocean,
spending extended periods in marine, estuarine, and freshwater habitats. The freshwater eel has a
larval stage known as leptocephalii, which is only found in the ocean. These transparent leaf-shaped
larvae are transported to Aotearoa-NZ using near-surface ocean currents. After encountering the
continental shelf the larvae transform into the transparent and actively swimming ‘glass eels’ which
are approximately 55–70 mm. Once glass eels (Figure 6) have entered a catchment, each catchment
effectively contains a separate population of eels. Once in freshwater, glass eels develop into darker
pigmented juvenile eels known as elvers. After reaching suitable habitat, tuna grow, often for several
decades, before maturing and beginning the return trip to their oceanic spawning grounds (Figure 5,
Table 2).

1   Confirmed in 1997, from 19 eels caught in the Waikato River.
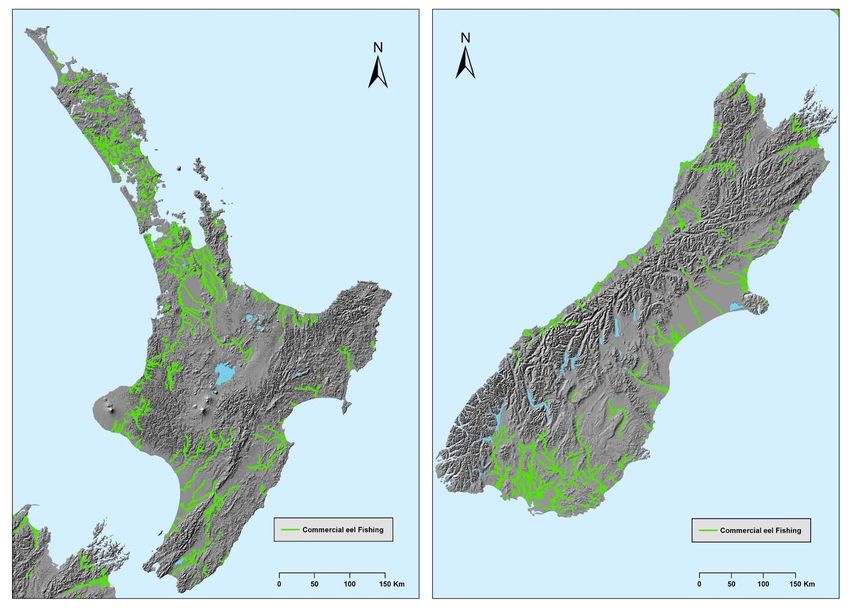
Figure 1:      According to science three freshwater eel species occur in Aotearoa-NZ; (top) the shortfin (A.
australis); (middle) the endemic longfin (A. dieffenbachii); and (bottom) the Australian longfin (A. reinhardtii)
which was confirmed in Aotearoa-NZ in 1997 but is relatively rare. (Diagrams: Bob McDowall).

Figure 2:   Freshwater eel life-cycle showing the marine (green) and freshwater (blue) life stages. (Source:
Aarti Wadhwa).
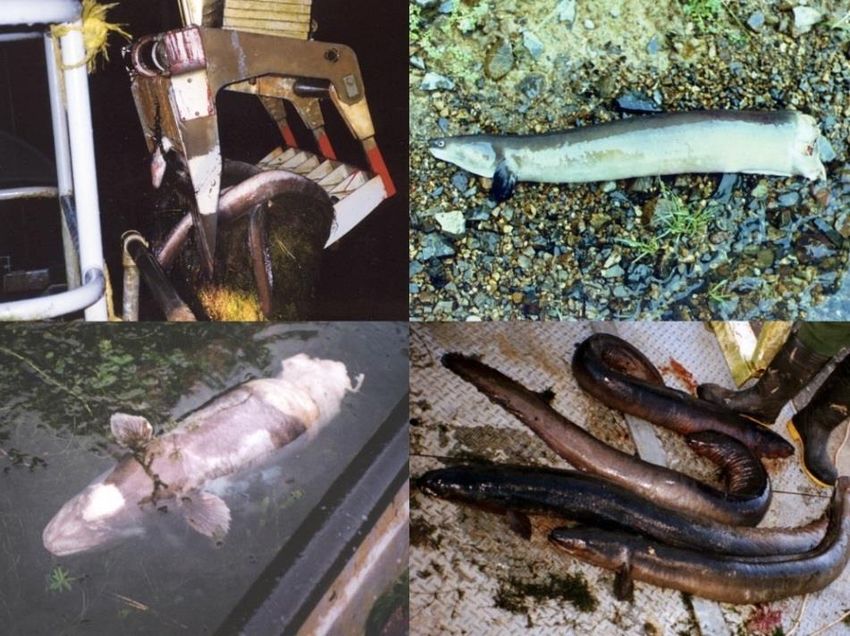
Table 1: Key features of each tuna life stage. (References include: Cairns 1941; 1942, Burnet 1952, Jellyman 1977, Jellyman 1979, Jellyman & Todd 1982, Jellyman & Ryan
1983, Chisnall 1987; 1989, Chisnall & Hayes 1991, Chisnall & Hicks 1993, Chisnall & Kalish 1993, Glova et al. 1998, Jellyman et al. 1999, Chisnall et al. 2002, Jellyman et al. 2002,
Jellyman & Tsukamoto 2002, McCleave & Jellyman 2002, Jellyman & Lambert 2003, Tesch 2003, Graynoth & Niven 2004, Graynoth & Taylor 2004, McCleave & Jellyman 2004,
Davey & Jellyman 2005, Jellyman & Tsukamoto 2005, August & Hicks 2006, Graynoth et al. 2008a; 2008b, Jellyman & Tsukamoto 2010, Jellyman & Arai 2016).
Life stage Key features Key habitats Agencies with responsibilities
Fertilised egg • Spawning occurs in spring (September to November). • Pacific Ocean – In deep water. • New Zealand Ministry of Foreign Affairs and Trade (MFAT)
• The exact spawning locations of A. australis and A. diffenbachii are (international agreements on ocean governance and
yet to be determined. Likely to occur somewhere in the southwest fisheries management, e.g., UN Convention on the Law of
tropical regions of the Pacific Ocean, from north-west of Fiji to just the Sea).
west of Vanuatu for A. australis. • Environmental Protection Agency (EPA) (e.g., managing
• Fertilised eggs develop and hatch rapidly in the ocean. environmental effects of restricted activities in NZ's
Exclusive Economic Zone and Continental Shelf).
Larvae • Transparent, leaf-shaped. • Pacific Ocean to Aotearoa-NZ continental • As above.
(leptocephalii) • Spend 9–12 months in the plankton before arriving on the coast of shelf.
Aotearoa-NZ. • Planktonic.
• Transported closer to Aotearoa-NZ using near-surface ocean
currents.
Glass eel • Transparent. • Aotearoa-NZ continental shelf to fresh • MPI (e.g., lower size limit, special permits, exotic pests,
• Glass eels are the product of a 5,000 km migration by adults, the act waters. biosecurity, fish passage).
of spawning itself, and the uncertainties of a 6-month larval life at • Lower reaches of waterways open to the • Regional councils (e.g., land use change/management as it
sea. sea. affects water quality, biosecurity, fish passage, habitat,
• About 50–65 mm in length. • Small eels seem to favour runs and riffles of ecological flows, point source discharges, pollution events,
• Generally arriving in Aotearoa-NZ waters between August and waterways where the substrate is coarse esplanade areas, flood control, gravel extraction, drain
December. and the current is swift. clearance).
• Numbers of glass eels arriving at river mouths are subject to • District councils (e.g., land use zoning, land use
considerable year-to-year variation. change/management, esplanade areas).
• Entry into fresh water often correlated with lunar phase and spring • DOC (e.g., fish passage, exotic pests, habitat, national
tides, and occurs mainly at night. parks, conservation estate, scientific reserves,
research/collection permits, grazing licences for riparian
• Length and weight declines in both species of glass eels as the areas, and marginal strips).
season progresses.
• Land Information New Zealand (LINZ) (e.g., administration
incl. use of riverbeds, fairway maintenance).
Elver • Pigmentation covers 100% of the juvenile eel’s body. • Fresh waters. • MPI (e.g., as above).
• About 70–150 mm in length. • Elvers of both longfins and shortfins are • Regional councils (e.g., as above).
• Migrate upstream during summer (when temperatures reach about common in swiftly flowing gravelly rapids • District councils (e.g., as above).
17C), sometimes over several years. and riffles, where they live and feed • DOC (e.g., as above).
• Use surface tension to surmount damp, vertical surfaces, such as amongst the gravel. • LINZ (e.g., as above).
waterfalls. • Small shortfins (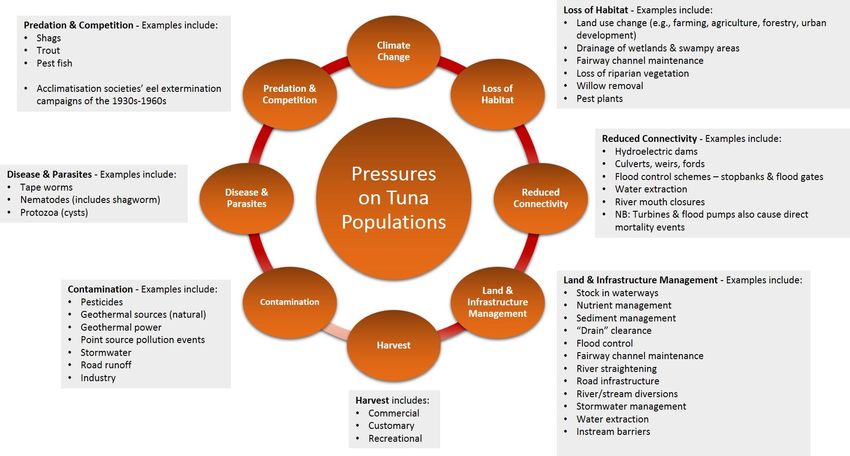
Table 2: Continued.

   Life stage                               Key features                                                   Key habitats                                     Agencies with responsibilities
 Pre-           • Opportunistic feeders and eat a diverse range of food, including         • Eels occupy a wide variety of freshwater         • MPI (Quota Management System, upper and lower size
 reproductive     stream insects, terrestrial insects, snails, earthworms, kōura, fish,      habitats, including, coastal estuaries, lakes,     limits, number of fishing licenses, catch limits, exotic pests,
 adults           small birds. Size of their prey depends largely on the gape (mouth)        wetlands, rivers, mountain streams and alpine      biosecurity, fish passage, mātaitai reserves, co-
                  size of eels. Large eels are often the top predator in freshwater          tarns.                                             management, bylaws).
                  ecosystems.                                                              • As eels grow larger, many move                   • Iwi/hapū/rūnanga (e.g., customary harvest, mātaitai
                • Have poor eyesight, are sensitive to strong light, and are active          upstream/further inland, they hide beneath         reserves, co-management, bylaws).
                  nocturnal foragers. Food and prey are located primarily by odour           overhanging banks and logs.                      • Regional councils (e.g., land use change/management as it
                  detection, using a consistent behavioural response to flow, which        • Larger eels (>300 mm) of both species are          affects water quality, biosecurity, fish passage, habitat,
                  results in direct upstream movement toward the odour source when           commonly associated with cover, such as            ecological flows, point source discharges, pollution events,
                  in an odour plume.                                                         macrophyte beds, willow roots, overhanging         esplanade areas, flood control, gravel extraction, drain
                • Flooded river margins are also important feeding grounds for eels,         banks, in-stream debris and shade.                 clearance).
                  particularly shortfins.                                                  • Several studies describe the behaviour of        • District councils (e.g., land use zoning, land use
                • Eel growth rates are highly variable. High growth rates may occur          eels as having a “home range”.                     change/management, esplanade areas).
                  where food is abundant, but can be very poor in highly modified          • Shortfins prefer slower flowing, lowland and     • DOC (e.g., fish passage, exotic pests, habitat, national
                  habitats with high recruitment/high densities.                             coastal waters.                                    parks, conservation estate, scientific reserves,
                • Eels are not born a particular sex, it is determined as they get older   • Longfins penetrate further inland and prefer       research/collection permits, grazing licences for riparian
                  by the environment they are living in. The environment and the             faster flowing water and stony substrates.         areas, and marginal strips).
                  number of individual eels who share that same environment                • As eels increase in size the preference is for   • LINZ (e.g., administration incl. use of riverbeds, fairway
                  contributes to determining the sex of an eel, with females tending to      deeper water; eels >499 mm generally               maintenance).
                  be more common at lower eel population densities. This may be due          prefer water almost twice as deep.
                  to large female eels being cannibalistic feeders, and this habit may
                  also influence the distribution of eels. Without this ecological
                  relationship, a higher density of smaller eels can induce sexually
                  immature juveniles to become male. This may have implications not
                  only on inter-related species, but also on the number of female eels
                  contributing to the spawning population.
                • Large eels, particularly longfins, play an important role in
                  determining the population structure of eels, including species
                  composition, sex ratios and size distribution.

                                                                                                                                                                                             4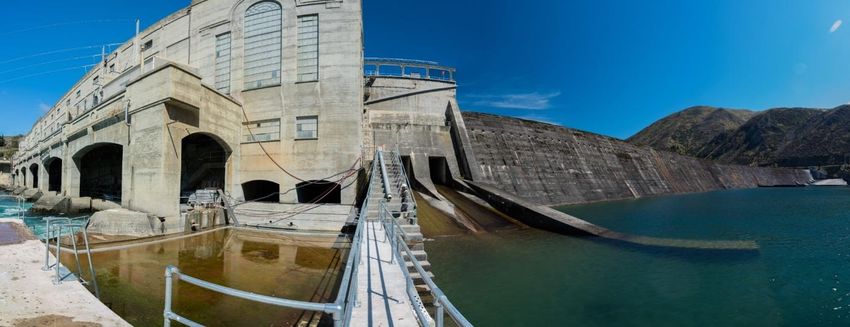
Table 2: Continued.

   Life stage                                Key features                                                  Key habitats                  Agencies with responsibilities
 Adult migrant   • Once eels become migrants they stop feeding.                             • Fresh waters to the ocean.   • MPI (e.g., Quota Management System, upper size limits,
                 • Female eels from the same species grow larger and are older than                                          special permits, exotic pests, biosecurity, co-management,
                   males at maturity.                                                                                        bylaws).
                 • Precise trigger that causes eels to develop into migrants is not well                                   • Iwi/hapū/rūnanga (e.g., customary harvest, mātaitai
                   known, but high fat content that provides sufficient energy to                                            reserves, co-management, bylaws).
                   develop gonads (reproductive organs) and cover the long distance to                                     • Regional councils (e.g., land use change/management as it
                   spawning grounds appears to be essential.                                                                 affects water quality, biosecurity, fish passage, habitat,
                 • External features change to better cope with oceanic conditions,                                          ecological flows, point source discharges, pollution events,
                   including: the head becomes flatter and slender, belly lightens to a                                      esplanade areas, flood control, gravel extraction, drain
                   grey or silver colour, the pectoral fins and eyes enlarge.                                                clearance).
                 • Shortfin males tend to migrate in February and March, followed soon                                     • District councils (e.g., land use zoning, land use
                   after by the shortfin females. Longfin males migrate during April, and                                    change/management, esplanade areas).
                   longfin females during late April and May.                                                              • DOC (e.g., fish passage, exotic pests, habitat, national
                 • Shortfins generally migrate at a younger age than longfins, and are                                       parks, conservation estate, scientific reserves,
                   smaller than longfins when they migrate.                                                                  research/collection permits, grazing licences for riparian
                 • Males (both species) are smaller and migrate at an earlier age than                                       areas, and marginal strips).
                   females. Males do not need to be large to produce a large quantity                                      • LINZ (e.g., administration incl. use of riverbeds, fairway
                   of sperm, so they grow rapidly to a size that enables them to migrate                                     maintenance).
                   to the spawning ground.                                                                                 • MFAT (international agreements on ocean governance and
                 • Larger female eels are much more fecund (contain more eggs) than                                          fisheries management, e.g., UN Convention on the Law of
                   smaller female eels.                                                                                      the Sea).
                 • The size difference between males and females is strategically                                          • EPA (e.g., managing environmental effects of restricted
                   important. Fecundity has been estimated at between 1.5 and 3                                              activities in NZ's Exclusive Economic Zone and Continental
                   million eggs in migrant shortfin females 500–800 mm in length while                                       Shelf).
                   large migrant longfin females (1,400–1,600 mm length) may contain
                   over 20 million eggs.
                 • Migration to oceanic spawning grounds probably takes many months
                   (not a straight line, they are also diving down between about 200 m
                   and 700 m depth each day).
                 • Spawning grounds located somewhere in the southwest tropical
                   regions of the Pacific Ocean, potentially the South Fiji Basin.
                 • The adults do not return to Aotearoa-NZ and are thought to die at or
                   near the spawning ground.

                                                                                                                                                                        5
Figure 3:   (Left) A glass eel; and (Right) Mixture of glass eels and elvers. The dark pigment spots (called
melanophores) appear on the skin as the glass eel continues to grow and change into the next stage of their life cycle
when they become completely brown and are known as elvers. (Photos: [Left] NIWA, [Right] Joe Potangaroa).

Each species is assumed to consist of a single genetic stock despite occupying broad geographic ranges.
Shortfins from Australia and Aotearoa-NZ show small but significant differences in their form/shape
(Jellyman 1987, Watanabe et al. 2006), but whether these small differences are a result of spawning in
separate areas is unknown. On the weight of current evidence this seems unlikely, meaning that the species
should be recognised and managed as a single trans-Tasman one. In contrast, the Aotearoa-NZ longfin is
only found in this country and our offshore islands, meaning there is no reserve stock or “buffer” should
numbers on mainland become seriously depleted (Jellyman 2013).

3.2     Distribution
Longfins are found throughout Aotearoa-NZ, including the Chatham Islands, from the coast to any
upstream habitat they can reach. Although longfin were recorded as present in the Auckland Islands during
the 19th century, they have not been found there since (McDowall 1990). There are a few areas of the
country where longfins have been observed very frequently, including Taranaki, between Manukau Heads
and Warkworth (North Auckland), West Coast of the South Island and top of the South Island (Figure 7).

Shortfins are less widely distributed across Aotearoa-NZ. Shortfin eels are generally found in lowland rivers,
streams, lakes, swamps and estuaries (Figure 7). Shortfin eels are predominantly located close to the ocean
in the South Island, but are found further inland in the top-half of the North Island. In particular, shortfins
are commonly encountered throughout the Waikato Region through to the south of Auckland. It is usually
the most common species where eel populations are very dense, and they generally do not travel as far
upstream as longfin (McDowall 1990). A. australis is also found in Australia (East Coast), Tasmania, New
Caledonia, Lord Howe and Norfolk Islands (McDowall 1990).

                                                                                                               6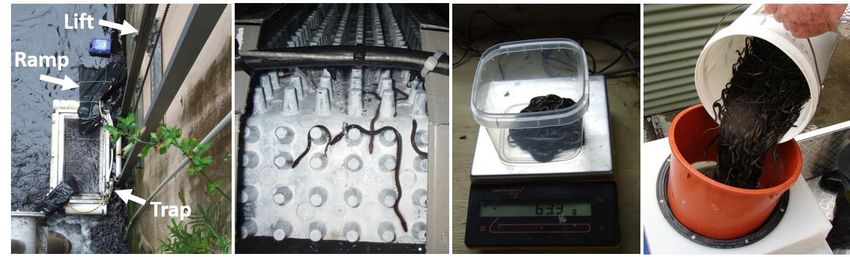
Figure 4:   Locations of NZFFD records where: (Left) Longfin eels, and (Right) Shortfin eels, are present (black circles) and absent (grey circles).

                                                                                                                                                       7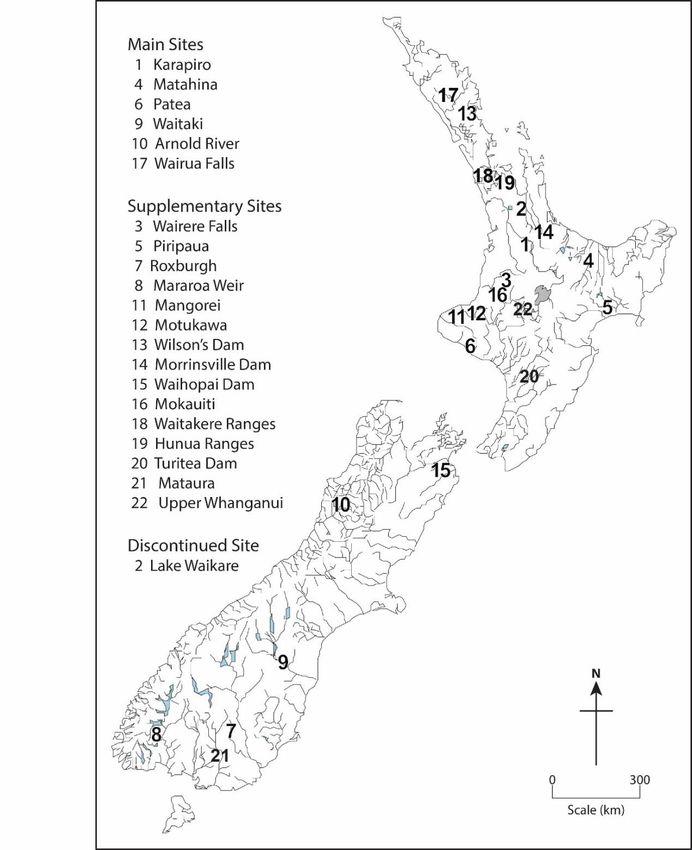
3.3       State and Trends in Abundance
3.3.1 Method Recap
To account for some of the limitations in the NZFFD data, Crow et al. (2016) drew on several
statistical approaches to address some of the biases that come with using this dataset. To identify if
the ‘probability of capture’ for a taonga freshwater species through time appears to be increasing
(getting better), decreasing (getting worse) or staying the same, Crow et al. (2016) completed simple
linear regression2 calculations (how does X relate to Y?) using two different techniques.

The first technique was the Sen Slope Estimator (SSE), while the second technique was a weighted
version of the SSE. The weighted SSE (called WSSE hereafter) assigns a weighting value based on the
size of the confidence intervals3 (CI). In the WSSE, pairs of years that collectively have small CIs are
weighted more heavily than pairs of years that collectively have large CIs because we were more
confident in these probability of capture values.

Both WSSE and SSE results are presented in this report because, together, they help us understand
whether or not we can be confident in the analysis and detect a trend over time (either increasing or
decreasing) – or if we cannot detect a trend.

3.3.2 Tuna Results
The SSE slope for longfin eels was indeterminate over the 1977–2015 period, while the WSSE slope
showed a median (± 95% CI) decreasing trend of 0.09 (± 0.06) %/year (Figure 8). The estimated
probability of longfin capture for each year displayed high levels of variance between years. For
example, over 2010–2015, values close to both the highest and lowest probability of capture values
were observed.

Both SSE and WSSE showed increasing trends for shortfin eels over the 1977–2015 period (Figure 8).
The SSE results suggested that shortfin probability of capture was increasing at a median (± 95% CI)
rate of 0.13 (± 0.02) %/year, while WSSE results suggested that shortfin probability of capture was
increasing at a median (± 95% CI) rate of 0.18 (± 0.01) %/year.

In summary, the high levels of variance in the longfin eel data meant that the two trend analyses
over the full-time series available (1977–2015) were not in agreement and did not show a strong
trend in either direction; while for shortfin eels both methods agree that population trends are
increasing (Crow et al. 2016).

2 Simple linear regression is a statistical method that allows us to summarise and study relationships between two continuous
(quantitative) variables.
3 A confidence interval is a range of values we are fairly sure our true value lies within.

                                                                                                                                8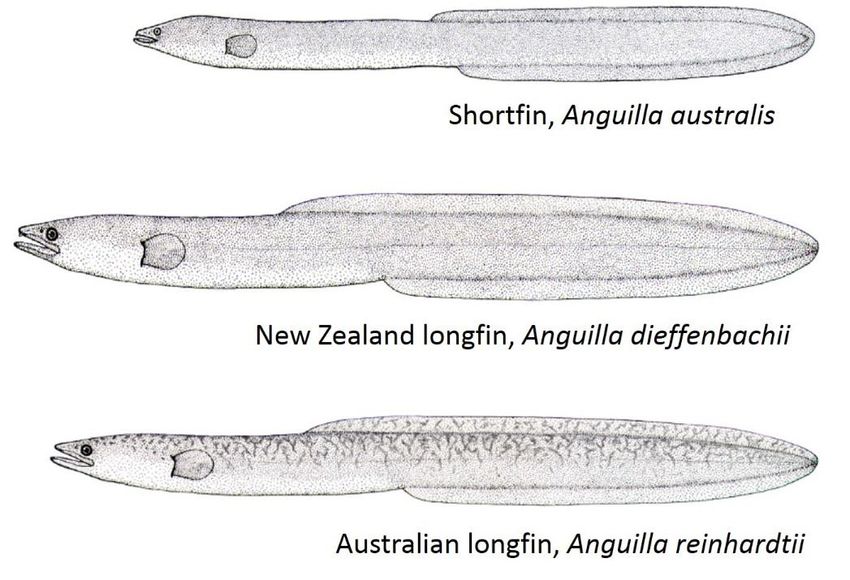
Figure 5:     Change in the probability of capture of longfin (A) and shortfin (B) eels associated with year
using data from the NZFFD. Plots show ‘probability of capture’ for each year (black circles) and 95% CI (grey
shaded area). SSE (left) and WSSE (right) are shown for 1977–2015 (solid black line), 1977–1994 (dotted black
line) and 1995–2015 (dashed black line). (Source: Crow et al. 2016).

3.3.3 Trends in Elver Recruitment
The past few decades have seen a decline in the recruitment of Northern Hemisphere species of
freshwater eels. Eels recruit into Aotearoa-NZs rivers as transparent glass eels in their first year of life
and spend some time in estuarine reaches before moving upstream. Elvers, the next stage in the life-
cycle, are 1–4 years old and move upstream as they grow older. In Aotearoa-NZ, there are indications
that the huge elver runs that were both witnessed (e.g., Best 1929) and filmed (Hayward & Hayward
1992) prior to the 1960s are no longer seen. It is not known how present recruitment relates to
historical runs, but since 1995 MPI has been monitoring elver recruitment (e.g., Martin & Bowman
2016).

Monitoring elver catches at sites where trap-and-transfer operations (e.g., Figure 9) are undertaken
provides an opportunity to track the relative abundance of elvers over time. Provided data are
collected in a consistent manner each year, it can be used to determine overall trends in recruitment.

                                                                                                                9
Recruitment is predominantly monitored by trapping elvers at hydroelectric dams and other man-
made structures (e.g., weirs). Estimates of the numbers of elvers (by species) arriving at hydroelectric
dams on several Aotearoa-NZ rivers are recorded by stakeholders, mostly (but not exclusively) as
part of resource (operating) consent conditions. The datasets generated are currently compiled by
NIWA under contract to MPI. Every two to three years this data is collated into reports for MPI which
are publicly available. Elver trapping data are one of the information sources used by MPI to monitor
trends in eel recruitment and inform eel management at a national scale.
Figure 6: Elver trap-and-transfer activities. (Left to right) Elver trap at Karāpiro dam; An example of an
elver ramp; Estimating the total elver catch using a sub-sample; and Transfer of elvers into transportation
tanks for release. (Photos: Mike Martin and Jacques Boubée).
Over the last 25 years, elver data has been recorded from 22 sites in Aotearoa-NZ (Figure 10), but
most of these data have inconsistencies due to modifications to the trapping arrangements or time
periods where data were not collected (e.g., structures being modified). NIWA developed standard
methods for the trapping and transfer of elvers and recording of the catches in the early 1990s
(Martin et al. 2007). Elver trapping has occurred consistently in a standardised manner at six main
sites, and these form the basis of the elver abundance time series. The time series of data collected
from the main sites varies from 5 years (Wairua Falls) to 22 years (Karāprio Dam).
Longfin and shortfin elver recruitment at a site is temporally variable with abundance varying two-
fold between some years; overall there has been no consistent trend in recruitment across the main
sites (Figure 11 & 12). Matahina Dam and Karāpiro Dam both show similar annual patterns over the
15 years of continuous data collection. Pātea Dam also has high levels of recruitment variability, but
the most recent longfin catch index in 2015–16 is more than double that of next highest year in
2007–08. Shortfin recruitment at the Pātea Dam decreased from 2005–2011, but has steadily
increased each year after this. In contrast, Piripaua longfin and shortfin catches have remained very
stable during the early 2000’s and have increased markedly over the last five years. Data across all
sites have been used by Martin and Bowman (2016) to conclude that there has been no decline in
recruitment over the last 25 years.
10Figure 7: Locations of the 22 sites where elver trapping has occurred in Aotearoa-NZ over the last 25
years. Main sites have elver data collected each year, while supplementary sites have data collected
intermittently. (Source: Martin & Bowman 2016).
11Figure 8: Index of relative abundance for longfin elver catches from 1995–96 to 2015–16. (Source: Martin
& Bowman 2016). Because of the variability between sites and years, elver catch records were normalised
following the method of Durif et al. (2008), and a “normal” catch index was calculated for each species, season,
and location (MPI 2017).
Figure 9: Index of relative abundance for shortfin elver catches at selected hydro dams from 1995–96 to
2015–16. (Source: Martin & Bowman 2016). Because of the variability between sites and years, elver catch
records were normalised following the method of Durif et al. (2008), and a “normal” catch index was calculated
for each species, season, and location (MPI 2017).
3.4 Threat Rankings
The latest New Zealand Threat Classification System assessment classified shortfins as being ‘Not
Threatened’, while longfins are classified as ‘At Risk–Declining’ (Goodman et al. 2014). The shortfin
classification was based on an increasing population (over what time period they used is unknown),
while the longfin classification was based on a declining population of 10–70% in two generations
12(i.e., 80 years). The Australian longfins were considered to have a secure overseas population and
were not assessed. The IUCN threat rankings are yet to be completed for Aotearoa-NZ eels (Table 3).
Table 2: Threat rankings for Aotearoa-NZ tuna species according to the New Zealand Threat
Classification System and IUCN. (see Section 2.3 for more information about these assessment methods).
Species DOC Ranking IUCN Ranking
Longfin (A. dieffenbachii) At Risk–Declining Not assessed
Shortfin (A. australis) Not Threatened Not assessed
3.5 Pressures on Populations
In Aotearoa-NZ, although longfins are still one of the most common freshwater fish, there are
concerns about the scarcity of very large specimens. Multiple factors are likely to be impacting eel
populations around the world, including changes in oceanic currents, habitat loss, over-exploitation
of adult stocks, mortality and migration delays experienced by upstream and downstream migrants
at barriers, parasites and diseases, predation, and pollutants (e.g., Castonguay et al. 1994, Haro et al.
2000, Arai 2014, Jacoby et al. 2015, Belpaire et al. 2016). The potential implications of climate (and
climate change), particularly on species with marine life stages, also needs to inform our long-term
thinking (e.g., Bonhommeau et al. 2008).
Key pressures on Aotearoa-NZ eel populations include habitat loss, loss of connectivity for migrations
between the sea and freshwater habitats, land and infrastructure management and harvest
(commercial, recreational and cultural). Other pressures may arise from competition (e.g., with
exotic fish species such as catfish and koi carp), predation on the vulnerable juvenile stages in rivers
and lakes, toxins, diseases and parasites, and marine factors (e.g., food availability) influencing the
survival of larvae, growth and recruitment of glass eels to river mouths (Figure 13) (e.g., Miller &
Tsukamoto 2017). The impact of these latter factors is currently unknown.
3.5.1 Loss of Habitat
Since European settlement there have been many changes in land use in Aotearoa-NZ, with large
areas being cleared for human habitation and agriculture. Statistics NZ (2008) categorises three main
land uses: production, conservation, and urban development. Over one-third of land is legally
protected for conservation purposes, with the remaining majority being used for primary production.
Urban and rural residential developments cover a small but growing area. Land-use change varies in
scale, with some alterations occurring at the catchment level and others at a much smaller,
microhabitat scale. The effect of land-use change on our taonga species are multi-layered affecting
the temperature, light, water quality and geomorphology of ecosystems. For example, it is estimated
that wetlands that once covered at least 670,000 ha before European settlement have now been
reduced to about 100,000 ha (MfE 1997). Within the Waikato catchment alone, the loss of wetlands
was estimated to be 84% between 1840 and 1976 (McDowall 1990). Much of this drainage pre-dated
the commencement of commercial eel fishing, but nonetheless resulted in a huge loss of tuna
habitat.
13Figure 10: Examples of some of the pressures on Aotearoa-NZ tuna populations.
14Being a somewhat lowland species, shortfins have been particularly affected by drainage of wetlands
and channelisation of rivers. Shortfins are also the species that responds most to flooding and feeds
extensively in newly inundated areas (Jellyman 1989, Chisnall & Hayes 1991, Chisnall 2000b), and
channelization of waterways has reduced such feeding opportunities (Chisnall 1989). The biomass of
larger eels is directly related to the amount of suitable cover (Burnet 1952), so the loss of cover by
such practices as macrophyte removal and channelisation of waterways, together with siltation,
reduces the quality of habitat available to both species. That said, Hicks and McCaughan (1997)
found that the conversion of land from forest to pasture resulted in an increase in the abundance of
shortfins. It is thought that access to pasture may also provide eels with an additional food source of
terrestrial invertebrates (Chisnall 1987, Chisnall & Hicks 1993). Sedimentation may reduce food
availability in pasture sites by clogging instream substrates (Hanchet 1990) which is also supported
by the work of Jowett and Richardson (1990) who found higher invertebrate biomass was associated
with coarse sediments. Sedimentation may also impact juvenile eels who are known to refuge in
subterranean substrates (Cairns 1950).
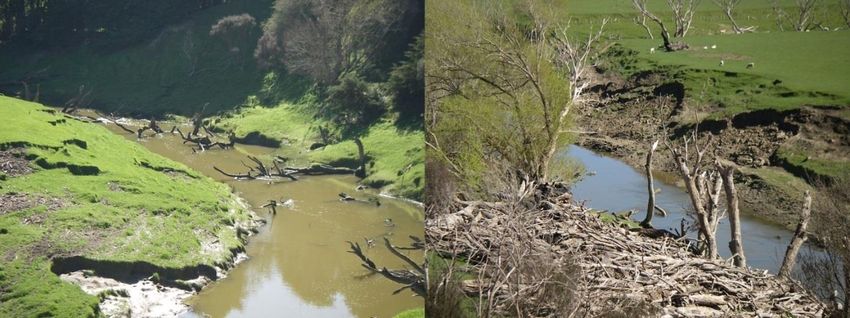
Willows on the margins of streams and rivers are known to provide habitat that is often used by both
longfin and shortfin eels. This is important in both an ecological and a commercial sense, as the
removal of riparian willows from streams and rivers, without replacement with a suitable alternative
(e.g., Figure 14) could adversely affect both the amount of habitat available to eels, and the number
of large eels available to fishers. Few studies have explicitly examined the importance of willows for
fish in our waterways (Glova & Sagar 1994). To date, very few scientific studies on willow-removal
effects have been conducted and any documentation/evaluation of rehabilitation projects that
include willow removal are equally scarce (Wagenhoff & Young 2013).
Figure 11: Examples of willow removal activities in the Tauweru River catchment. (Photos: Erica Williams).
Willows were brought to Aotearoa-NZ in early 1800s from Europe or Asia and widely planted for bank stability.
Of the 10+ willow (Salix) species/varieties, Crack willow (S. fragilis) and Grey willow (Salix cinerea) are very
invasive and can live for 100 years. It is illegal to propagate or plant crack willow in Aotearoa-NZ (NZ Landcare
Trust 2015).
Willow removal will cause short- to medium-term effects that potentially pose risks to taonga species
and the ecosystems that support them. Some of the risks are associated with: (1) The removal of
willows that have retained large amounts of fine sediment and organic matter; (2) The removal of
willows that have modified their environment as ecosystem engineers; (3) The loss of important
functions that riparian vegetation fulfils until the native vegetation is re-established, and (4) The
removal process itself (Wagenhoff & Young 2013).
A preliminary NIWA scoping study investigating the weights of eels in willowed and non-willowed
reaches of three waterways (Jellyman & Glova 1998) found that:
15• Longfins more than 220 g were much more abundant in willowed compared to non-willowed
reaches.
• Longfins less than 220 g were of roughly similar abundance and density in willowed and non-
willowed reaches.
• No shortfins more than 220 g were caught in non-willowed reaches, and only moderate
numbers were found in willowed stretches.
• Shortfins caught in the three study streams were predominantly less than 220 g, and these
were five times more abundant in the willowed reaches.
The main reason that riparian willows appear to provide habitat for eels is that, being a nocturnal
species, eels use willows during the day to avoid light. Eels are generally known as secretive and
"cover-loving" and large eels are frequently associated with overhung banks and dense instream
cover such as logs and debris. For juveniles, features of the substrate are very important, but larger
eels require more complex cover like debris clusters and undercut banks and the availability of such
cover will largely determine the density of large eels.
3.5.2 Reduced Connectivity
One of the greatest threats to indigenous fish populations that follow a diadromous life cycle are
barriers that prevent or delay migrations between freshwater and marine environments.
Connectivity between habitats can be critical to ensuring the long-term success of fish populations
(Lake et al. 2007, Fullerton et al. 2010). Barriers to migration can restrict access to habitats required
for foraging and feeding, predator avoidance, shelter, and spawning (Gibson et al. 2005). Lack of
access to these habitats, particularly for obligate migratory species, can ultimately lead to a
reduction in recruitment, population decline, and a loss of biodiversity (e.g., Jellyman & Harding
2012).
In Aotearoa-NZ, hydroelectric facilities (e.g., Figure 15) currently produce about 61% of the country’s
electricity needs and hydro generation is predicted to continue to be a significant source of energy in
the future (Ministry of Economic Development 2003). Anthropogenic barriers and hydroelectric dams
in particular are some of the factors thought to have contributed to the decline of eel populations
worldwide. Hydroelectric dams impact upon tuna in two ways: (1) By obstructing the upstream
migration of glass eels and elvers; and (2) By adversely affecting the safe passage of mature eels
downstream.
Minimum flows released from dams are now routinely set as part of resource consents to ensure
that habitat for resident fish populations are maintained below the dam, as well as providing passage
for migratory fish. However, to ensure that upstream migrating fish can pass over the dam and utilise
habitat upstream, the installation of passage facilities may be required. Passage facilities should aim
to permit passage for all upstream migrating fish that occur within a catchment, except for those
considered to be pest fishes (e.g., DOC 2010) and those situations in which a conservation case can
be made for not permitting access. Passage for those upstream migrating fish who have historically
been recorded in a catchment and who could reasonably be expected to require passage should also
be catered for. A variety of upstream passage facilities have been installed in Aotearoa-NZ, including:
(1) Substrate ramp passes (also known as fish ladders); (2) ‘Nature-like’ fish ways; (3) Fish lifts and
locks; and (4) Engineered fish passes. The choice of facility installed depends upon the fish species
requiring passage and characteristics of the barrier, such as head height, available space and
economic resources (Paterson 2010a).
16Figure 12: The Waitaki Dam. (Photo: Shannan Crow). The Waitaki Hydroelectric Power Scheme consists of
eight power stations from Lake Tekapō to Lake Waitaki. Mahinga kai is a value that lies at the heart of Ngāi
Tahu culture and identity. More than 30 different species were once gathered across 160 sites in the Waitaki
catchment, about 70% of which once sustained tuna. As the most commonly gathered food source, tuna
remain a taonga that whānau want to see restored across the catchment. Eighty-one percent of the catchment
is now located above the lower-most Waitaki dam, and without fish passage throughout the catchment, is
essentially lost as habitat to support tuna populations and mahinga kai values (Tipa & Associates 2015).
In general, small eels are very good climbers and can use surface tension to climb damp walls of
culverts, weirs and fords as long as the surface is moist and there is a continuous climbing surface
(i.e., with no breaks or overhang). Most problems occur when eels encounter barriers that have been
designed and/or installed incorrectly; resulting in very strong water flows through the structure and
scouring out the stream at the downstream end creating an overhanging perch that the eels cannot
climb. In many catchments, smaller-scale obstructions, such as weirs and culverts, are the most
common artificial barriers and thus may have a greater influence on taonga species population
dynamics. For example, of the estimated 3.6 culverts per 100 hectares in the Waikato Region, 36% or
1.3 out of 100 hectares were a barrier to all fish at all flows (i.e., to tuna, as well as other species). As
the catchment area for the lower Waikato River below Karāpiro (excluding the major lakes) is
approximately 6,500 km2, approximately 8,500 culverts could be limiting elver recruitment. Some of
these culverts will be more serious barriers than others because they restrict access to larger
amounts and/or quality of habitat upstream and/or are not passable at all flows (Watene-Rawiri et
al. in press).
Mortality at Hydroelectric Dams and Flood Pumps
Given that factors out in the ocean that may adversely affect eel reproduction and migration are
beyond our control, options to support the long-term sustainability of our tuna populations should
be focused around maximising the number of eels, particularly large longfin females, that can safely
reach the sea. By far one of the most serious issues for taonga species resource managers to address
in the immediate future is the significant loss of pre-migrant and migrant eels as they pass through
and are killed by turbines at flood control schemes and hydroelectric dams throughout Aotearoa-NZ.
Once eels reach sexual maturity they begin their downstream migration. Where barriers such as
hydroelectric dams are present, passage can be at best interrupted or blocked, but in most cases
passage results in serious injury or death (Figures 16 & 17). Since longfins are the species that
penetrate farthest inland, the installation of hydroelectric dams has impacted this species the most
by compromising their upstream access.
17100
90
Predicted mortality (%)
80 Arapuni
70 Clyde
60 Matahina
50 Manapouri
40 Roxburgh
30 Karapiro
20 Waipapa
10
0
0 0.2 0.4 0.6 0.8 1 1.2
Length (m)
Figure 13: Estimated mortality of migrating eels of varying lengths, for different hydroelectric stations in
Aotearoa-NZ. The lower mortalities of Karāpiro and Waipapa are due to different turbine types compared to
other stations. (Source: Jellyman 2013). While there have been no specific studies of turbine mortality in
Aotearoa-NZ, generic relationships can be used to estimate the probability of death, considering variables such
as the size of the eel, speed of rotation, head of water, and type of turbine. Large female longfin eels are at
very high risk in such situations (Mitchell & Boubée 1992, Larinier & Travade 2002).
Figure 14: Tuna death row – Some examples of the dead eels that result from hydroelectric operations in
Aotearoa-NZ. (Photos: Ben Chisnall, Mike Holmes, Jacques Boubée).
Information on the timing of downstream migrating adults has been successfully used to reduce
mortality for a variety of fish species at dams and other passage barriers (Benstead et al. 1999,
Achord et al. 2007). In cases where downstream migration can be predicted, implementing
mitigation activities such as targeted netting (Boubée et al. 2001), spillway opening (Watene et al.
2003, Watene & Boubée 2005), or bypass opening (Boubée & Williams 2006) has resulted in reduced
injury and mortality rates. However, predicting migration is difficult, especially in rivers whose flow
patterns are regulated by storage and generation schedules (Haro et al. 2003).
18When downstream migrant eels are confronted with a dam, studies (e.g., Durif et al. 2003, Watene
et al. 2003) have shown that they spend time searching along the headrace, presumably for an
unobstructed pathway downstream. Some eels that are unable to find a pathway have been shown
to return upstream, often to the location where they were residing previously (Watene et al. 2003).
Many migrants impinge on screens or enter station intakes, and are killed during passage through
the turbines (see Figure 17).
At present, none of the hydroelectric dams in Aotearoa-NZ has been specifically equipped to protect
the downstream migration of sexually mature eels. However, some retrofitting and mitigation
activities have been implemented in the last ten years to protect and/or safely pass migrants (e.g.,
Wairere Falls Power Station, Boubée & Williams 2006). Ceasing generation completely during major
downstream migration events, whilst also providing permanent bypass facilities and protective
measures at intakes is the ultimate way of providing safe downstream passage for tuna. Some of the
options available to operators to facilitate the safe downstream passage of eels at hydroelectric
dams include: (1) Ceasing generation and actively spilling during migration events; (2) Installation of
fish friendlier turbines; (3) Installation of physical and behavioural deterrents; (4) Installation of
bypasses (e.g., Wairere Falls/King Country Energy); and (5) Trapping large eels above hydro stations
and transferring them to locations downstream that are safe from harvest and have open access to
the sea (e.g., Manapōuri and upper Waitaki/Meridian Energy) (Paterson 2010b).
Connectivity within many Aotearoa-NZ catchments has been substantially altered by stop banks,
floodgates and pumping stations. In the lower Waikato alone it is estimated that about half of the
32,000 hectares of floodplain has been protected by stop banks, which in turn has markedly reduced
natural floodplain habitat. Each station generally has a gravity flap/floodgate (Figure 18) which is
designed to prevent flows from the main river channel entering the pockets during elevated river
levels. During floods, much of the land behind stop banks is actively pumped (in some cases the
upstream land is below the receiving water so the pumps are operated more often). At pumping
stations the downstream migration of large adult migrant eels is impeded in two ways: (1) Eel
mortality through entrainment in scheme pumps; and (2) Impediments to migrant movement into
the main river channel during periods of oxygen depletion in the pocket areas following significant
storm events (where the river has spilled into the pockets).
Eel mortality events have been observed by both fishermen and tangata whenua during flood events,
for example in the Hikurangi Repo (Wairua River catchment), where Chetham and Shortland (2009)
describe the rivers downstream of the pumps “churning with white mutilated bodies of eels”… and
“estimated that each pump kills 100 of kilograms, if not tonnes of eel over a 24 hour period” (Alan
Gardiner, pers. comm. in Chetham & Shortland 2009). There is also evidence of chopped mature eels
downstream of the pump stations (Figure 18). Whangārei District Council are undertaking
investigations on eel movements through the Mountain Pump Station in the Hikurangi Swamp
Scheme (Twose 2016).
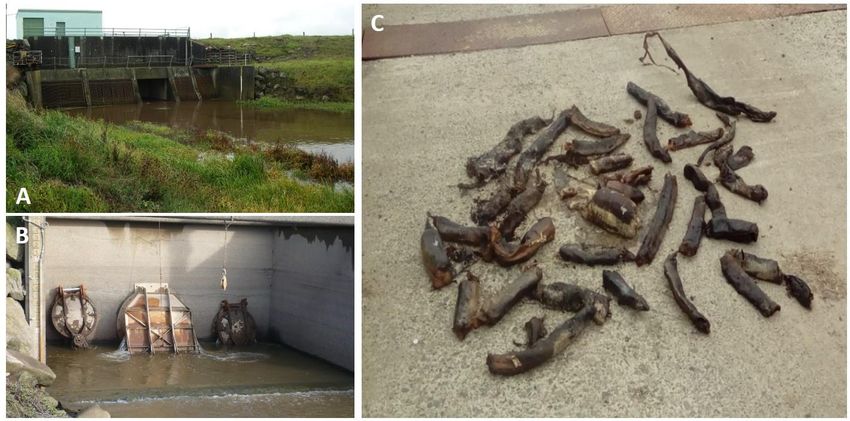
19Figure 15: Examples from the Hikurangi Swamp Scheme. (A) A pump station inlet; (B) Flood gates on a
pump station outlet; and (C) Some of the tuna killed by one of the Hikurangi pump stations during a flood
event in March 2017. (Photos: Jacques Boubée, Alan Halliday). For more information about this particular tuna
mortality event, see https://www.maoritelevision.com/news/regional/whangarei-water-turbines-kill-eel-
numbers.
In the Waikato, apart from one Archimedes screw pump which only operates at very high flows, the
remaining 65 flood pump stations installed do not allow the safe downstream passage of adult tuna
(Watene-Rawiri et al. in press). Replacing or modifying flood pumps to make them tuna friendly
would allow the safe escape of adult spawners, for example, from an estimated 600 km of waterways
in the lower Waikato (i.e., 6% of the total length of waterways downstream of Karāpiro Dam). We
understand that the Waikato Regional Council are currently doing some research into the use of
passive integrated transponder tags and acoustic hydrophones to document eel movement and
mortality through non-gravity fed axial pumping stations in the lower Waikato River catchment. An
update on this work will be presented at the forthcoming New Zealand Freshwater Sciences Society
Conference to be held University of Waikato in November 2017.
To remedy the adverse effect of flood pumps on downstream migrating tuna it will be necessary to
install a safe downstream passage route and fine screens (20 mm spacing or less) to prevent the tuna
from entering each pump. In the future behavioural barriers (e.g., light, electricity) could be
considered if shown to be effective. The screens need to have enough surface area so the through-
screen water velocities remain below 0.5 m/s and do not cause the tuna to impinge on the screens.
Screens may require automated screen cleaners to ensure their efficiency. At tide and flood gates,
safe downstream passage routes can be provided by either: (1) One or more flap gates that provide a
safe route once the downstream water level recedes (note that a mechanism to keep this flap gate
open at low flows is essential and when the gate is closed it must not delay the migration); (2) One or
more tuna-friendly pumps such as a Ventura pump or an Archimedes Screw pump; or (3) Catch/trap
and transfer of adult migrants (Watene-Rawiri et al. in press).
3.5.3 Land and Infrastructure Management
Much of the low-lying land in Aotearoa-NZ requires drainage to be used for pastoral purposes.
Beentjes et al. (2005) collated information on the extent of drain cleaning practices (e.g., Figure 19)
throughout Aotearoa-NZ; the total estimated length of waterways cleaned in Aotearoa-NZ each year
is about 15,500 km, most of which (66%) are drains, followed by stock water races and natural
waterways (12 %) (Beentjes et al. 2005). However, in unrated catchments, landowners can carry out
20their own drain clearance activities (within the region’s respective rules), so the length of cleared
waterways could be much larger than this.
Beentjes et al. (2005) state that three councils carry out nearly half the total length of waterways
cleaned in Aotearoa-NZ: Waikato Regional Council (22%), Selwyn District Council (16%), and
Environment Southland (11%). The frequency with which waterways are cleaned is highly variable,
ranging from several times per year to once every 10 years, or as required, and most common
methods used are herbicide spray and mechanical excavation (Beentjes et al. 2005).
Figure 16: Drain clearance activities in the Hikurangi Repo. (Photo: Whangārei District Council).
There are few published studies in Aotearoa-NZ that have attempted to quantify or document the
effects of mechanical or chemical drain cleaning on mortality of tuna (e.g., Allibone & Dare 2015) and
the results are inconclusive. Anecdotal evidence indicates that eels are frequently scooped out of
drains by mechanical excavators and that some operators dump them on the bank side where they
die if they are unable to return to the watercourse. Complaints from the public about destructive and
poorly monitored land management practises are turning up in the media more frequently (e.g., 4, 5,
6
). Drain Maintenance Technical Guidance (Greer et al. 2015) has been produced by DOC for RMA
and concession applications and provides the following recommendations for conditions and
mitigation activities of relevance to longfin tuna:
• During weed cutting and mechanical excavation operations the consent holder shall ensure any
stranded fish, kōura and kākahi are returned to the waterway. All fauna shall be released
upstream of the affected section of waterway, or, where this is impractical (e.g., appropriate
upstream release sites cannot be easily accessed), in a downstream section of the waterway
that is below the mixing zone and does not have elevated levels of suspended sediment—to
avoid exposing fauna to sediment-induced anoxia (lack of oxygen) when returned to the water.
• If a species listed as threatened under the New Zealand Threat Classification System is recovered
during excavation or weed cutting in a waterway that is not previously known to contain that
species, works in the area the fish was discovered shall cease immediately.
4
Sediment cleaning under review (http://www.stuff.co.nz/marlborough-express/news/5594063/Sediment-cleaning-under-review);
5
Council apologises after dozens of dead eels found in protected pond (https://www.tvnz.co.nz/one-news/new-zealand/council-
apologises-after-dozens-of-dead-eels-found-in-protected-pond-6245239); and
6
The destruction of the river erosion control programme (http://wairarapareviews.kiwi.nz/environmental/river-erosion-programme/).
21• If Threatened or At Risk (i.e., longfin tuna, lamprey, īnanga, shortjaw kōkopu, giant kōkopu, and
kōaro) fish are known to be present in the waterway, or the waterway is known or expected to
contain a large fish population, a person shall be present at all times to return any stranded fish
to the waterway.
3.5.4 Contamination and Safe to Eat
While fish are an important part of a balanced and healthy diet, nearly all fish species contain traces
of metals like mercury and other contaminants (that occur both naturally and because of human
activities) that may build up over time and pose a risk to human consumers. Many toxic
contaminants are stored in the lipids (or fats) of biota and can biomagnify up through the food chain,
increasing the risk to humans of consuming long-lived, higher predatory animals, such as tuna.
Generally, bioaccumulative contaminants of most concern include organochlorine pesticides
(especially DDTs and dieldrin), polychlorinated biphenyls (PCBs) and dioxins (particularly near timber
treatment plants), pentachlorophenol, and selected heavy metals such as mercury, arsenic,
cadmium, and lead.
A range of chemical contaminants enter our waterways, including direct inputs from industrial and
municipal wastewater discharges, and indirectly via diffuse source inputs and natural background
inputs of geothermal contaminants. Geothermally-derived arsenic (As) and mercury (Hg) naturally
enter catchments like Taupō-nui-a-Tia, Waikato River, Te Arawa Lakes, Kaituna River, and Waiaruhe
River. For example, a major point source of geothermally-derived contaminants enters the upper
Waikato catchment from the Wairakei Geothermal Power Station, and much of these contaminants
are thought to accumulate in the sediments of Lake Ohakurī. There are several other locations down
river including Mangakino, Hamilton and Waikare where small natural geothermal sources may still
be producing naturally-derived metal contaminants (NIWA 2010).
Mercury is of concern because of its ability to biomagnify through the food chain. Surveys of trout
from the Waikato River in the 1990’s found that Hg levels exceeded health regulations in only 11 of
the 285 fish sampled; however, comparison with accepted daily intake values indicated that some
sites "could conceivably pose some threat to human health". Eels live considerably longer than trout
(30–50+ years versus five years), so could potentially accumulate more Hg than trout and be of
greater risk to high consumers. In addition to metal contaminants, it is known that quantities of DDT
and other pesticides were historically used throughout Aotearoa-NZ to control grass-grub on pasture
and lice in cattle. At this stage, it is not clear if these residues are potential sources of concern and if
so which catchments are most affected. To date “contaminants in kai” risk assessment studies, which
also considers the actual consumption rates of whānau, have been completed with the Te Arawa
Lakes Trust, Te Rūnanga of Arowhenua and the Te Waihora Management Board (e.g., Stewart et al.
2011, Phillips et al. 2014, Stewart et al. 2014).
3.5.5 Disease and Parasites
All fish carry pathogens and parasites usually at some cost to the fish. Fish can be exposed to various
pathogens and/or parasites depending on the habitat they are living in or at different stages of their
life cycle (i.e., fish are exposed to different parasites depending on their diet which may change as
they get bigger). In Aotearoa-NZ there has been little transfer of new organisms, brought into the
country by introduced species, into native fishes (Boustead 1982, Duignan et al. 2003).
Across all our indigenous fish fauna a total of 65 different species of parasites have been reported, six
of which are introduced (Hine et al. 2000). To date 36 different parasite species have been reported
in Aotearoa-NZ shortfin and longfin eel populations (e.g., Hewitt & Hine 1972, Hine 1978, Hine et al.
2000, Duignan et al. 2003). Over the last 30 years infectious diseases have not been observed to have
caused a significant morbidity or mortality event in our indigenous fish populations (Duignan et al.
2003). However, to the best of our knowledge, there is no regular surveillance programmes
22monitoring the incidence of pathogen/parasite prevalence in our freshwater taonga species
populations; the last survey occurred around 2003 (Duignan et al. 2003). The presence/absence of
visible parasites could be monitored by communities using the parasite infestation index outlined in
Richardson (1998), where each individual eel examined receives a parasite infestation ranking: 0 = No
parasites present externally or internally; 1 = One or two parasites present; 2 = Numerous parasites
present; 3 = Heavy parasite infestation. Some examples of a few of the parasites observed in tuna
from Tai Tokerau, Waikato and Murihiku waterways are shown in Appendix C.
3.5.6 Predation and Competition
Longfin eels are the largest and longest-lived fish in our fresh waters, and where they are present,
and large enough, they are the top predator. Tuna are opportunistic feeders, usually eating anything
they can find. What they eat depends on their size (and the size of their mouth), the habitat
occupied, and the prey available. Tuna are usually more active at night and rest during the day.
Feeding slows down during cold temperatures (less than 10°C). Small eels eat a range of
invertebrates, including small insect larvae, worms, snails, midges, shrimp, molluscs and crustaceans,
although small eels themselves are predated upon by larger eels and birds (e.g., shags, herons). As
their mouths get bigger, tuna eat larger animals such as kōura, fish, small birds, mice and rats (e.g.,
Jellyman 1996, Sagar & Glova 1998).
As previously mentioned, flooded river margins are important feeding grounds for eels. During a
flood, eels will move out of the main river channel to the margins where they will feed on organisms
not usually found in the water, like earthworms, spiders and beetles (Chisnall 1987; 2000b).
Introduced fish such as trout, perch, gambusia, rudd, catfish, koi carp, and tench continue to spread
within Aotearoa-NZ. These pest species can impact eel populations through competition for food
resources, degrading habitat and reducing biodiversity (Rowe 2004).
3.5.7 Acclimatisation Societies
As a result of European settlement, acclimatisation societies were set up to facilitate, implement and
maintain a host of plant and animal introductions into Aotearoa-NZ waterways, including salmon and
trout, for the benefit of recreational fishers. McDowall (2011) contends that even if Māori were
consulted at the time (they generally weren’t), no one could have predicted the way acclimatisation
societies and trout populations proliferated and impacted Aotearoa-NZ’s indigenous fisheries; thus,
impacting whānau who relied on taonga freshwater fish species for food and made living long
distances inland possible for many.
Eels were promoted by these societies as the enemy of trout. For example, in 1933, a acclimatisation
society ranger advised “Where infestation is bad it is possible to wade up a stream beheading the eels
in one’s stride.” In 1943, the Wellington Acclimatisation Society printed on their fishing licenses that
“Every angler should make war on eels.” (Parliamentary Commissioner for the Environment 2013,
and references therein). Acclimatisation societies, with the support of government agencies, declared
tuna to be ‘public vermin’, launching massive extermination campaigns in some regions from the
1930s to 1950s. For example, in South Canterbury, the Acclimatisation Society reported the death of
4,270 eels in 1934 using eel baskets that had been distributed to farmers. During the 1960’s,
although the intensive eel destruction campaigns had finished, many regions still had a bounty on
eels, to encourage people to kill them (Jellyman 2013). Research was carried out on the effect of eels
on a trout population which showed that the presence of eels, especially longfins, was useful in
stopping trout from becoming over-populated and having fisheries stocked with numerous small,
stunted trout rather than fewer large trout of angling size (Burnet 1968), so eels actually helped to
maintain a higher value trout fishery. This knowledge effectively stopped the bounty system on eels
(Jellyman 2013).
23You can also read