U.S. AGRICULTURE & TIMBER MARKET UPDATE - AGRICULTURAL FINANCE & INVESTMENTS 2021
←
→
Page content transcription
If your browser does not render page correctly, please read the page content below

AGRICULTURAL FINANCE & INVESTMENTS

U.S. AGRICULTURE &
TIMBER MARKET UPDATE
2021

                                     1 >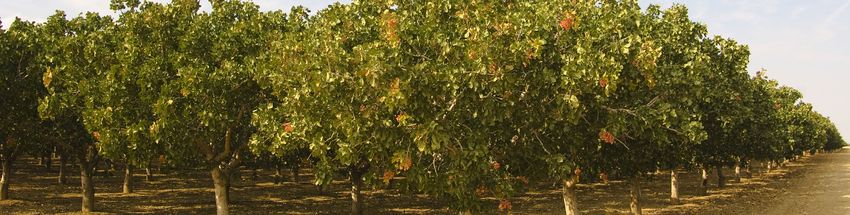
EASTERN               CENTRAL   WESTERN             TIMBER        CONTACTS               APPENDIX

TABLE OF CONTENTS

            EASTERN                CENTRAL                    WESTERN                             TIMBER

 OVERVIEW                 OVERVIEW                      OVERVIEW                         OVERVIEW
   Eastern Region          Central Region                Western Region                   Timber
   Real Estate             Real Estate                   Real Estate                      Real Estate

 COMMODITIES              COMMODITIES                   COMMODITIES                      COMMODITIES
   Citrus                  Corn                          Wine Grapes       Walnuts        Timber East Region
   Sugar Cane              Soybeans                      Table Grapes      Pistachios      Timber West Region
   Pecans                  Wheat                         Avocados          Apples
   Blueberries             Cotton                        Citrus            Hazelnuts

                           Rice                          Almonds           Dates

                                                                                                                          2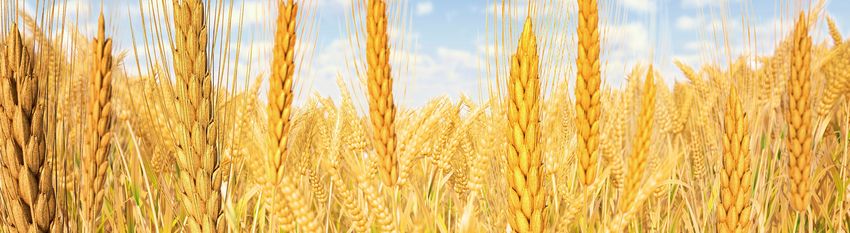
EASTERN              CENTRAL              WESTERN                TIMBER             CONTACTS   APPENDIX

 EXECUTIVE SUMMARY
• Th
   e National Council of Real Estate Investment Fiduciaries, or NCREIF, Farmland Index (NFI) ended 2020 with a total
  market value of $12.3 billion — an increase of 7.9% over year-end 2019. The farm properties comprise 904 row crop
  properties with a market value of $7.4 billion and 280 permanent planting properties with a market value of $4.9 billion.
• T
   otal NFI returns for 2020 were 3.08% — down 173 basis points from last year, comprising 3.29% income and minus
  0.20% appreciation returns. That total NFI performance for 2020 yielded the lowest annual return since 2001 based on
  impacts caused by the COVID-19 global pandemic and low commodity prices. In the permanent cropland category,
  total returns for 2020 were 1.27% — down 421 basis points from the previous year and comprising 3.01% income
  and minus 1.70% appreciation. In the row crop category, total returns for 2020 were 4.20% — down 20 basis points
  from 2019 and comprising 3.39% income and 0.79% appreciation returns. From a commodity perspective, the NFI’s
  performance for annual row crops and pistachios had positive total returns — at 3.53% and 15.28%, respectively, and
  almonds (minus 0.88%), apples (minus 7.47%) and wine grapes (minus 2.75%) experienced negative total returns.
• Th
   e COVID-19 pandemic greatly affected the agriculture economy in 2020. There were labor shortages, disruptions
  in the logistics supply chain and, perhaps most significant, the impact on pricings of crops destined primarily for
  the U.S. food service and hospitality sectors such as lemons and avocados. The overall share of consumer spending
  on food at home (food obtained at grocery stores, supercenters and other retailers) as a share of total U.S. food
  spending rose in 2020 to levels as high as 66% of overall spending as the pandemic altered food-spending patterns.
• T
   ariffs and trade agreements continue to affect farm income. However, there does appear to be some optimism because
  commitments based on the Phase One agreement with China are being implemented. The U.S. Department of
  Agriculture (USDA) said in October 2020 that China had purchased 71% of the target under the agreement. According
  to the Office of the U.S. Trade Representative, President Biden is expected to keep tariffs in place for now with China.
• U
   .S. agricultural exports in fiscal year 2021 are projected to be a record $157.0 billion — up $21.3 billion from fiscal
  year 2020 — which will be driven primarily by expected higher exports of soybeans, corn, wheat and cotton, according
  to recent USDA projections. U.S. agricultural exports to China are forecast to be a record $31.5 billion, and China is
  expected to remain the largest U.S. agricultural market, followed by Canada and Mexico.
• In the Midwest, farmers experienced an overall good growing season, with the exception of rare windstorms in mid-
   August 2020 that damaged 14 million acres of corn and soybean fields primarily in Iowa. Because of tight global supplies
   and strong export demand from China, corn and soybean prices are projected to reach seven-year highs. The USDA is
   projecting a record 180.3 million corn and soybean planted acres in 2021.

                                                                                                                                              3
EASTERN              CENTRAL              WESTERN                TIMBER             CONTACTS   APPENDIX

EXECUTIVE SUMMARY (CONTINUED)
• A
   ccording to the USDA, total Florida processed orange production for the 2020/21 crop season is now projected at 54
  million boxes — down 6% from the initial forecast in October 2020 and down 20% from the 2019/20 crop season.
  Most of the decline is being observed in early-season oranges, which have continued to have significant fruit drop
  throughout most of the state’s citrus groves, as reported by several growers. Because of lower domestic production and
  less imports from Brazil and Mexico, pricing is expected to be up from last year, with the pricing of early- and midseason
  varieties forecast at $1.69 per pound solid, and Valencias forecast at $2.31 per pound solid for the 2020/21 season.
• F
   or the 2020/21 marketing year, the USDA estimates U.S. tree nut production of almonds, walnuts and hazelnuts will
  be up from last year because of increased bearing acreage.
• G
   reen initiatives are driving organizations to find more-efficient, sustainable and ecofriendly ways of producing
  their products with a view to reducing greenhouse gas emissions in order to help offset the impact of climate
  change. Agriculture production is a natural place to start implementing carbon sequestration because healthy soils
  are made up of organic matter (carbon), and the plants grown in the soil pull carbon dioxide from the atmosphere.
  Carbon-trading platforms are evolving that enable growers to sell carbon credits for every ton of carbon sequestered.
• F
  armland has the potential for alternative uses that would generate higher investment returns. Renewable-energy
  opportunities continue to interest companies focused on enhancing their clean energy strategies. PGIM Real Estate has
  learned of interest in solar easements, leases, or outright purchases of the row crop land it manages.

                                                                                                                                              4
EASTERN               CENTRAL               WESTERN                 TIMBER             CONTACTS                APPENDIX

                                                       The sugarcane industry was able to conclude           Because of the pandemic’s shifting many Americans
        EASTERN REGION                                 its harvest for the 2019/20 season before the         to spend more time at home, consumers have
                                                       shutdowns caused by the pandemic became able          become more health conscious in an effort to stay
       Our Overview of the Agricultural                to affect any of the crop’s harvesting efforts.       free of illness from COVID-19. There has been an
             Real Estate Market                        Because farming has been deemed essential             increased awareness of the benefits of vitamin C
                                                       business, operations for the 2020/21 season could     and its direct contribution to a healthy immune
The COVID-19 pandemic has affected Florida             continue, and the crop is expected to increase        system. The consumer trend toward healthier foods
agriculture — primarily vegetable growers who          from the previous season. Domestic sugar              coupled with food services’ closings has driven
were major sellers to the food service industry. The   policy continues to prevent massive dumping           consumers to spend more time at the grocery store.
pandemic caused many of the producers that were        of foreign sugar into the United States, thereby      As a result, orange juice sales in the retail sector
selling to food service companies to market their      enabling producers to operate in a better pricing     have increased. In fact, demand has increased for all
crops to grocery stores instead in order to capture    environment for both raw and refined sugar.           varieties of juice such as orange juice, lemonade and
the increased demand from the work-from-home                                                                 other citrus juices on the market. The latest Nielsen
                                                       Georgia pecan production was able to rebound          reports for the 2020/21 season show that 35 million
environment. Florida agriculture experienced a
                                                       from the hurricane years of 2018/19, and pecan        gallons of orange juice have been sold, which
quiet year with regard to severe weather events.
                                                       production quantity and quality increased for         represents a 10% increase over the 2019/20 season.1
Four storms (Isaias, Laura, Sally and Eta) made
                                                       the 2020 harvest. Initial concerns arose around
close encounters with the state but did not affect                                                           Farmland values in Florida continue to hold
                                                       Chinese demand for U.S. exports with regard to
citrus or other agricultural production. The                                                                 steady. Few transactions of note occurred in 2020
                                                       Chinese New Year, ongoing social restrictions
2020/21 citrus production outlook was positive,                                                              because worries about the pandemic and the 2020
                                                       and continued tariffs. But those concerns have
with the USDA confident that production was                                                                  presidential election created uncertainties about the
                                                       been mostly put to rest because China’s appetite
stabilizing; but expected yields are down 20% from                                                           land market.
                                                       for U.S. pecan exports increased 76% to 27
the 2019/20 season, driven primarily by weather
                                                       million pounds season to date (September 2020 –
conditions that promoted fruit drop and loss of
                                                       February 2021) from the prior year.
crop — especially for the early-season oranges.

                                                                                                                                                                     5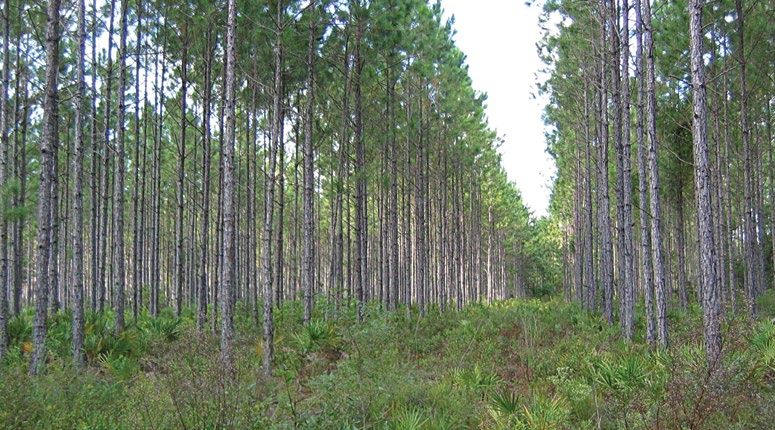
EASTERN CENTRAL WESTERN TIMBER CONTACTS APPENDIX
The 2019/20 pricing of juice oranges fell CITRUS Historical and Projected Production for Florida Citrus by Main
below the 10-year average price of $1.85 per Varieties, 2015/16 Through 2020/21F
pound solid for earlies and mids and below
$2.11 per pound solid for Valencias. The 50
50,000,000
(In Hundred Thousands)
2019/20 season end pricings were $1.02 for 45
45,000,000
40
40,000,000
90 - Pound Boxes
early and mids and $1.23 for Valencias. The
35
35,000,000
large price decrease was attributed to large 30
30,000,000
juice inventory held in storage by processors, 25
25,000,000
who carried it over from the aftermath of 20
20,000,000
CITRUS Hurricane Irma in 2017. With a reduced
domestic crop during the year after the
15
15,000, 000
10
10,000,000
hurricane, juice processors bought juice 5, 000,0005
An Overview of the from Brazil and Mexico so they would have
00
Early/Mids Valencia Colored
ColoredGrapefruit White
White Grapefruit
Eastern U.S. Orange Market a guaranteed supply. With the orange crop’s
Early/Mids Valencia Grapefruit Grapefruit
recovery in 2019/20, many farmers who did 2015/16 2015/162016/172016/17 2017/18
2017/18 2018/19
2018/19 2019/2020
2019/20 2020/21F
2020/21F
Florida orange production for the 2020/21 not have long-term committed contracts
season is forecast at 54 million boxes — down were unable to enjoy prices above the 10-year
20% from the 2019/20 season (67 million average price, receiving prices not seen since
boxes) and down 6% from the initial forecast. 2008/09. For the upcoming 2020/21 season,
The decline in yields stems from the fact that foreign juice inventory is expected to be lower, CITRUS Historical Prices of Citrus by Fruit, 2015/16 Through 2020/21F
early- and midseason varieties of oranges have coupled with a slight increase in consumption
based on perceived health benefits of orange $4.00
$4.00
experienced significant fruit drop and lower
juice propagated by the pandemic. For the $3.50
Price Per Pound Solid
$3.50
quality. The fruit drop is driven by warmer
temperatures, is caused by above-average 2020/21 season, early and mids pricing $3.00
$3.00
rainy conditions in the fall of 2020 and is is forecast at $1.69 per pound solid, and $2.50
$2.50
exacerbated by the greening disease affecting Valencias are forecast at $2.31.3 $2.00
$2.00
trees’ health, which lowers trees’ ability to $1.50
$1.50
hold fruit. Florida continues to be the top The USDA projects 2020/21 grapefruit $1.00
$1.00
producer of juice oranges in the United States, production will be 4.60 million boxes, $0.50
$0.50
with an estimated harvest of Valencia oranges resulting in a 5% decline from the 2019/20 $- $0
of 33 million boxes — down 12.4% from the season of 4.85 million boxes. Production is 2015/16
2015/16 2016/17
2016/17 2017/18
2017/18 2018/19
2018/19 2019/20
2019/20 2020/21F
2020/21F
previous season. The harvest of non-Valencia expected to increase as the season progresses Early/Mids
Early/Mids Valencia
Valencia Whit e Grapefrui
Colored t
Grapefruit Colored
White Grapefruit
Grapefruit
oranges for the 2020/21 crop is estimated at during the first quarter of 2021, and growers
22.5 million boxes — down 24.1% from the expect prices of around $2.20 per pound solid.
previous season because of heavy fruit drop
that occurred in early varieties of oranges.2
Source: USDA, NASS, Florida Citrus Mutual, PGIM Real Estate Research
6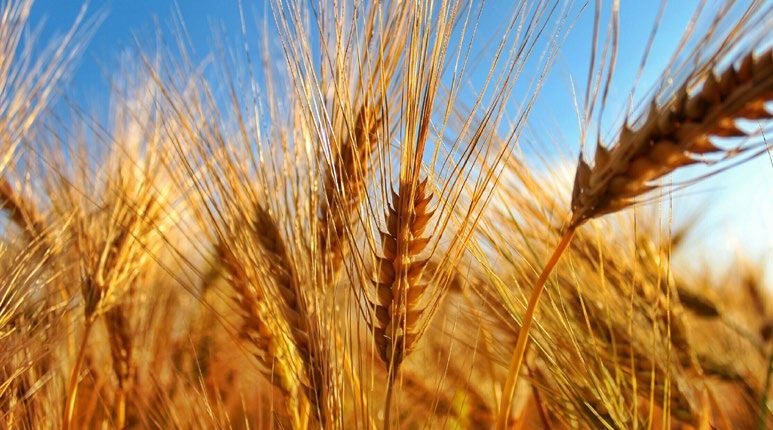
EASTERN CENTRAL WESTERN TIMBER CONTACTS APPENDIX
U.S. consumption continues to climb to 11.0
MMTRV for 2020 compared with 10.8 for
SUGARCANE Historical U.S. and Global Sugar Prices, 2000
Through 2021YTD
2019, which can be attributed to the diets
of Americans who favor sugary foods. U.S.
$45
45.00
consumption overshadows U.S. production,
$40
40.00
leaving an average deficit of 2.8 MMTRV for
$35
35.00
2019/20 of sugar that has to be imported into
Cents Per Pound
the country to meet demand (imports account 30.00
$30
for 26% of total domestic sugar supply). $25
25.00
U.S. sugar consumption consists of 37% as 20.00
$20
packaged sugar, 23% in bakery and cereal $15
15.00
products, 11% in confectionary goods, 15% in $10
SUGARCANE
10.00
processed foods, 7% in dairy products and 7% 5.00$5
in beverages.5 0.00$0
An Overview of the
2017
YTD
2000
2010
2020
2009
2019
2006
2008
2016
2018
2001
2011
2005
2015
2003
2013
2002
2012
2004
2014
2007
2000
2001
2002
2003
2004
2005
2006
2007
2008
2009
2010
2011
2012
2013
2014
2015
2016
2017
2018
2019
2020
2021YTD
Eastern U.S. Sugarcane Market Global production for the 2020/21 marketing
2021
year is forecast at 182 MMTRV because U.S. Raw Sugar Prices World Raw Sugar Prices
US Raw Sugar Prices World Raw Sugar Prices
The 2020/21 Florida harvest of sugarcane of higher production in Brazil, India, the
started in October 2020 and is expected to European Union (EU) and Thailand. Brazil’s
finalize by May 2021. Projected production production is expected to be 42 MMTRV
SUGARCANE Historical Global Sugar Production and Consumption
for the season is 1.93 million metric tons raw because of favorable weather conditions. 2000/01 Through 2020/21F
value (MMTRV) based on favorable growing Approximately 48% of the sugarcane harvested
conditions in Florida, which are enabling will be processed for sugar, with the remaining 250,000
250
producers to attain a higher yield of 48.1 tons 52% allocated to ethanol processing. India
per acre higher than the national average of 37.6 and Thailand are also experiencing favorable 200,000
200
tons per acre. Because of domestic policy that growing conditions because of above-average
MMTRV
water reservoir levels that are boosting yields 150
15 0,000
implements marketing allotments, tariff-rate
quotas and indirect price supports, the 2020 and cane extraction rates. The EU is forecast
100,000
100
average price of raw sugar in the United States to grow 2.5% more sugar at 17.7 MMTRV
was 26 cents per pound versus the world price despite a reduction in overall growing areas. 50,000
50
of 12 cents per pound. Projections for 2020/21 Consumption in those countries continues to
show that the price of raw sugar will see a small grow as consumers demand more and more 00
2003/04
2009/10
2008/09
2017/18
2005/06
2015/16
2000/01
2010/11
2004/05
2014/15
2002/03
2012/13
2001/02
2011/12
2013/14
2020/21F
2006/07
2016/17
2019/20
2018/19
2007/08
sugary foods.6
2020/21F
increase both domestically and worldwide driven
2000/01
2001/02
2002/03
2003/04
2004/05
2005/06
2006/07
2007/08
2008/09
2009/10
2010/11
2011/12
2012/13
2013/14
2014/15
2015/16
2016/17
2017/18
2018/19
2019/20
by rising consumption.4
Production Consumption
Production Consumption
Source: USDA, ERS, PGIM Real Estate Research
7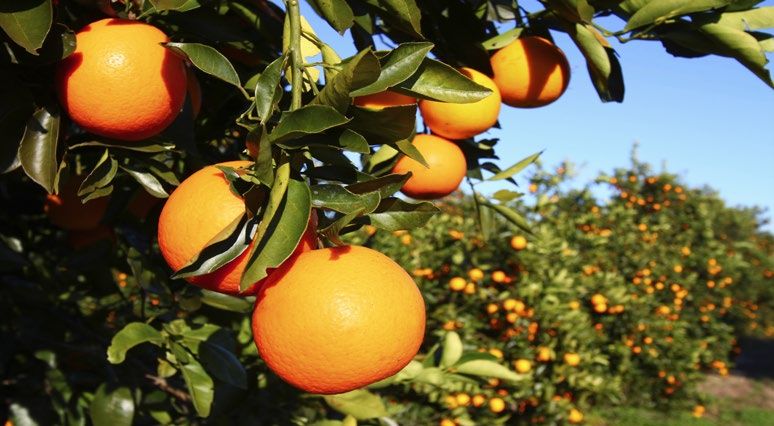
EASTERN CENTRAL WESTERN TIMBER CONTACTS APPENDIX
Prices in 2020 ranged from $0.60 to PECANS U.S. Price per Pound of Pecans In Shell, 2011/12
$2.40 per in-shell pound based on the Through 2020/21F
variety and size of pecans, according to
the University of Georgia Extension. The $3.00
$3.00
weak price environment raises challenges $2.59
$2.59
$2.43
$2.43
from a marketing standpoint, with growers $2.50
$2.50
$2.20
$2.33
$2.33
$2.20
preferring to store their production for a few
$2.00
$2.00 $1.84
$1.84
more months to see whether prices rebound $1.75
$ Per Pound
$1.73
$1.73 $1.75
$1.57
$1.57
in the early part of the year. Shelled imports
$1.50
$1.50 $1.32
$1.32
were down 63% from October 2020 to $1.26
$1.26
January 2021, caused mainly by a drought in
PECANS Mexico that affected the supply. Meanwhile,
$1.00
$1.00
the same period saw an 18% increase in $0.50
$0.50
An Overview of the in-shell pecan exports. China is still the top
Eastern U.S. Pecan Market market for U.S. pecans, because it makes up $0.00
$-
over 70% of the in-shell export market — a
2011/12
2012/13
2013/14
2014/15
2015/16
2016/17
2017/18
2018/19
2019/20
2020/21F
2011/12 2012/13 2013/14 2014/15 2015/16 2016/17 2017/18 2018/19 2019/20 2020/21F
Georgia pecan production was able to avoid 75% increase from the prior year.⁹
catastrophic damage from hurricanes during the
2020 season. Georgia growers harvested 142 Total imports were 188 million in-shell
million pounds of pecans from 129,000 acres pounds, which represents a 10% decrease
(32% of U.S. bearing acreage of 402,000 acres), from the prior season, most of which are
coming from Mexico. In the case of exports,
GEORGIA PECAN PRODUCTION
which represented a 94% increase in production
142M
Production in Georgia is expected to see
and a return to production levels observed an estimated 31 million in-shell pounds have
a 94% increase from 2019, which would
before Hurricane Michael (2018) and Hurricane been shipped this season — up 1% from the
be a return to production levels observed
Irma (2017). Pecan trees undergo an alternate same period during last season. The United
before Hurricane Michael and Hurricane
States exported the most pecans to Mexico POUNDS PRODUCED
bearing cycle after a severe weather event, which Irma. Georgia production accounts for
is what occurred with a lighter crop in 2019 — in the 2019/20 season, at 58 million pounds. IN 2020 47% of total U.S. production.
the year after the storm — followed by a heavier Shipments to China accounted for 15% of all
crop in 2020. U.S.-utilized production in 2020 exports in terms of volume for the past season.
+2%
totaled 302 million pounds — an increase of
No major transactions in the real estate pecan
18% over 2019. 7 U.S. PECAN-BEARING ACREAGE
industry occurred during 2020.
Bearing acreage of pecans in the United
Prices have been lower than anticipated States reached 402,000 acres in 2020.
INCRE ASE FROM 2019
because the Asian market has been relatively
slow and the gift-fruit market has been affected
by the pandemic.8
Source: USDA NASS, UGA Pecan Extension, PGIM Real Estate Research
8
EASTERN CENTRAL WESTERN TIMBER CONTACTS APPENDIX
of about 5% to 6% during the 2021–25
BLUEBERRIES Top U.S. Producers of Blueberries, 2015 Through 2019*
period.11 *2020 data not available
180,000
180
In 2020, U.S. fresh blueberry imports
160
160,000
increased to a record 473 million pounds
140
140,000
and has increased by 55% during the past
Million Pounds
120
120,000
four years. To meet the increased domestic
demand, 80% of blueberry imports come 100
100,000
from Peru, Mexico and Chile. The increase 80
80,000
in production in those areas can be attributed 60
60,000
to (1) new cultivars of berries that are 40
BLUEBERRIES acclimated to the regions and (2) foreign
40,000
20
20,000
investors seeking new land to devote to
00
An Overview of the blueberry production. Most of these berries California
California Florida
Florida Georgia
Georgia Michigan
Michigan New
New North
Jersey North Carolina Oregon
Oregon Washington
Washington
are entering the market from January to Jersey Carolina
Eastern U.S. Blueberry Market 2015 2016 2017 2018 2019
March — during the off-season for U.S. 2015 2016 2017 2018 2019
The estimated 2020 total U.S. blueberry blueberries.12
production was 627 million pounds — down
6% from the 2019 record year for domestic
In 2020, U.S. fresh blueberry exports BLUEBERRIES U.S. Fresh Blueberry Imports by Country, 2017
amounted to 59 million pounds — a decrease Through 2020
production.9 Fully 93% of North American
of 26% from 2019. Canada accounted for
blueberry production comes from eight states: 500
500
91% of exports in 2020. U.S. blueberry 473
California, Florida, Georgia, Michigan, 450
459
prices have stayed consistent during the 450 60
New Jersey, North Carolina, Oregon and 83
past 20 years, ranging from $1 to $2 per 400
400 382
Washington. The North American blueberry
pound. New horticultural practices and 350 115
harvest season begins in early March and runs 350 78
Million Pounds
improved varieties have increased the levels of 304
until mid-October. Florida blueberries arrive on 300
300 133
competition. Florida’s prices were once more
the market first, starting in March and running 250
250
77
than $6 per pound but dropped to around 151
113
through May, and Georgia blueberries enter 200
$2.64 per pound in 2019 because Georgia, 200 91
in April followed by the rest of the states.10 132
Chile and Mexico began overlapping harvests 150
150
Consumption of fresh blueberries has grown
with Florida. Florida blueberry producers are 100
100
71
significantly, increasing by 510% from 0.33 184
seeking new horticultural practices to peak 53 151
pounds per capita in 2002 to 2.02 pounds 50
50 82
earlier in the season with higher yields.13 42
per capita in 2019 based on the perceived -0
health benefit of consuming fruits with higher 2017
2017 2018
2018 2019
2019 2020
2020
antioxidant properties. According to Rabobank, Peru
Peru Mexico
Mexico
Chile
Chile
Rest of the World
Rest of the World
U.S. per-capita consumption is expected
to grow at a compound annual growth rate Source: USDA NASS, ERS
9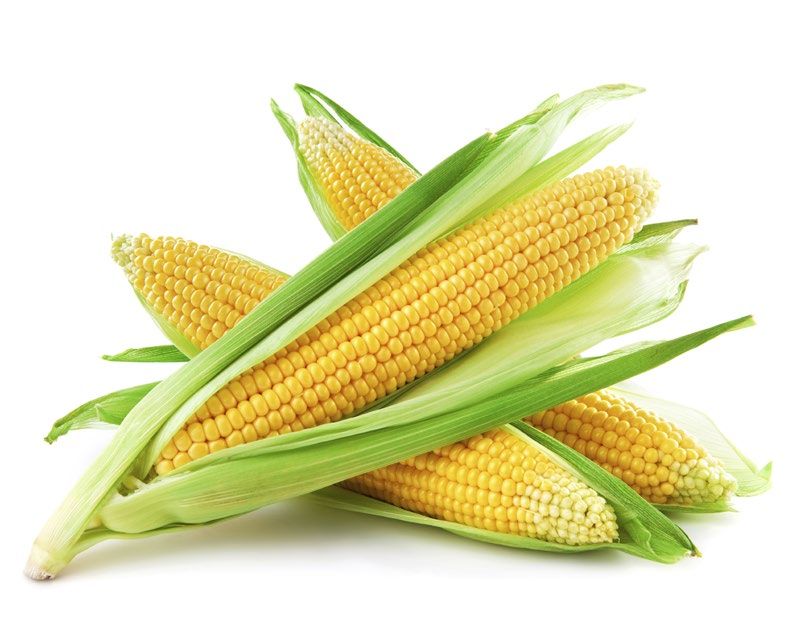
EASTERN           CENTRAL               WESTERN                    TIMBER           CONTACTS                 APPENDIX

          C E N T R A L R E GION                        States averaged $4,100 per acre in 2020, which
                                                        matches all-time highs previously seen in 2015
                                                                                                               Land sales in the central regions have remained
                                                                                                               strong, with land values supported by recent rises
                                                        and 2019.                                              in crop prices coupled with a favorable interest
         Our Overview of the Agricultural                                                                      rate environment. Looking ahead, a rise in rental
               Real Estate Market                       Land values in the Delta states of Arkansas,           rates can be expected because of the strong prices.
                                                        Louisiana and Mississippi held fairly constant
                                                        from 2019 to 2020, increasing only 1%.
Across the corn belt, land values changed very little   Average land value in 2020 was $3,130 per acre
in 2020. Illinois saw the largest value increase:       across those Delta states. The highest value
1.6% to $7,400 per acre. Iowa saw a decline of          per acre is in Arkansas, at $3,350, followed by
1.7% to $7,070 per acre. Overall, cropland value        Louisiana at $3,160 per acre and Mississippi at
in the corn belt averaged $6,350 per acre in 2020.      $2,820 per acre. From 2019 to 2020, Louisiana
The average cropland rental rate in the corn belt       saw the highest increase in land value — 1.3%;
was $202 per acre in 2020, representing a minus         and Arkansas and Mississippi saw increases of
0.5% decline from the previous year. Farmland           only 0.9% and 0.7%, respectively. Along with
in the mid-South was steady to slightly stronger,       an increase in land values, average cropland
with Texas seeing the largest increase: 2.4% to         rental rates in 2020 increased by 2.8% to $115
$2,170 per acre. Cropland value across the United       per acre. 14

                                                                                                                                                                     10
EASTERN CENTRAL WESTERN TIMBER CONTACTS APPENDIX
per bushel — an increase of $0.64 above the
average price in 2019. The 18% increase in CORN Average Monthly Price Received by U.S. Farmers for Corn, January
projected farm price received is due to tight 2010 Through December 2020
global supplies and strong export demand
from China.15 $9.00
$9
$8.00
$8
Global competition from major exporters $7.00
$7
is a continuing trend. Exports from major $6.00
$ Per Bushel
$6
competitors Argentina and Brazil increased $5.00
$5
slightly — from 2.78 billion bushels in $4.00
$4
2019/20 to an estimated 2.87 billion bushels $3.00
$3
in 2020/21. Production in both countries $2.00
$2
increased in 2019, resulting in the increased $1.00
CORN
$1
exports in 2020. The 2019 production is $-
$0
estimated to have increased by 40 million
Oct
Oct
Jan
Jun
Jan
Sep
Aug
Aug
Jul
Jul
Dec
Dec
May
Nov
May
Mar
Apr
Mar
Feb
2010 2011 2012 2013 2014 2015 2016 2017 2018 2019 2020
An Overview of the bushels, from a previous record of 5.98 billion 2010 2011 2012 2013 2014 2015 2016 2017 2018 2019 2020
bushels in 2018, to 6.02 billion bushels in
Central U.S. Corn Market
2019. Projected production for Argentina
CORN Historical Planted and Harvested Corn Acres in the United States,
and Brazil in 2020/21 is expected to increase 2010 Through 2020
In 2020, corn harvest yields saw an increase
even further to 6.16 billion bushels. This is
of 4.5 bushels per harvested acre compared
anticipated to cause continued competition 100.0
100
with 2019. Average corn yield was estimated
with the U.S., as exports from Argentina
at 172.0 bushels per acre — up from 167.5
and Brazil are projected to be 2.87 billion 95.0
95
in 2019 but below 2017’s record yield of
bushels in the year ahead. China is projected
176.4. Slightly increased planted acreage in
to increase imports by 390 million bushels, to 90.0
90
2020 of 90.8 million acres contributed to
Million Acres
689 million bushels in 2020.15
total production of an estimated 14.18 billion
85.0
85
bushels, which was higher than the 13.62
billion bushels produced in 2019. Ending 80.0
80
stocks, because of increased exports and lower
beginning stocks, are expected to decrease to 75.0
75
1.55 billion bushels for 2020/21 — down from
the 1.92 billion bushels that began the 2020 70.0
70
marketing year. Exports in 2020 increased an
2010
2020
2018
2019
2011
2016
2013
2015
2012
2014
2017
2010 2011 2012 2013 2014 2015 2016 2017 2018 2019 2020
estimated 772 million bushels from 2019 to
PlantedAcres
Planted Acres Harvested AcresAcres
Harvested
2.55 billion bushels. The season-average farm
price received for corn is projected to be $4.20
Source: USDA, NASS, PGIM Real Estate Research
11EASTERN CENTRAL WESTERN TIMBER CONTACTS APPENDIX
U.S. prices have strengthened significantly
with the help of increased export demand. The SOYBEANS Historical Average Monthly Price Received by U.S. Farmers
for Soybeans, January 2010 Through December 2020
2020/21 season average farm price for soybeans
was projected at $11.15 per bushel — an $18
$18.00
increase of $2.58 from the 2019/20 average
$16
$16.00
farm price of $8.57 per bushel. In 2020/21,
the domestic stocks-to-use ratio is projected to $14
$14.00
decrease to 3.1% — down significantly from $12
$12.00
$ Per Bushel
13.3% in 2019/20. This was caused mainly by $10
$10.00
an increase in projected exports in 2020/21,
$8
$8.00
rising from 1.68 billion bushels in 2019/20 to
$6.00
$6
2.23 billion bushels in 2020/21.15
SOYBEAN
$4
$4.00
Domestic demand has remained active, $2
$2.00
with U.S. soybean crushing for oil and meal $-
$0
An Overview of the projected to set a record at 2.2 billion bushels
Apr
Apr
Oct
Oct
Jan
Jun
Jan
Jun
Jan
Jun
Sep
Sep
Aug
Aug
Jul
Jul
Dec
Dec
Nov
May
Nov
May
Nov
Mar
Mar
Feb
Feb
2010 2011 2012 2013 2014 2015 2016 2017 2018 2019 2020
Central U.S. Soybean Market — up 35.0 million bushels from last year’s 2010 2011 2012 2013 2014 2015 2016 2017 2018 2019 2020
record.15 Planted acreage for soybeans will be
watched closely by the market because prices SOYBEANS Historical Planted and Harvested Soybean Acres in the
The 2020 soybean crop is estimated to finalize United States, 2010 Through 2020
at 4.14 billion bushels, reflecting a 17% hinge on projected supply and anticipated
increase over the 2019 crop. Soybean acreage export demand. 100
100.0
rebounded from 76.1 million acres in 2019 to 90
90.0
83.1 million acres in 2020 partly as a result
80.0
80
of better weather during the planting season
70
70.0
compared with 2019. Yield per harvested acre
Million Acres
60.0
60
is projected at a near-record 50.2 bushels per
acre — slightly below the 2018 record of 50.6 50.0
50
bushels per acre but above the 47.4 bushels per 40.0
40
acre achieved in 2019. Ending stocks decreased 30.0
30
to an estimated 140 million bushels in 2020 20.0
20
from 525 million bushels in 2019. Despite
10.0
10
near-record yields, an increase in export
demand caused a decrease in projected ending 00.0
2010
2020
2018
2019
2011
2016
2013
2015
2012
2014
2017
stocks — well below 2018’s near-record high 2010 2011 2012 2013 2014 2015 2016 2017 2018 2019 2020
Planted Acres Harvested Acres
of 909 million bushels.15 Planted Acres Harvested Acres
Source: USDA, NASS, PGIM Real Estate Research
12EASTERN CENTRAL WESTERN TIMBER CONTACTS APPENDIX
planted, which was the lowest number of acres
in 110 years.15 WHEAT Historical Average Monthly Price Received by U.S. Farmers for
Wheat, January 2010 Through December 2020
Wheat production globally is projected to be $9
$9.00
28.4 billion bushels in 2020/21 — an increase
$8
$8.00
of 0.3 billion bushels over the 2019/20
$7
$7.00
estimate. The United States is projected to
$ Per Bushel
$6
$6.00
increase exports in 2020/21 by 20 million
$5
$5.00
bushels. Projected production in China and
$4
$4.00
Argentina is reduced but is offset by increased
$3
$3.00
production in Russia. Demand for wheat
$2
$2.00
continues to remain strong in China and
$1
$1.00
the United States for feed and residual use,
WHEAT supporting competitive prices. Higher wheat $0
$-
Jan
Jan
Jan
Sep
Sep
Jul
Jul
May
May
Apr
Mar
Apr
Mar
Oct
Oct
Jun
Jun
Jun
Feb
Feb
Aug
Aug
Dec
Dec
Nov
Nov
Nov
2010 2011 2012 2013 2014 2015 2016 2017 2018 2019 2020
prices also support a projected increase in 2010 2011 2012 2013 2014 2015 2016 2017 2018 2019 2020
An Overview of the consumption in China. Global ending stocks
Central U.S. Wheat Market are projected to increase to 602 million bushels
in 2020/21 from the estimated 2019/20
ending stocks of 11 billion bushels with WHEAT Historical Planted and Harvested Wheat Acres in the United
Production for the 2020/21 crop year
States, 2010 Through 2020
is projected at 1.83 billion bushels — a increased production.15
5.5% decrease from the estimated 2019/20 60
60.0
production of 1.93 billion bushels as a result
of lower average yields and lower planted 50
50.0
acres. Wheat acreage is projected to decrease
by 2.6% — from 45.5 million acres estimated 40
40.0
Million Acres
in 2019/20 to 44.3 million acres in 2020/21.
Average yields are projected to decrease by 4% 30
30.0
to 49.7 bushels per acre. Lower production
20
20.0
estimates are resulting in higher prices, with
a projected average farm price of $4.85 per
10.010
bushel for the 2020/21 crop, which reflects a
6% increase over last year’s average farm price 0.00
of $4.58 per bushel. 16 U.S. winter wheat acres
2017
2010
2020
2018
2019
2011
2016
2013
2015
2012
2014
2010 2011 2012 2013 2014 2015 2016 2017 2018 2019 2020
are projected to be 31.9 million acres in 2021
— an increase of 4% over the 2019/20 acres Planted Acres
Planted Acres Harvested
HarvestedAcres
Acre s
Source: USDA, NASS, PGIM Real Estate Research
13EASTERN CENTRAL WESTERN TIMBER CONTACTS APPENDIX
The year-end estimate for the 2020 upland
cotton price is 59.6 cents per pound and COTTON Historical Average Monthly Price Received by U.S. Farmers
projected to increase 8.4 cents per pound for Cotton, January 2010 Through December 2020
in 2021 based on a projected decline in
production.15 $1.00
$1.00
$0.90
$0.90
The latest 2020 U.S. balance sheet for cotton $0.80
$0.80
shows a beginning stock projection of 7.25 $0.70
$0.70
million bales, which is up 49.5% from 2020’s
$ Per Bushel
$0.60
$0.60
beginning cotton stocks estimation as a result $0.50
$0.50
of higher production in 2019. The 2021 $0.40
$0.40
stocks-to-use ratio for cotton is projected $0.30
$0.30
at 26.2%, which is down from 40% in $0.20
$0.20
COTTON 2020. U.S. cotton exports of 15.25 million $0.10
$0.10
bales projected for 2021 are down 1.8% $0.00
$-
May
May
Apr
Mar
Apr
Mar
Oct
Oct
Jan
Jun
Jan
Jun
Jan
Jun
Sep
Feb
Sep
Feb
Aug
Aug
Jul
Jul
Dec
Dec
Nov
Nov
Nov
An Overview of the from 2020. Global cotton ending stocks are 2010 2011 2012 2013 2014 2015 2016 2017 2018 2019 2020
2010 2011 2012 2013 2014 2015 2016 2017 2018 2019 2020
projected to be 97.52 million bales in 2021,
Central U.S. Cotton Market
which is lower than the projected 99.28
million bales at year-end 2020.17 COTTON Historical Planted and Harvested Cotton Acres in the United
The USDA projects that the United States will States, 2010 Through 2020
produce 14.4 million bales of cotton in 2021,
which is down 25.1% from the 2020 crop 16
16.0
season estimation. It is estimated that in 2020, 14
14.0
13.7 million acres of cotton were planted, with
12
12.0
only 11.61 million acres harvested. Planted
Million Acres
acres are projected to decrease in 2021 to 12.1 10
10.0
million — the lowest in four years because 8
8.0
of strong competition from soybeans, corn,
peanuts and grain sorghum. In 2020, 8.7 6
6.0
million acres are projected to be harvested; the 4
4.0
abandonment rate climbed to 28% in 2020
2
2.0
because of weather conditions. Yields in 2021
are projected to be 825 pounds per acre and 0
0.0
2020
2013
2015
2012
2014
2017
2010
2018
2019
2011
2016
relatively flat from the 2020 estimated yield of 2010 2011 2012 2013 2014 2015 2016 2017 2018 2019 2020
823 pounds per acre.15 Planted Acres
Planted Acres
Harvested Acre s
Harvested Acres
Source: USDA, NASS, PGIM Real Estate Research
14EASTERN CENTRAL WESTERN TIMBER CONTACTS APPENDIX
for long-grain rice for the past five marketing
years. In contrast, 2019’s ending stocks were RICE Historical Average Monthly Price Received by U.S. Farmers for Rice,
at the lowest level in the same time frame. January 2010 Through December 2020
The drastic increase in long-grain-rice ending
$18 .00
$18
stocks is caused by a combination of the 9.4%
increase in U.S. long-grain-rice supply in $16
$16 .00
2020/21 from 2019/18 and the 5.3% decline $14
$14 .00
in total rice use from 2019/20 to 2020/21.
Dollars Per Cwt
$12 .00
$12
Total rice use in 2020/21 actually declined
$10.00
$10
from 169 million cwt in 2019/20 to 160
$8.00
million cwt in 2020/21.18 $8
$6.00
$6
The 2020/21 U.S. all-rice marketing-year
RICE
$4.00
$4
average price is estimated at $13.20 per cwt — $2.00
$2
down 2% from the 2019/20 all-rice marketing
$0$-
An Overview of the price at $13.50 per cwt. U.S. long-grain-
Jan
Jan
Jan
Jan
Jan
Jan
Jan
Jan
Jan
Jan
Jan
Sep
Sep
Sep
Sep
Sep
Sep
Sep
Sep
Sep
May
May
May
May
May
May
May
May
May
May
May
Sep
Sep
2010 2011 2012 2013 2014 2015 2016 2017 2018 2019 2020
Central U.S. Rice Market rice price is projected at $12.00 per cwt for 2010 2011 2012 2013 2014 2015 2016 2017 2018 2019 2020
2019/20 compared with $10.80 per cwt in
2018/19, which is an increase of 13%. U.S. RICE Historical Planted and Harvested-Rice Acres in the United States,
Planted rice acres in 2020 are estimated at medium-grain and short-grain-rice prices are 2010 Through 2020
3.04 million, which is up 19.7% from 2019. projected at $16.30 per cwt compared with
Harvested rice acres are estimated at 2.99 $17.60 per cwt in 2018/19.15 4.0
4.0
million for 2020 — up 21% from 2019’s 2.47
3.5
3. 5
million. Total U.S. rice production forecast for Because rice was exported to China in 2020
2020 is 227.6 million hundredweight (cwt) for the first time, 2020 was a breakthrough
3.0
3. 0
— up 23% from 2019. Average rice yields
Million Acres
year for U.S. rice exports. Going forward into 2.5
2.5
across the United States were up 2.0% in 2020 2020/21, total exports are expected to decrease 2.0
2.0
compared with average U.S. rice yields in to 94 million cwt. Imports are projected to
2019. 18 decrease 3% from 2019/20 to 36.2 million 1.5
1.5
cwt because domestic use is projected to be 1.0
1.0
U.S. ending stocks for all rice are projected higher.15
at 38.4 million cwt for 2020/21, which is an 0.5
0.5
increase of 9.8 million cwt, or 34.3%, from 0
0.0
2019 ending rice stocks. Long-grain-rice
2010
2020
2018
2019
2011
2016
2013
2015
2012
2014
2017
2010 2011 2012 2013 2014 2015 2016 2017 2018 2019 2020
ending stocks are projected at 26.3 million
Planted Acres Harvested Acres
cwt for 2020/21, which is up 92% from Planted Acres Harvested Acres
2019 and marks the highest ending stocks
Source: USDA, NASS, PGIM Real Estate Research
15EASTERN CENTRAL WESTERN TIMBER CONTACTS APPENDIX
WESTERN REGION and impacts of the health pandemic. Buoyed by In Washington and Oregon, overall real estate
strong shipments, logistics notwithstanding, nut activity was a little slower, with values generally
Our Overview of the Agricultural commodity pricing has firmed up through some static compared with the prior year—with one
recent recovery. Lemon pricing was hit particularly exception. Cherry orchard prices strengthened in
Real Estate Market
hard when demand plummeted because the 2020 from a sharper institutional focus. High-
In most respects, 2020 started out as a “normal” food service industry effectively closed due to density apple orchards with consumer-favored
year, including an anticipated uptick in real estate COVID-19 lockdowns throughout the country. varieties are not widely traded, which has resulted
activity that pivoted significantly in the last part of in increased redevelopment activity.
the first quarter and most of the second quarter as In California, a divergence in land values that
the magnitude of the worldwide health pandemic began in 2019 accelerated in 2020 as the market The theme for the wine grape market in 2021 is
became evident. It was not until the third quarter gained more clarity on the impacts of the “uncertain.” Although that’s not what investors
that some semblance of actual normalcy returned to Sustainable Groundwater Management Act. Real want to see, it’s an improvement from the 2020
the marketplace, albeit still subdued in most areas. estate values for plantable land in good water theme of “pivot,” which proved to be a frustrating
Pent-up institutional demand coupled with the usual areas rose dramatically in 2020. Land with surface and costly experience. Bearing acreage is in flux,
lag time between commodity pricing and underlying water has been noted to trade up to 40% more and pricing is beholden to a seller’s outlook on
land values helped steady most of the permanent than land without adequate water —especially the market. Much of the uncertainty will be put
crop values with good water profiles. in Fresno and Madera Counties. Permanent crop to rest by termination of the second quarter once
properties trading in a fairly narrow bandwidth further insights can be gleaned on crop load,
Even though demand for most commodities has coupled with an increase in underlying land values which will create greater confidence in the wine
been strong, pricing trended downward in 2020 created an inverted development curve for many grape vineyard market.
attributable mainly to ongoing trade uncertainties commodities.
16EASTERN CENTRAL WESTERN TIMBER CONTACTS APPENDIX
Previously, industry experts had anticipated
that it would take three to six years to bring WINE GRAPES California Wine Grape Prices by Type, 2010
the wine grape market back into balance. Through 2020
Even with the market back in balance, the
industry could be looking at oversupply 1,100
$1,100
1019 1020
situations in coming years if the industry 966
1,000
$1,000
consistently experiences grape crushes of 893
919
884
over 4 million tons. 22 Industry consultants 900
$900 852
790 795
have recommended that the industry either
$ Per Ton
$800
800
achieve higher sales growth or further remove 708
underperforming grape acreage. Wine sales $700
700 628 625 623 635
WINE GRAPES growth has been flat and is expected to
remain so with the closings of restaurants
$600
600
542
596
540
598 588 590
558
501
An Overview of the and tasting rooms because of the coronavirus. $500
500
Western U.S. Wine Grape Market The industry currently anticipates that 25% $400
400
of accounts selling wine on premises will 2010 2011
2010 2011 2012
2012 2013
2013 2014
2014 2015
2015 2016 2017 2018
2018 2019
2019 2020
2020
The 2020 California grape crush totaled discontinue. 22 Wineries have tried to pivot Red
Red Wine Wh ite Wine
White
3.54 million tons — a 14% decline from the their direct-to-consumer strategies so as
4.1-million-ton harvest in 2019 and one of to incorporate more e-commerce because
smallest harvests in 10 years.20 Harvests in e-commerce on all domestic transactions
Oregon and Washington are also expected WINE GRAPES California Wine Grape Production, 2010 Through 2020
climbed from an all-time high of 12% of total
to have been smaller than usual. Going into transactions in 2019 to new highs of over 35% 4,500
4,500
the harvest, the California crop was expected of total transactions in the first quarter of
to be at least 12% to 17% lower than 2019 4,000
4,000
2020 alone. 23
levels because of adverse weather conditions 3,500
3,500
Tons Crushed
in the early season. 21 Additional grapes were 3,000
3,000
Grape prices were lower in 2020: the average
lost because of smoke taint from wildfires 2,500
2,500
price of all varieties was $678.89 — down 17%
that ravaged California during the late season.
from 2019. Red wine grape prices were down 2,000
2,000
Wine industry financial losses from the fires
22% from 2019 levels, and white wine grape 1,500
1,500
are currently estimated at $3.7 billion, which
prices were down 6% from 2019.20 Meanwhile, 1,000
1,000
includes losses of property, wine inventory,
the bulk wine market has seen a dramatic 500
grapes and future wine sales.21 500
increase in activity since August 2020. Bulk
00
wine inventories have decreased substantially, 2010 2011
2010 2011 2012
2012 2013
2013 2014
2014 2015
2015 2016
2016 2017
2017 2018
2018 2019
2019 2020
2020
The lower crush is expected to bring supply leading to price increases in virtually all
and demand back into balance after an acute varieties and across nearly every region.24
Red WineRed White
Wh iteWine
oversupply fueled by oversize grape crushes
from 2016–19 challenged the market.
Sources: Wine Institute, Allied Grape Growers, PGIM Real Estate Research
17EASTERN CENTRAL WESTERN TIMBER CONTACTS APPENDIX
China still remains the top producer of
table grapes globally — accounting for TABLE GRAPES Historical Bearing Acreage and Price per Ton, 2010
approximately 43% of total global production Through 2019
in 2020 — followed by India and Turkey at
140,140
000 $1,800
$1,800
12% and 8%, respectively. The United States
Bearing Acreage (In Thousands)
is ranked sixth globally and accounted for 120,120
000 $1,6 00
$1,600
approximately 4% of total global production $1,4 00
$1,400
100,100
000
for 2020, with California constituting about $1,2 00
$1,200
Price Per Ton
99% of total U.S. table grape production. 80,000
80 $1,000
$1,000
60,060
00 $800
$800
Chile remains America’s largest importer of $600
40,040
00 $600
table grapes, but shipments were down 50%
$400
$400
year to date in December 2020 because of
TABLE GRAPES
20,020
00 $200
the combined impacts of the pandemic and a $200
labor shortage of fruit pickers and packers. In -0 $0$-
2010 2011
2010 2011 2012
2012 2013
2013 2014
2014 2015
2015 2016
2016 2017
2017 2018
2018 2019
2019
An Overview of the addition, the 2021 Chilean table grape crop
has been negatively affected by unusually heavy Bearing Acreage PriPrice/Ton
Western U.S. Table Grape Market Bearing Acreage ce/Ton
rainfall in January that destroyed an estimated
40% of Chile’s crop, which will likely lead to
The 2020 California table grape crop is
higher prices in the United States.26
projected to be 102 million boxes — down
-18%
18% from 2019. Although difficult to confirm CALIFORNIA TABLE GRAPE
at this time, industry sentiment says the drop PRODUCTION
in production will likely have been caused The 2020 California table grape crop is
by the replanting of acreage to more-popular FROM 2019
projected at 102 million boxes.
varieties as a result of a shift in consumer
demand. Because of the current COVID-19
pandemic, most product for 2020 was shipped
to retailers and not the food service industry.25
California bearing and nonbearing acreage
remained stable in 2019 (most-recent USDA
$9.79 CALIFORNIA TABLE GRAPE PRICES
Prices of table grapes saw an increase
data available), at 121,000 acres and 9,000
acres, respectively. During the same time
PER BOX of 5% over the prior year.
frame, average table grape prices increased FOR 2019
5% from $9.29 per box to $9.79 per box.
California average yield per acre for 2019 was
1,027 boxes per acre, which was down 9%
from 2018’s yield of 1,131 boxes per acre.
Source: USDA, PGIM Real Estate Research
18EASTERN CENTRAL WESTERN TIMBER CONTACTS APPENDIX
being COVID-19 and a shift in consumption
from food service to grocery stores. It is AVOCADOS Historical Avocado Production by Country, 2018
expected that that dynamic will continue well Through 2020
into 2021 with targeted marketing campaigns
3,000 3,000
for brands and reaching consumers at home. 2,791
2,540 2,565
2,500 2,500
For the 2020 calendar year, avocados grown
Million Pounds
in California represented 13% (369 million 2,000 2,000
pounds) of the U.S. avocado volume (2.79
1,500 1,500 2,245
billion pounds). Mexico represented roughly 1,988 2,146
80% (2.24 billion pounds) of volume in the 1,000 1,000
United States. California growers typically
enter the market in July and August, when 500 500
AVOCADOS Mexico is unable to keep up with U.S.
demand. In 2020, avocados from Peru entered - 0
313 204
369
2018
2018 2019
2019 2020
2020
the domestic market in July and August, for a
An Overview of the total-year import of 171 million pounds. And
California
CaliforniaMexicoMexico
Peru Chile
Peru TotalChile
Western U.S. Avocado Market even though only a small percentage of total
demand, it is worth monitoring the volume
The 2020/21 California avocado crop year over time because it competes directly with
is considered an off year and is estimated California avocados.28
292M
to be 292 million pounds. That estimate is CALIFORNIA AVOCADO PRODUCTION
considered to be in line with an average crop U.S. consumers continue to show strong California avocado production in California
year. The 2019/20 crop finalized at 375.5 demand for avocados by absorbing large is expected to decline 22% because of the
million pounds and was reflective of an on- supplies. However, the large crop contributed
POUNDS E XPEC TED FOR
alternate bearing cycle for this commodity.
year cycle. This represents an increase of 73% to average pricing for the year to be $1.10 per 2020/21 CROP Y E AR
over the 2018/19 crop and an 11% increase pound, which was significantly lower than the
over the 2017/18 crop (the previous on year). $1.72 per pound for the prior year but not out
The 2019/20 growing season was considered of line for a typical on-year crop.
$1.10
average and quality was good, contributing CALIFORNIA AVOCADO PRICE
to the large crop. Wind events early in the Prices of avocados saw a decrease of
2020/21 harvest have affected harvestable 36% less than in 2019 because of the
supply, with a range of sizes and quality FOR 2020 larger supply.
expected to be in the market in April.27
Marketers faced many unfavorable outside
factors during the year, with the most major
Source: California Avocado Commission, PGIM Real Estate Research
19EASTERN CENTRAL WESTERN TIMBER CONTACTS APPENDIX
harvest concluded at the end of October 2020
CITRUS Historical and Projected Production for California Citrus,
with prices stronger than the prior year.29 2016/17 Through 2020/21F
Navel Oranges
Millions Of Boxes (80 Pounds Per Box)
45
45
The 2020/21 California navel crop harvest 39 40
42
40
began mid-October. Current estimates suggest 40
36
that U.S. production should be 66.3 million 35
35
80-pound boxes — down roughly 12% in 30
30
24
volume from last season. The California crop is 25
25 24
22 23 22
CITRUS anticipated to be 42 million 80-pound boxes —
down 7% year over year. 30 California fruit sizing
20
20
19
21 21 21 20
An Overview of the this year is trending favorably, and quality
1515
10
9 10 9 9
Western U.S. Citrus Market looks to be rather strong, with utilization 1010
4 4 5 4 4
Lemons around 80% for the season. Domestic pricing is 55
The 2020/21 U.S. lemon crop is projected to averaging $32 per box — decently higher than 0-
Non-Valencia
Non-Valencia Tangerines/
Tangerines / Lemons
Lemons Valencia
Valencia Oranges Grapefruit
Grapefruit
be 23.3 million 80-pound boxes — down 15% last season and with larger sizes capturing an Oranages
Oranges Mandarins
Mandarins Oranages
from last season. The 2019/20 lemon crop $8-to-$10 premium. 2016/172016-17 2017/18
2017-18 2018/19
2018-19 2019/20 2020-21F2020/21F
2019-20F
finalized greater than initial estimates, at 27.5
million 80-pound boxes. California is expected Mandarins
to produce 94%, or 22.0 million pounds, of the The 2020/21 U.S. mandarin crop is estimated
U.S. lemon crop, with Arizona producing the at 24.1 million 80-pound boxes — an increase U.S. MANDARIN PRODUCTION
+30%
remainder. The COVID-19 pandemic affected of 30% over the prior season because of a
The estimated production for mandarins
pricing because food service demand for lemons significant increase in acreage. About 95%
in 2020/21 is expected to be 24.1 million
has been low for several months. Early in the of the crop is produced in California, with
80-pound boxes.
season, prices were very soft but strengthened the balance grown in Florida. Overall, sizing FROM 2019/20
some as businesses continue to reopen. has been smaller and quality has been average
— with utilization around 70% — but is
expected to improve in the early part of the
Valencia Oranges NAVEL PRODUCTION IN CALIFORNIA
2021 calendar year. Early in the season, it was
The 2020/21 U.S. Valencia crop is projected The estimated production for navel oranges
reported that there was more offshore product
-7%
to be down 7% from the prior season, at 43.2 in 2020/21 is expected to be 42 million
in the market than in the previous year. This
million 80-pound boxes. Florida continues to
manifested in import volumes’ being up 15% 80-pound boxes. California fruit sizing this
be the leading Valencia producer, expecting to
over last year, causing California mandarins FROM 2019/20 year is trending large, and quality looks to be
account for 79% of total output, with California
to face this competition early in the season. strong, with utilization averaging 90%.
making up the 21% remainder. The majority of
California shipments did increase toward the
the Valencia crop grown in California is used
end of the calendar year, helping make up for
for fresh consumption, whereas Florida’s crop
some but not all of the missed sales earlier.
is generally used for juice. California Valencia
Source: USDA, PGIM Real Estate Research
20EASTERN CENTRAL WESTERN TIMBER CONTACTS APPENDIX
Export markets experienced growth for the
year, with season-to-date shipments (August ALMONDS Domestic and Export Shipments for California Almonds,
through December 2020) up 26% compared 2015/16 Through 2020/21 Season to Date (August–December)
with the same time last year. Continued
3,000
3,000
growth in export markets is expected because
prices have been affected by the current 2,500
2,500 2,430
health pandemic and the substantial increase 2,252 2,264
2,101
in supply. Season-to-date shipments to India
Million Pounds
2,000
2,000
1,811
nearly doubled, and shipments to China are
1,655
recovering to more-historically-normal levels. 1,500
1,500 1,517 1,523
1,425 1,284
1,218 1,051
For the California almond industry, 2019 1,000
1,000
952
production for the Nonpareil crop was the
ALMONDS
754
largest to date, exceeding 1 billion pounds. 500
500
676 735 741 774
593
There has been a considerable compression 298 332
0-
An Overview of the in variety value during the past several years, 2015-16 2016-17 2017-18 2018-19 2019-20 19/20YTD 20/21 YTD
2016-17
2017-18
2018-19
2019-20
2019-20YTD
2015-16
2020-21 YTD
Western U.S. Almond Market but the good-size and high-quality Nonpareil Domestic Export Total
variety continues to hold the highest value.
The 2020 almond crop finalized at 3.09 Current price levels are ranging from $1.65
Domestic Export Total
billion pounds — slightly higher than the to $2.30 per pound, which is significantly
National Agricultural Statistics Service’s lower than last year’s range of $2.40 to $2.80
per pound. Pandemic-related labor shortages ALMONDS Annual Production and USDA Blended Price, 2015/16
objective estimate of 3.00 billion pounds. This
Through 2020/21
represents an increase of more than 20% from at the port, combined with a global deficit of
the prior year.31 The increase is, at least in part, shipping containers, have stymied shipments,
3,500
3,500 $3.50
$3.5 0
a result of 80,000 additional acres’ coming which has contributed to the downward
pressure on price. $3.00
$3.00
into production, as well as increases in average 3,000
3,000
yields per acre by 130 pounds to 2,380 pounds. $2.50
$2.5 0
Dollars Per Pound
Million Pounds
2,500
2,5 00
$2.00
$2.00
Season-to-date shipments (August through 2,000
2,000
$1.50
$1.5 0
December 2020) reached 1.28 billion $1.00
$1.00
pounds — up 22.1% from the prior season. 1,500
1,500
$0.50
$0.5 0
Commitments (inventory not shipped) have
1,000
1,000 $0.00
$-
reached 921 million pounds — up 51% 2015-16 2016-17 2017-18 2018-19 2019-20 2020-21
2015-16 2016-17 2017-18 2018-19 2019-20 2020-21
from the previous year. With the California Annual Pro duction USDA Blended Pric e
crop finalizing at 3.09 billion pounds, the Annual Production USDA Blended Price
industry was approximately 65% sold through
December 2019.
Source: USDA, NASS, Almond Board of California, PGIM Real Estate Research
21EASTERN CENTRAL WESTERN TIMBER CONTACTS APPENDIX
15%, and shelled shipments were down flat. WALNUTS Domestic and Export Shipments for California Almonds,
In-shell shipments to China and Hong Kong 2015/16 Through 2020/21 Season to Date (August – December 2020)
are down 85% year over year because of trade
wars, tariffs, and China’s and Hong Kong’s 700
700
498 621
692
own increasing production. However, a 27% 498 526
increase in in-shell shipments to India helped 600
600
offset the reduction in total shipments.
WALNUTS 500
500
Thousand Tons
312 399 470
311 332
Globally, China is the largest producer of 400
400
An Overview of the 673
walnuts, followed by the United States, Chile 620
Western U.S. Walnut Market and Ukraine. U.S. and Chilean producers are
300
300
respectively responsible for approximately 200
200 409
431
The 2020/21 walnut crop finalized at 783,754 50% and 20% of total global exports. China’s
187 186 194 222 223
tons — up 20.0% from last year’s realized 100
100
2020/21 production is expected to reach nearly
211 243
production of 653,000 tons. 32 Overall quality 1 million metric tons and will continue to 00
and size were lower than expectations, causing grow for the next five to seven years as new 2015-16 2016-17 2017-18 2018-19 2019-20 19-20 YTD 20-21 YTD
2016-17
2017-18
2018-19
2019-20
2019-20YTD
2015-16
2020-21 YTD
prices to firm on larger halves. Season-to-date trees come into maturity. Chinese production Domestic Export Total
shipments (September through December consists primarily of local varieties, which
2020) were 336,000 tons — 14.6%, or nearly are dark and more bitter despite consumer Domestic Export Total
43,000, tons higher than the same period last preferences for lighter and less-bitter nuts.
year. 33 In-shell and shelled shipments to India However, because of lower prices and a
and the Middle East are the primary drivers of weakened yuan, Chinese exports could WALNUTS Annual Production and USDA Blended Price, 2015/16
increased volumes. India and the Middle Eastern increase, creating more global competition. In Through 2020/21
countries account for 67% of total exports of addition, Chilean producers are anticipating
in-shell shipments and 19% of total exports 800
800 $1$1.40
.4 0
a good harvest because producers have
of shelled shipments. Shipments to Europe are experienced optimal weather during their 750
750 $1$1.20
.2 0
down from the same period last year. The Middle growing season.
Thousand Tons
$1$1.00
.00
700
$ Per Pound
700
East surpassed Europe, becoming the largest
$0.$0.80
80
destination for California walnuts. Walnuts are currently trading at $0.80 to 650
650
$0.$0.60
60
$1.05 per pound depending on size, color and 600
600
$0.$0.40
Domestic shipments in 2018/19 were nearly variety. Given the large domestic crop and 40
550
indistinguishable from the prior year, at 242,000 anticipated large Chinese crop, prices have 550 $0.$0.20
20
tons. Domestic shipments through December softened $0.10 to $0.15 in the past 12 months. 500
500 $-$0
2020 were up 5,000 tons, or 5%. 2015-16
2015-16 2016-17
2016-17 2017-18
2017-18 2018-19
2018-19 2019-20
2019-20 2020-21
2020-21
Annual Pro duction USDA Blended Pric e
Annual Production USDA Blended Price
In 2019/20, export shipments totaled 413,000
tons. Exports of in-shell shipments were down
Source: California Walnuts, USDA, PGIM Real Estate Research
22You can also read