Cairngorms National Park Local Development Plan 2020 Main Issues Report - Evidence Paper: Rural Development - Part 1 Housing
←
→
Page content transcription
If your browser does not render page correctly, please read the page content below
Cairngorms National Park
Local Development Plan 2020
Main Issues Report

Evidence Paper: Rural Development – Part 1 Housing
CONTENTS

   1.   Policy Context                                                               1
   2.   Trends and Other Drivers of Change                                           4
   3.   Current Policy approach                                                      6
   4.   Challenges and Issues within the Cairngorms National Park                    9
   5.   Summary – Key Issues / Implications for the Local Development Plan          73
   6.   References and Further Information                                          74
        Appendix 1 – Housing needs and Demands Assessment Diagram                   76
        Appendix 2 – Boundaries and statistical areas used in the analysis of       77
        the Cairngorms National Park

1. POLICY CONTEXT

1.1 National Planning Framework 3
The National Planning Framework (2014) (NPF3) aims to facilitate new housing
development, both in areas metropolitan areas where there is continuing pressure for
growth, and through innovative approaches to rural housing provision.

The NPF3 offers a strategy for Scotland’s National Parks, which states in relation to housing
that positive planning and innovation should continue to deliver affordable rural housing and
encourage high quality placemaking.

The NPF3 highlights the important contribution housing makes to Scotland’s economy and
that planning can help to address the challenges facing the housing sector by providing a
positive and flexible approach to development. In particular, provision for new homes
should be made in areas where economic investment is planned or there is a need for
regeneration or to support population retention in rural and island areas.

1.2 Scottish Planning Policy
Scottish Planning Policy (SPP) (2014) is a statement of Scottish Government policy on how
nationally important land use planning matters should be addressed across the country.

In relation to housing, SPP states that the planning system should:

   •    Identify a generous supply of land for each housing market area within the plan area
        to support the achievement of the housing land requirement across all tenures,
        maintaining at least a 5-year supply of effective housing land at all times;
   •    Enable provision of a range of attractive, well-designed, energy efficient, good quality
        housing, contributing to the creation of successful and sustainable places; and
   •    Have a sharp focus on the delivery of allocated sites embedded in action
        programmes, informed by strong engagement with stakeholders.

The SPP recognises the special status of National Park’s as planning authorities and requires
that Local Development Plans (LDPs) be consistent with National Park Plans. It states that
the authority preparing the LDP for a National Park, or which affects a National Park, is

                                                                                      1|Page
required to pay special attention to the desirability of consistency with the National Park
Plan, having regard to the contents (para 86). The NPPP therefore plays a leading role in
setting the strategic context for the delivery of housing across the National Park and the
contents of the LDP.

Development Plans

According to SPPP, Development Plans should be informed by a robust housing need and
demand assessment (HNDA), prepared in line with the Scottish Government’s HNDA
Guidance. This assessment provides part of the evidence base to inform both local housing
strategies and development plans (including the main issues report). It should produce
results both at the level of the functional housing market area and at local authority level,
and cover all tenures (see Appendix 1 for details of process).

Plans should address the supply of land for all housing. They should set out the housing
supply target (separated into affordable and market sector) and the housing land
requirement for each functional housing market area up to year 10 from the expected year
of adoption, based on evidence from the HNDA. The housing supply target is a policy view
of the number of homes the authority has agreed will be delivered in each housing market
area over the periods of the development plan and local housing strategy, taking into
account wider economic, social and environmental factors, issues of capacity, resource and
deliverability, and other important requirements such as the aims of National Parks. The
target should be reasonable, should properly reflect the HNDA estimate of housing demand
in the market sector, and should be supported by compelling evidence.

Within the overall housing supply target, plans should indicate the number of new homes to
be built over the plan period. This figure should be increased by a margin of 10 to 20% to
establish the housing land requirement, in order to ensure that a generous supply of land for
housing is provided. The exact extent of the margin will depend on local circumstances, but
a robust explanation for it should be provided in the plan.

The LDP should allocate a range of sites which are effective or expected to become
effective in the plan period to meet the housing land requirement in full. It should provide a
minimum of 5 years effective land supply at all times. Beyond year 10 and up to year 20, the
Local Development Plan should provide an indication of the possible scale and location of
the housing land requirement.

The housing land requirement can be met from a number of sources, most notably sites
from the established supply which are effective or expected to become effective in the plan
period, sites with planning permission, proposed new land allocations, and in some cases a
proportion of windfall development. Any assessment of the expected contribution to the
housing land requirement from windfall sites must be realistic and based on clear evidence
of past completions and sound assumptions about likely future trends.

Since the National Park is not a housing authority it has no duty to produce an HNDA, with
this responsibility falling to its constituent housing authorities, which in the case of the CNP

                                                                                     2|Page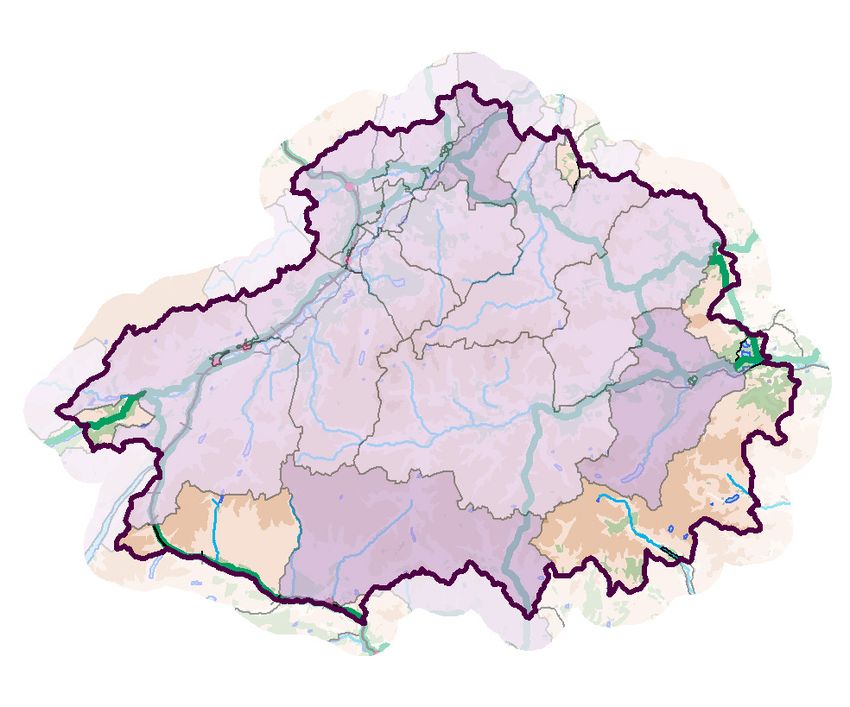
are Highland, Aberdeenshire, Moray, Perth and Kinross and Angus. The National Park’s
Local Development Plans should draw on the evidence provided by the HNDAs of the
constituent housing authorities. It should aim to meet the housing land requirement in full in
their area. However, they are not required to do so, and they should liaise closely with
neighbouring planning authorities to ensure that any remaining part of the housing land
requirement for the National Parks is met in immediately adjoining housing market areas,
and that a 5-year supply of effective land is maintained.

1.3 Planning Circular 6/2013: Development Planning

This Circular describes the development planning system in Scotland, and explains legislative
provisions in both the primary legislation and the subsequent Regulations.

1.4 Planning Advice Note 2/2010: Affordable Housing and Housing Land
Audits
It is not the duty of the National Park Authority to produce Housing Land Audits, therefore
only section 1 of the Planning Advice Note (PAN), which provides advice and information
on how the planning system can increase the supply of affordable housing, holds any
requirements that need to be considered by the NPPP.

According to the PAN, a range of housing types, at different prices, tenures and locations
are needed to cater for the increasing number and variety of households, maintain the
viability of communities, and support the operation of local labour markets and the wider
economy. In summary, it states that the Scottish Government’s ambitions are:

       •   to increase housing supply across all tenures over the long term;
       •   to increase the choice of housing available to those on low incomes;
       •   to create housing developments of high environmental and design standards that
           contribute to the creation of sustainable, mixed communities; and
       •   to ensure that social housing provides better value for public expenditure

1.5 The Housing (Scotland) Act 2001
The Act requires local authorities to prepare a local housing strategy supported by an
assessment of housing need and demand. While these obligations are not placed upon the
National Park Authority, they do influence how housing is delivered within the National
Park.

Housing Strategies provide information about the agreed strategic direction taken by a Local
Authority on how to tackle housing issues across the privately owned, social and privately
rented sectors within their area. It also informs investment in housing and related services.

Housing Need and Demand Assessments (HNDA) are technical documents that aim to give
long run estimates of housing need, and provide an evidence base for both Local Housing
Strategies and Local Development Plans. They are largely analytical and use quantitative
information wherever it is available, supplemented by qualitative information when it is not,

                                                                                   3|Page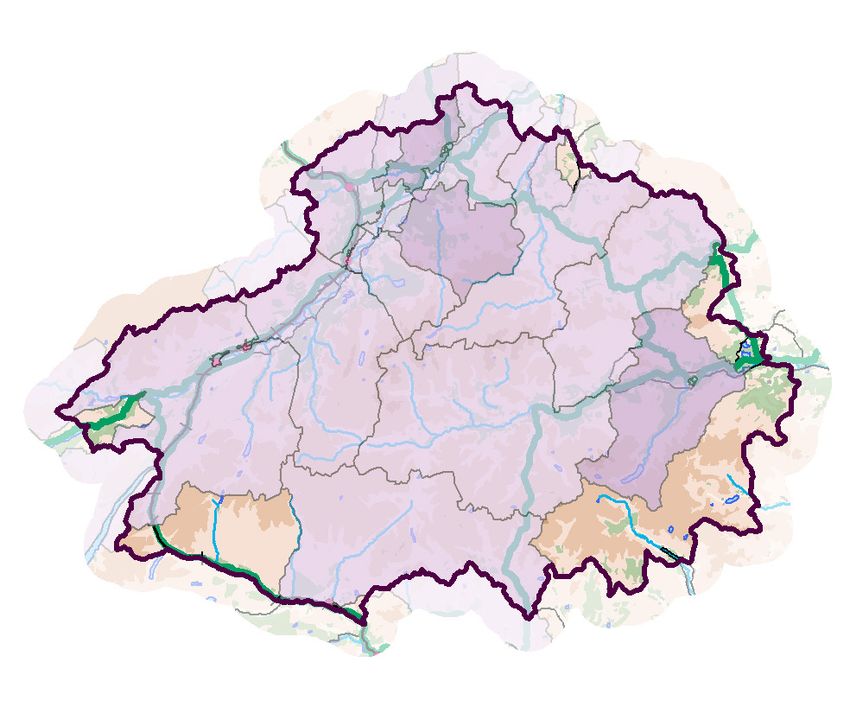
or to give context. In the Cairngorms National Park therefore, the HNDAs of five Local
Authorities must be drawn on to inform the National Park Authority’s plans and strategies.

2. TRENDS AND OTHER DRIVERS OF CHANGE

2.1 Help to Buy
The Help to Buy (Scotland) scheme helps buyers to buy a new home from a participating
home builder without having to fund the entire purchase price. The scheme is now fully
subscribed and no longer accepting applications for properties. All applications for
completions up to 31 March 2016, received by agents by midnight 26 May 2015, have been
assessed and will be supported if eligible under the rules of the scheme while all ‘Authorities
to Proceed’ already issued remain eligible.

The Scottish Government has announced a successor to the scheme, with a greater focus
on affordable housing, with eligible buyers receiving an equity loan towards the purchase
price of a new built home. The Scottish Government will work with the house-building
industry and lenders to agree on how the new scheme will operate, with further details to
be announced following the UK Government’s spending review in November. It is currently
intended that the Scottish Government will spend £195 million over the next three years on
this new shaded equity scheme to help around 6,500 households buy a home.

2.2 Right to Buy
The ‘Right to Buy’ was introduced in October 1980 and gave tenants of council housing the
right to buy their homes at a discount, depending on how long they had been living in the
property.

The Housing (Scotland) Act 2001 introduced the Scottish secure tenancy from 30
September 2002. This provided a single, common tenancy for nearly all tenants of local
authorities and housing associations in Scotland and made important changes to the right to
buy. The qualifying period increased from two to five years and the maximum discount was
reduced to 35% or £15,000, whichever was lower. This is called the 'modernised right to
buy'. Housing association tenants who previously did not have the right to buy now had a
modernised right to buy but this was suspended for 10 years until 2012. The Act also gave
housing associations the right to apply to extend this suspension beyond 2012.

On 1 March 2011, the Housing (Scotland) Act 2010 came into force and introduced further
changes to the right to buy rules. The main changes were that the right to buy was removed
from:

   •   new-build and new-supply social housing;
   •   people who take up a tenancy with a social landlord for the first time; and
   •   with some exceptions - tenants who return to the social rented sector after a break.

Right to Buy will end for all council and housing association tenants in Scotland on 1 August
2016. Tenants with a right to buy that they are allowed to use will have until 31 July 2016 to
do so.

                                                                                    4|Page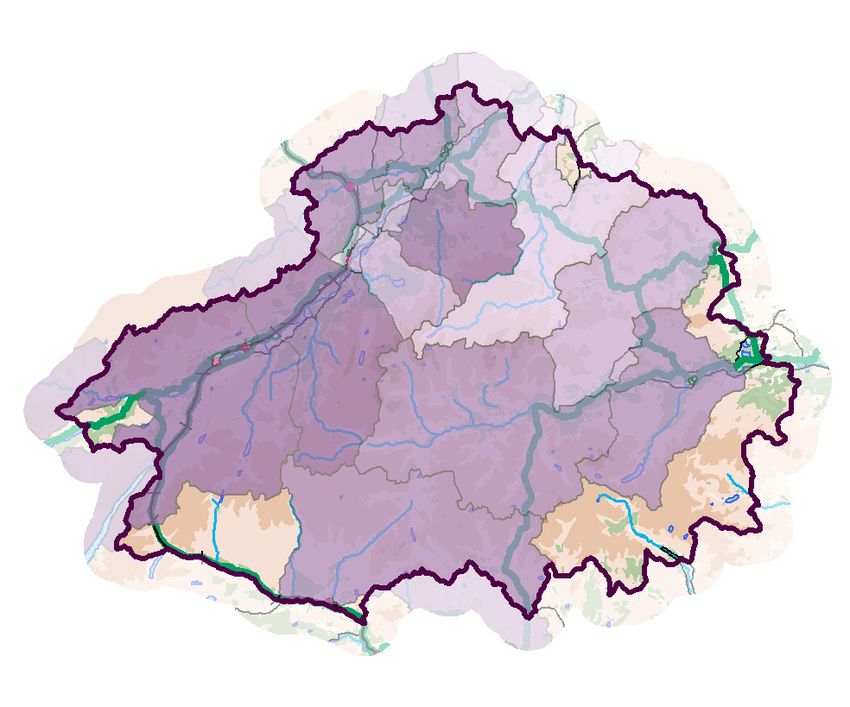
2.3 Community Empowerment (Scotland) Act 2015
The stated aims of the Act are to:

  •       empower community bodies through the ownership of land and buildings and
          strengthening their voices in the decisions that matter to them; and
  •       support an increase in the pace and scale of public service reform by cementing the
          focus on achieving outcomes and improving the process of community planning.
Some of the key provisions of the Act have an implication for the delivery of housing:
  •       Strengthening Community Planning: greater focus on tackling inequality,
          improved resourcing of community engagement; and a requirement to improve public
          sector collaboration, involving a broader range of agencies (including National Park
          Authorities);
  •       Participation Requests: a provision which allows community groups to participate
          in a process designed to improve the delivery of a strategic outcome. There is a
          presumption in favour of the request being granted and this provision applies to a
          significant number of public agencies (including National Park Authorities);
  •       Asset Transfer Requests: a provision allowing appropriately constituted
          community groups to request the transfer of a public asset to their use, management
          or ownership. This provision applies to a significant number of public agencies
          (including National Park Authorities); and
  •       Right-to-Buy: the community right to buy is extended to all communities and a new
          provision allows communities to purchase land where they can persuade Scottish
          Ministers that it is abandoned or neglected, or has a negative impact on their
          environmental quality of life.

2.4 Land Reform (Scotland) Act 2016
The additional provisions for the community right-to-buy set out within the Community
Empowerment (Scotland) Act 2015 are further supported by the Land Reform (Scotland)
Act 2016, which was passed by the Parliament on 16 March 2016 and received Royal Assent
on 22 March 2016. The Act seeks to increase the contribution of Scotland’s land to
sustainable economic growth; empower greater numbers of people; and change patterns of
ownership in Scotland to ensure greater sustainable development. The aims of the Act are
to:-

      •    ensure the development of an effective system of land governance and on-going
           commitment to land reform in Scotland;
      •    address barriers to furthering sustainable development in relation to land and
           improve the transparency and accountability of land ownership; and
      •    demonstrate commitment to effectively manage land and rights in land for the
           common good, through modernising and improving specific aspects of land
           ownership and rights over land.

Within the Act there is one main provision that may directly impact on housing. This
proposed provision will allow communities to purchase land where they can persuade

                                                                                      5|Page
Scottish Ministers that a transfer will provide significant benefit to the community; prevent
significant harm; further sustainable development; and is the only practicable way of
achieving the stated benefit.

3. CURRENT POLICY APPROACH

Policy 1: New Housing Development aims to create opportunities for the right type of
housing, in the right place, that makes a positive contribution to local communities. It aims
that developers will have confidence to invest and in turn communities will have the support
they need to become and remain thriving places where people enjoy a sense of wellbeing.

The Policy consists of ten sub-policies that cover different aspects of housing delivery:

  •    Policy 1.1 Housing in settlements
  •    Policy 1.2 Housing development in existing rural groups
  •    Policy 1.3 Other housing in the countryside
  •    Policy 1.4 Contribution towards affordable housing provision
  •    Policy 1.5 Affordable housing developments
  •    Policy 1.6 Affordable housing provided using cross subsidy from other housing
  •    Policy 1.7 Alterations to existing houses
  •    Policy 1.8 Conversions
  •    Policy 1.9 Replacement houses
  •    Policy 1.10 Housing for gypsies and travellers and travelling showpeople

Policy 1 was used a total of 127 times, twice (1.6%) by the CNPA and 125 (98.4%) times by
the Las in the first year of the current LDP’s adoption. It resulted in a total of 122 (96.1%)
applications being approved and 5 (3.9%) refused (Figure 5 and Figure 6).

                                      1      4 1

                                                                              CNPA Approved
                                                                              LA Approved
                                                                              CNPA Refused
                                                                              LA Refused

                                                121

Figure 1 Use of Policy 1 by Planning Authority type.

                                                                                     6|Page
20

            15
   Number

            10

             5

             0

                                     Applications refused   Applications approved

Figure 2 Use of Policy 1 by month.

                                                                                    7|Page
North

                                                                                                                                                 Approved application
                                                                                                                                                 Refused application

                                                                                                                                        Scale:
                                                                                                                                   1:600,000

Figure 3 Location of planning applications where ‘Policy 1 New Housing Development’ was used. Reproduced by permission of Ordnance Survey on behalf of HMSO. © Crown copyright and
database right 2016. All rights reserved. Ordnance Survey Licence number 100040965 Cairngorms National Park Authority.

                                                                                                                                                                       8|Page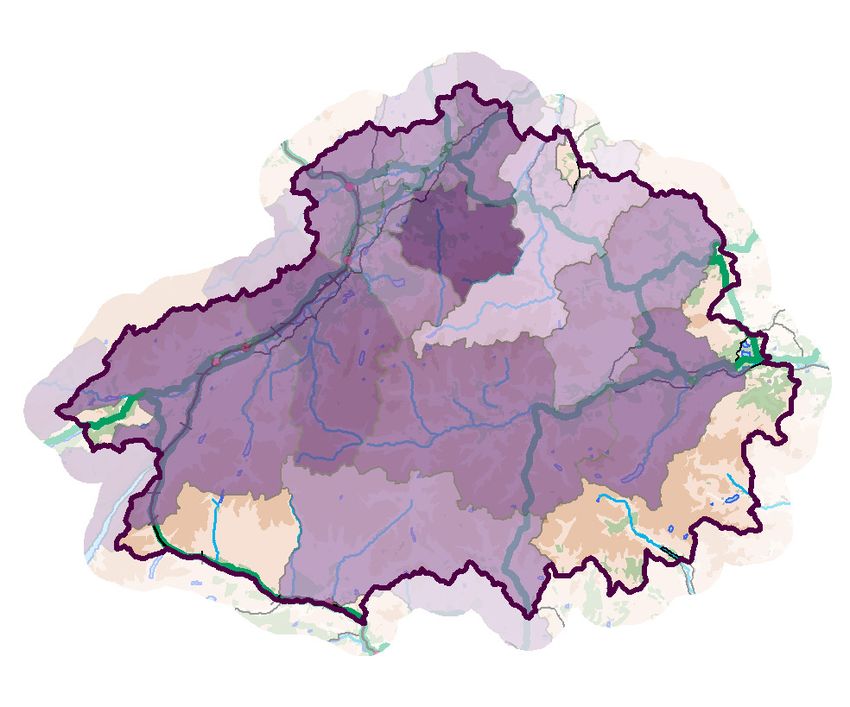
4. CHALLENGES AND ISSUES WITHIN THE CAIRNGORMS NATIONAL
   PARK

4.1 Identifying Housing Need

There is no single official measure of housing need, however the process within Scotland’s
National Parks is complicated by the fact that a great deal of relevant information is not
available at a National Park scale. The responsibility for studies such as Housing Need and
Demand Assessments (HNDA) therefore falls outside the remit and ability of National Park
Authorities, lying in the hands of the Local Authorities that cover their areas. Studies such
as HNDAs are not always directly useful to National Park Authorities, since the Housing
Market Areas they identify are not necessarily contiguous with National Park boundaries.
However, certain important types of data, such as population and household projections and
data on market affordability, may be collected allowing key issues to be identified.

4.2 Population and Household Projections

Population
Population and household projections are frequently used to inform housing policy and may
be used to inform the housing land requirements for Local Development Plans (LDPs) and
other strategic documents. Population and household statistics within the Cairngorms
National Park are calculated using an aggregate of data zones that roughly correspond with
its boundary. For full details on how these data zones are collected, see Appendix 2.

In 2014 1 the estimated population of the National Park was 18,594, with 9,186 males and
9,408 females.

The National Park has a distinctly different population profile to the national (Figure 4),
with a higher proportion of people falling within the 55 to 74 age cohorts. When compared
to other rural parts of Scotland, the Cairngorms National Park also has a relatively high
proportion of residents within the 10 to 29 age cohorts (see NRS 2014). This is thought to
be due to the relatively high number of opportunities for employment in the outdoor and
tourism sectors. There is also a spike in the 10 to 15 year cohort, which is replicated across
Scotland as a whole.

1
 2014 Mid-year estimates represent the most recent set of population statistics at a data zone level at time of
writing.

                                                                                                   9|Page
90 or over 90 or over
85 to 89 85 to 89
80 to 84 80 to 84
75 to 79 75 to 79
70 to 74 70 to 74
65 to 69 65 to 69
60 to 64 60 to 64
55 to 59 55 to 59
Age cohort
Age cohort
50 to 54 50 to 54
45 to 49 45 to 49
40 to 44 40 to 44
35 to 39 35 to 39
30 to 34 30 to 34
25 to 29 25 to 29
20 to 24 20 to 24
16 to 19 16 to 19
10 to 15 10 to 15
5 to 9 5 to 9
0 to 4 0 to 4
4 2 0 2 4 4 2 0 2 4
% %
Female Male Female Male
Figure 4 Estimated population profile by age and sex in the Figure 5 Estimated population profile by age and sex in
Cairngorms National Park in 2014. Scotland in 2014.
Source: www.sns.gov.uk
Although mid-year estimates suggest a slowdown in the rate of growth between 2011 and
2014, during the 21st century 2, the National Park has experienced a significant net increase in
its resident population, rising by approximately 2,261 persons (a growth of 13.8%) (Figure
6). This growth is well above the overall Scottish rate, which saw a net increase of around
5.6% over the same period.
2
Figures between 2001 and 2009 include people living in the area of Perth and Kinross which did not become
part of the National Park until 2010.
10 | P a g eThis growth has not been evenly distributed throughout the National Park (Figure 7 and
Figure 8). Indeed, the overall population in data zones within Aberdeenshire and Perth and
Kinross has remained relatively stable.
19000
18500
18000
17500
Persons
17000
16500
16000
15500
15000
Figure 6 Mid-year estimates of total population for the Cairngorms National Park. Source: www.sns.gov.uk
20000
15000
10000
5000
0
Aberdeenshire Highland Moray Perth & Kinross
Figure 7 Mid-year estimates of total population for the Cairngorms National Park distributed by Local Authority Area.
Source: www.sns.gov.uk
The greatest increase occurred within Aviemore, which is estimated to have grown by
around 1,009 people. Proportionally this represents a growth of around 142%. Most of
Badenoch and Strathspey also experienced growth, gaining an estimated 1,014 people.
Taken together, this addition of 2,023 persons resulted in the Highland area of the National
Park growing by 17.4%.
Although net population change within the National Park has been positive, certain areas
experienced a reduction in the population. For example, the population of data zone
S01000312, which represents part of Ballter, lost around 93 persons (-14.5%). It is unclear if
this represents a genuine trend or is a result of methodical or sampling changes to the mid-
year estimate methodology.
11 | P a g eOver 30%
10 to 30%
North
0 to 10%
0 to -10%
-10 to -20%
Scale:
1:700,000
Figure 8 Population change within the Cairngorms National Park between 2001 and 2014 (based on mid-year estimates).
Reproduced by permission of Ordnance Survey on behalf of HMSO. © Crown copyright and database right 2017. All rights
reserved. Ordnance Survey Licence number 100040965 Cairngorms National Park Authority.
Population projections for the National Park are produced by National Records of Scotland
(NRS), with the most recent being 2014 based projections, published in October 2016
(Figure 9). NRS’s (2016) principal projection is that between 2014 and 2039, the
population of Cairngorms National Park will drop from 19,010 to 18,337 (a decrease of
around 4%) 3.
This projection is in contrast to the level of growth experienced previously and indeed NRS’
2012 based principle projection, which projected a growth in the population of around 1%.
Table 1 shows the principle projected percentage population change for the National Park
and compares the projected rates of natural change and migration across areas between
2014 and 2039.
The population of the National Park is projected to decrease despite positive projected net
migration to the area over the projection period. This is because the number of deaths is
projected to exceed the number of births. This is largely due to the age structure of the
population in these areas.
3
The reason that NRS’ population estimate for 2014 differs from the 2014 mid-year estimate quoted on page
8 is due differences in the way small population areas are aggregated; see Appendix 2 for further details.
12 | P a g eTable 1 Components of projected population change for the Cairngorms National Park, Principle projection 2014 to
2039 4.
Natural Change (per Net migration (per Population change
thousand people) thousand people) (percentage)
-71.8 52.8 -3.5
19,200
19,000
18,800
18,600 High Migration
18,400 Principle
Low Migration
18,200
18,000
17,800
2014
2015
2016
2017
2018
2019
2020
2021
2022
2023
2024
2025
2026
2027
2028
2029
2030
2031
2032
2033
2034
2035
2036
2037
2038
2039
Figure 9 Projected total population of the Cairngorms National Parks, High, Principal, Low and Zero migration scenarios
2014-2039 (NRS, 2016).
19,100
19,000
18,900
18,800
High Migration
18,700
Principle
18,600 Low Migration
18,500
18,400
18,300
2014 2015 2016 2017 2018 2019 2020 2021 2022 2023 2024 2025
Figure 10 Projected total population of the Cairngorms National Parks, High, Principal and Low migration scenarios for the
current and next plan period, 2014-2025
4
Projected natural change and net migration are not the only components of change. Other changes that are
not included in this table include changes in armed forces and prisoner populations and changes due to
constraining to the National Population Projections for Scotland.
13 | P a g eNRS (2016) also give an indication of how the age structure of the population might change
(Figure 11 and Figure 12). According to the principal migration scenario, the number of
children aged under 16 is projected to decrease by 21% over the projection period from
3,030 in 2014 to 2,383 in 2039. The number of people of working age is projected to
decrease from 11,250 in 2014 to 10,178 in 2039, a decrease of 10%. The population of
pensionable age is projected to rise by 23% from 4,730 in 2014 to 5,776 in 2039. However,
the number of people aged 75 and over is projected to from 1,782 in 2014 to 3,505 in 2039,
an increase of 97%. By 2039 the population is projected to be more heavily distributed at
older ages. 5
90 & over 90 & over
85-89 85-89
80-84 80-84
75-79 75-79
70-74 70-74
65-69 65-69
60-64 60-64
55-59 55-59
Age cohort
Age cohort
50-54 50-54
45-49 45-49
40-44 40-44
35-39 35-39
30-34 30-34
25-29 25-29
20-24 20-24
15-19 15-19
10-14 10-14
5-9 5-9
0-4 0-4
750 250 250 750 750 250 250 750
Persons Persons
Female Male Female Male
Figure 11 Estimated population profile by age and sex in Figure 12 Projected population profile by age and sex in
the Cairngorms National Park in 2014 (NRS, 2016). the Cairngorms National Park in 2039, Principle migration
scenario (NRS, 2016).
Household Projections
It’s clear that this projected change in population and demographic character will result in an
increase in the number of households within the National Park. NRS’s (2017) principal
projections suggest that households are set to increase from 8,653 in 2014 to 9,195 in 2039,
an increase of 542 (6%) (Figure 12, Figure 13 and Table 2). Given the limited nature of
the projected population growth, it is clear that it does not entirely explain the projected
change in the number of households. Indeed, the difference between the household and
5
Estimates based on State Pension Age. As set out in the 2014 Pensions Act, between 2014 and 2018, the
state pension age will rise from 62 to 65 for women. Then between 2019 and 2020, it will rise from 65 years
to 66 years for both men and women. A further rise in state pension age to 67 will take place between 2026
and 2028. Between 2044 and 2046, state pension age will increase from 67 to 68. The UK Government plan to
review state pension age every five years in line with life expectancy and other factors.
14 | P a g epopulation projections is due to falling average household sizes, which are projected to drop
from 2.15 people in 2012 to 1.93 people in 2037 (Figure 13).
9,400
9,200
9,000
Households
8,800
8,600
8,400
8,200
2014
2015
2016
2017
2018
2019
2020
2021
2022
2023
2024
2025
2026
2027
2028
2029
2030
2031
2032
2033
2034
2035
2036
2037
2038
2039
High Migration Principle Low Migration
Figure 13 Overall household projections for the Cairngorms National Parks, High, Principal and Low migration scenarios
2014 to 2039 (NRS, 2017).
2.15
2.10
2.05
2.00
Persons
1.95
1.90
1.85
1.80
2014
2015
2016
2017
2018
2019
2020
2021
2022
2023
2024
2025
2026
2027
2028
2029
2030
2031
2032
2033
2034
2035
2036
2037
2038
2039
Figure 14 Projected household size for the Cairngorms National Park, principal migration scenario 2014 to 2039 (NRS,
2017)
The decreasing average household size is reflected in the changes in the number of
households in each household type (Table 2). There is a projected increase of 26% in the
number of adults living alone while the number of households containing one adult with
children is also set to increase by 29%. There is also a projected decrease in the number of
households containing two or more adults with children (-7%), or three or more adults (-
23%).
An important driver of decreasing household size is the ageing population, as children tend
to live in larger households and older people in smaller ones. The National Park has a
projected increase of 23% in the number of people in older age groups (65+), while children
(aged zero to fifteen) and the 16 to 64 population are projected to decrease by 21% and
10%, respectively. The gap between the average life expectancy of men and women in
Scotland is also narrowing. This means that the number of older men living alone is
15 | P a g eprojected to increase more rapidly than the number of older women. In the Cairngorms
National Park, the number of men aged 65 or over living alone is projected to increase by
80%, while the number of women in the same age group is projected to increase by 37%,
although there will still be more older women than men living alone in 2039.
Table 2 Household projections for the Cairngorms National, by type of household, principal migration scenario 2012 to
2037 (NRS, 2017).
Averag
e
Overall
Household annual
2014 2019 2024 2029 2032 2039 Change 2014-
Type change
2039
2014-
2039
1 adult 2,889 3,016 3,178 3,337 3,434 3,494 24 605 21%
2 adults 3,177 3,260 3,350 3,424 3,405 3,335 6 158 5%
1 adult with 453 465 493 520 547 571 5 118 26%
children
2+ adults 1,560 1,484 1,436 1,395 1,398 1,398 -6 -161 -10%
with children
3+ person all 575 545 505 466 429 397 -7 -178 -31%
adult
All 8,653 8,770 8,963 9,143 9,213 9,195 22 542 6%
households
Household projections are important as they offer a useful starting point in informing the
National Park’s future housing land requirement. These need to be interpreted and
considered alongside other factors and trends, including housing need and demand as well as
supply. Jointly, these combine to inform the new housing land requirement that the CNPA
will need to identify and the type of housing that requires to be provided.
4.3 Housing Market Characteristics
House Prices and Affordability
Between 1993 and 2015 6, the median price of a property in the Cairngorms National Park
saw a net rise of almost 230%, with a peak in 2015 of £192,500 (Table 3 and Figure 15).
The ‘credit crunch’ does not appear to have had much of an immediate impact on prices,
although it seems to have resulted in a lower level of sales between 2007 and 2014. The
growth in house prices has also been lower and more variable since 2007 and while 2015
represents an all-time high, it is difficult in the current economic climate to tell whether this
marks the beginning of a longer term trend.
Between 2007 and 2015, the median house price to median household income/earnings
ratio in the National Park fell from over 8 times income to around 6. However, despite this
6
These are the most recent house price estimates available at a data zone level at the time of writing.
16 | P a g eimprovement, the lower availability of mortgage finance for first time buyers means that
many aspiring households still cannot afford to buy.
17 | P a g eTable 3 Median House Prices in the Cairngorms National Park (Source: http://www.sns.gov.uk/).
Estimated Annual Change Estimated
Annual Change Median Gross in Estimated Median House
Median Sale Annual Change Number of
Year in Number of Household Median Gross Sale Price /
Price in Sale Price Sales
Sales Income 7 Household Income Ratio
Income
1993 £56,000 N/A 237 N/A
1994 £58,500 4.5% 222 -6.3%
1995 £60,000 2.6% 234 5.4%
1996 £59,000 -1.7% 233 -0.4%
1997 £65,500 11% 274 17.6% No Data No Data No Data
1998 £57,000 -13% 276 0.7%
1999 £68,876 20.8% 301 9.1%
2000 £75,000 8.9% 258 -14.3%
2001 £75,000 0% 344 33.3%
2002 £87,000 16% 338 -1.7% £20,701 N/A 4
2003 £93,250 7.2% 334 -1.2% £21,194 3.8% 4
2004 £125,000 34% 306 -8.4% £21,961 3.6% 6
2005 £146,000 16.8% 328 7.2% £23,298 4.2% 6
2006 £175,000 19.9% 392 19.5% £24,468 4.8% 7
2007 £180,500 3.1% 414 5.6% £24,622 2.2% 8
2008 £181,000 0.3% 287 -30.7% £26,156 4.3% 7
2009 £175,000 -3.3% 229 -20.2% £27,386 6.4% 6
2010 £190,000 8.6% 289 26.2% £27,765 0.7% 7
2011 £191,000 0.5% 251 -13.1% £28,167 0.5% 7
2012 £176,500 -7.6% 230 -8.4% £28,652 2.8% 7
2013 £165,000 -6.5% 294 27.8% £29,207 1.0% 6
2014 £182,500 10.5% 402 36.7% £29,577 2.8% 6
2015 £192,500 5.5% 377 -6.2% £30,178 0.4% 6
7
Based on small area estimates by Bramley & Watkins (2013) and Local Authority estimates from ONS’ annual survey of hours and earnings - resident analysis.
18 | P a g e£200,000
£180,000
£160,000
£140,000
£120,000
£100,000
£80,000
£60,000
£40,000
£20,000
£0
Median Sale Price Median Gross Household Income
Figure 15 Median house prices and median gross household income within the Cairngorms National Park 1993-2015
Sources: www.sns.gov.uk/; Bramley and Watkins, 2013 & www.nomisweb.co.uk).
There is also considerable variation in the median house prices across the National Park,
ranging from £100,000 in parts of Badenoch and Strathspey, to £355,500 in part of Deeside
(Figure 16). There were no areas where the median house price / median household
income/earnings ratio was below 4, while the area around Ballater (data zone S0100303)
had the greatest difference, with median house prices being in the region of 10 times median
incomes (Figures 22 - 24). However, it should be noted that the volume of sales for most
data zones is relatively low from year to year and therefore annual median house prices and
income rations can vary, sometimes greatly, from year to year. Certain areas do however
have consistently high median prices, namely Aviemore and its surrounding area, Deeside
and the Perth and Kinross area of the National Park.
Another aspect of this spatial variability is that since 1993 the range of median house prices
has grown significantly. In 1993 the difference between the lowest and highest median price
was £73,005, while in 2015 it was £255,000, a change of nearly 250%. This suggests that
while median house prices have risen in all parts of the National Park, they have grown
significantly faster in certain data zones than it has in others. This change can be observed
spatially in Figure 17 to Figure 21, which shows the change in median prices by data zone at
5 year intervals beginning in 1995. In 1995 only three data zones had a median price in
excess of £100,000. In 2015 the lowest median house price was £100,000 and represented
just one data zone.
19 | P a g e£350,000
£300,000
£250,000
£200,000
£150,000
£100,000
£50,000
£0
1993
1994
1995
1996
1997
1998
1999
2000
2001
2002
2003
2004
2005
2006
2007
2008
2009
2010
2011
2012
2013
2014
2015
Figure 16 Box plots of Median House Prices of data zones within the Cairngorms National Park
(Source: http://www.sns.gov.uk/).
20 | P a g eN
Figure 17 Median House Prices of data zones within the Figure 18 Median House Prices of data zones within the Figure 19 Median House Prices of data zones within the
Cairngorms National Park in 1995. Cairngorms National Park in 2000. Cairngorms National Park in 2005.
0 – £100,000
£100,000 – £150,000
£150,000 – £200,000
£200,000 - £250,000
£250,000 – £300,000
£300,000 – £350,000
£350,000 – £400,000
All maps are at a scale of 1:1,400,000
All maps are reproduced by permission of Ordnance
Survey on behalf of HMSO. © Crown copyright and
database right 2017. All rights reserved. Ordnance
Figure 20 Median House Prices of data zones within the Figure 21 Median House Prices of data zones within the Survey Licence number 100040965 Cairngorms
Cairngorms National Park in 2010. Cairngorms National Park in 2015. National Park Authority.
21 | P a g eFigure 22 Median House Price / Income ratio of data zones
within the Cairngorms National Park in 2005.
Scale:
1:700,000
Figure 23 Median House Price / Income ratio of data zones within the Cairngorms National Park in 2015.
Figure 22 and Figure 24 are at a scale of 1:1,400,000
All maps are reproduced by permission of Ordnance Survey on behalf of HMSO. © Crown copyright and database right
2017. All rights reserved. Ordnance Survey Licence number 100040965 Cairngorms National Park Authority.
Figure 24 Median House Price / Income ratio of data zones
within the Cairngorms National Park in 2010.
22 | P a g eCurrent Asking Prices
The CNPA has carried out several surveys of the current asking price for property within
the National Park based on a search of Estate Agent and property marketing websites. The
first of these was carried out between 17th and 18th September 2015, where it was found
that there were 166 properties for sale and the second on the 19th December 2016 where
108 were identified (Figure 25). In both surveys, the vast majority were within Badenoch
and Strathspey.
180
160
140
No. of properties
120
100
80
60
40
20
0
Flat Terraced Semi-detached Detached All House Types
2015 2016
Figure 25 Property types on sale within the Cairngorms National Park, September 2015 and December 2016.
According to these samples, the median asking price within the National Park in both 2015
and 2016 was £225,000 (Figure 26), which is around 8 times greater than median
income/earnings. Complexities exist in equating this to a median sale price as this will be
dependent on negotiation at the point of sale. Within the National Park, properties priced
below the median are often sold at a price above their asking price and valuation while
properties above often go at or below their valuation.
The high median asking price quoted in this study is likely to be in part due to the current
dominance of large and / or detached units within the sample as the median asking price for
detached properties is around twice that of terraced and semi-detached properties and
around three times that of flats.
The relatively low numbers of small units in the sample may be due to a number of reasons.
Firstly, it is likely that such units are sold quicker than larger units and therefore the number
of properties counted in a sample such as this is always likely to be low. Secondly, based on
information derived from Council Tax payments, it is evident that the National Park
contains a lower proportion of smaller houses than the Scottish average (see Table 11 and
Table 7).
23 | P a g e350
300
Median asking price(£000's)
250
200
150
100
50
0
Flat Terraced Semi-detached Detached All House Types
2015 2016
Figure 26 Median asking price by property type the Cairngorms National Park, September 2015 and December 2016.
While the overall median asking price has remained the same, large rises are seen in the
asking price of flats (39.3%) and semi-detached (29.8%) properties. This is of concern as
these properties are usually those, by virtue of their relatively low cost, favoured by those
on median and below median incomes. The cause of this increase is difficult to ascertain,
however it could simply be a reflection of the small sample size. Indeed the low sample size
is reflected in the significant variability of the median time on market for such properties
(Figure 27).
400
350
300
Median Time on Market (days)
250
200
150
100
50
0
Dec-08 Dec-09 Dec-10 Dec-11 Dec-12 Dec-13 Dec-14 Dec-15 Dec-16
Detached Semi-detached Terraced Flat All House Types
Figure 27 Median time of properties on market in postcode areas covering the Cairngorms National Park 2008-2016
(www.home.co.uk).
24 | P a g eThe way in which property is marketed can also give a strong indication of the nature of the
current market and so the CNPA’s study also collated this information (
35%
30%
25%
20%
15%
10%
5%
0%
2015 2016
Figure 28). It should be noted that this data is highly qualitative in nature, with different
estate agents choosing to market their clients’ property in different ways. However, given
the abundance of large detached properties available, it is unsurprising to find few houses
marketed to first time buyers. It is also significant that a relatively high proportion of
properties are marketed as potential holiday homes, although unsurprising given the
relatively high proportion of such homes within the National Park (Figure 19).
35%
30%
25%
20%
15%
10%
5%
0%
2015 2016
Figure 28 Marketing of properties within the Cairngorms National Park September 2015 and December 2016. Note that
most properties are marketed to more than one type of buyer.
Together, data on incomes, median house prices and the availability of house types reveals
that there is a significant issue within the National Park relating to the provision of
affordable housing for first time buyers and those on or around median incomes.
25 | P a g eCouncil Tax
Council Tax information can also provide an indication of affordability since bands are based
on the value of property. Properties are put into one of eight bands (A-H), based on their
value in April 1991:
Council Council
Ranges of value Ranges of value
tax band tax band
A Up to £27,000 E £58,000 - £80,000
B £27,000 - £35,000 F £800,000 - £106,000
C £35,000 - £45,000 G £106,000 -212,000
D £45,000 - £58,000 H More than £212,000
Table 4 and Table 5 show that there is a lower proportion of properties within bands A
and B, significantly so in the case of band A.
26 | P a g eTable 4 Number of properties by Council Tax band in the Cairngorms National Park in 2015.
Area of
All
National Band A Band B Band C Band D Band E Band F Band G Band H
Dwellings
Park
ABD 1,912 204 275 195 373 330 323 195 17
Highland 7,259 328 1,392 1,715 957 1,447 847 534 39
Moray 422 116 59 98 82 49 9 4 5
PKC 540 33 94 117 111 89 41 35 20
CNPA 10,133 681 1,820 2,125 1,523 1,915 1,220 768 81
Scotland 256,4522 545,892 596,978 413,531 339,654 339,725 192,347 123,009 13,386
Table 5 Proportion of properties by Council Tax band in the Cairngorms National Park in 2015.
Area of
All
National Band A Band B Band C Band D Band E Band F Band G Band H
Dwellings
Park
ABD 100% 10.7% 14.4% 10.2% 19.5% 17.3% 16.9% 10.2% 0.9%
Highland 100% 4.5% 19.2% 23.6% 13.2% 19.9% 11.7% 7.4% 0.5%
Moray 100% 27.5% 14.0% 23.2% 19.4% 11.6% 2.1% 0.9% 1.2%
PKC 100% 6.1% 17.4% 21.7% 20.6% 16.5% 7.6% 6.5% 3.7%
CNPA 100% 6.7% 18.0% 21.0% 15.0% 18.9% 12.0% 7.6% 0.8%
Scotland 100% 21.3% 23.3% 16.1% 13.2% 13.2% 7.5% 4.8% 0.5%
27 | P a g eTime on Market
We also have data on the average length of time properties spent on the market. It can be
seen that in Aviemore there is significant pressure for housing as properties are only on the
market for an average of 53 days. In other parts of the National Park average times are
much longer, with the greatest being in the Tomintoul and Glenlivet area where 638 days is
the average. There may be a number of reasons for this, including the access to jobs and
services the areas offer, but high asking prices are likely to compound this. For example,
according to data the median asking price in the Tomintoul area in May 2017 was £195,000,
more than 6 times the area’s median household income.
All data in the following tables was collected on 24/05/2017 from Home.co.uk
Aberdeenshire Settlements
AB35 (Ballater & Braemar)
Summary
Total properties for sale 27
Properties for sale listed in the last 14 days 3
Mean asking price £334,815
Median asking price £290,000
Mean time on market (days) 231 days
Median time on market (days) 78 days
Average time on market
Asking Price Number of properties
(days)
under £100,000 1 27
£100,000 to £200,000 9 79
£200,000 to £300,000 4 231
£300,000 to £400,000 7 298
£400,000 to £500,000 2 98
£500,000 to £1,000,000 7 575
over £1,000,000 0 -
AB36 (Strathdon)
Summary
Total properties for sale 6
Properties for sale listed in the last 14 days 0
Mean asking price £295,833
Median asking price £217,500
Mean time on market (days) 164 days
Median time on market (days) 100 days
28 | P a g eAverage time on market
Asking Price Number of properties
(days)
under £100,000 0 -
£100,000 to £200,000 3 151
£200,000 to £300,000 2 246
£300,000 to £400,000 0 -
£400,000 to £500,000 0 -
£500,000 to £1,000,000 1 38
over £1,000,000 0 -
29 | P a g eHighland Settlements
Aviemore
Summary
Total properties for sale 5
Properties for sale listed in the last 14 days 2
Mean asking price £192,200
Median asking price £140,000
Mean time on market (days) 53 days
Median time on market (days) 56 days
Average time on market
Asking Price Number of properties
(days)
under £100,000 1 11
£100,000 to £200,000 3 48
£200,000 to £300,000 0 -
£300,000 to £400,000 0 -
£400,000 to £500,000 1 108
£500,000 to £1,000,000 0 -
over £1,000,000 0 -
Grantown-on-Spey
Summary
Total properties for sale 12
Properties for sale listed in the last 14 days 2
Mean asking price £289,667
Median asking price £290,000
Mean time on market (days) 317 days
Median time on market (days) 169 days
Average time on market
Asking Price Number of properties
(days)
under £100,000 1 325
£100,000 to £200,000 2 487
£200,000 to £300,000 4 130
£300,000 to £400,000 3 589
£400,000 to £500,000 2 112
£500,000 to £1,000,000 0 -
over £1,000,000 0 -
30 | P a g ePH21 (Kingussie & Kincarig)
Summary
Total properties for sale 13
Properties for sale listed in the last 14 days 3
Mean asking price £232,077
Median asking price £190,000
Mean time on market (days) 170 days
Median time on market (days) 53 days
Average time on market
Asking Price Number of properties
(days)
under £100,000 1 52
£100,000 to £200,000 7 202
£200,000 to £300,000 2 54
£300,000 to £400,000 1 517
£400,000 to £500,000 2 2
£500,000 to £1,000,000 0 -
over £1,000,000 0 -
PH20 (Newtonmore)
Summary
Total properties for sale 16
Properties for sale listed in the last 14 days 0
Mean asking price £521,281
Median asking price £402,500
Mean time on market (days) 327 days
Median time on market (days) 289 days
Average time on market
Asking Price Number of properties
(days)
under £100,000 4 408
£100,000 to £200,000 0 -
£200,000 to £300,000 3 303
£300,000 to £400,000 1 39
£400,000 to £500,000 5 341
£500,000 to £1,000,000 2 321
over £1,000,000 1 313
31 | P a g eMoray Settlements
AB37 (Tomintoul & Glenlivet)
Summary
Total properties for sale 15
Properties for sale listed in the last 14 days 0
Mean asking price £190,467
Median asking price £195,000
Mean time on market (days) 638 days
Median time on market (days) 425 days
Average time on market
Asking Price Number of properties
(days)
under £100,000 3 723
£100,000 to £200,000 7 876
£200,000 to £300,000 4 299
£300,000 to £400,000 1 68
£400,000 to £500,000 0 -
£500,000 to £1,000,000 0 -
over £1,000,000 0 -
Perth and Kinross Settlements
PH18 (Blair Atholl)
Summary
Total properties for sale 10
Properties for sale listed in the last 14 days 0
Mean asking price £140,795
Median asking price £129,975
Mean time on market (days) 388 days
Median time on market (days) 244 days
Average time on market
Asking Price Number of properties
(days)
under £100,000 4 369
£100,000 to £200,000 4 524
£200,000 to £300,000 1 158
£300,000 to £400,000 1 292
£400,000 to £500,000 0 -
£500,000 to £1,000,000 0 -
over £1,000,000 0 -
32 | P a g eOrigin of Buyers
The origins of house buyers within the Badenoch and Strathspey Housing Market Area
(HMA) (Table 6) is available from Highland Council. The data shows that the around half of
buyers within Badenoch and Strathspey were already resident within the Highland Council
area, with 45% coming from the HMA itself. This is relatively low compared with Highland
as a whole, where 71% of buyers are moving within the authority area. Another feature
particular to the Badenoch Strathspey HMA is the relatively high proportion of migrants
from the rest of Scotland, which is 10% higher than any other HMA within Highland.
Migrants from the rest of the UK and overseas are around the Highland average.
Table 6 Origins of House Buyers in Badenoch and Strathspey 2003-1012 (Highland Council, 2015). Percentages may not
sum due to rounding.
HMA of Within Rest of Rest of Rest of All sales
Overseas Unknown
House HMA Highland Scotland UK (100%)
Badenoch
and 45% 5% 31% 13% 1% 4% 2,309
Strathspey
Highland N/A 71% 15% 11% 1% 3% 32,583
New Build
Between 2000 and 2008 the average completion rate in the National Park was just under
130 dwellings per year. However, the number of fell sharply following the ‘credit crunch’ in
2008 and has resulted in an average annual completion rate of around 70 new dwellings.
Taken over the whole period, the average annual completion rate was about 100 new
dwellings (Figure 29). While an upward trend has been identified since 2013, it is likely that
the ending of the Government’s Help to Buy Scheme (Scotland) in 2016, combined with
continued constraints on mortgage availability, may dampened confidence in the housing
market and limit the development of new homes.
250
200
Number of completions
150
100
50
0
2000 2001 2002 2003 2004 2005 2006 2007 2008 2009 2010 2011 2012 2013 2014 2015 2016
Year
Completions per year Underlying trend
Figure 29 Number of completed dwelling per year in the Cairngorms National Park (Source: Local Authorities).
33 | P a g eBeing the area of the National Park in which most development takes place, completions in
the Highland area of the National Park heavily influence this trend with development peaking
in 2006, and falling to a nadir in 2013 (Figure 30).
250
200
Number of completions
150
100
50
0
2000 2001 2002 2003 2004 2005 2006 2007 2008 2009 2010 2011 2012 2013 2014 2015 2016
Angus Aberdeenshire Highland Moray Perth & Kinross
Figure 30 Number of competed dwelling per year in the Cairngorms National Park by Local Authority area (Source: Local
Authorities).
Table 7 Number of completed dwellings by 5 year period in the Cairngorms National Park by Local Authority area
(Source: Local Authorities).
Local Authority Area 2000-2004 2005-2009 2010-2014 2015-2016 2000-2015
Angus 1 1 0 0 2
Aberdeenshire 111 67 44 31 253
Highland 387 607 263 119 1,376
Moray 8 21 14 0 43
Perth & Kinross 16 11 6 2 35
Total 523 707 327 152 1,640
Table 8 Mean annual completion rates by 5 year periods (representing Local Plan periods), plus the most recent 2 years
(the current LDP period), for the Cairngorms National Park by Local Authority area (Source: Local Authorities).
Local Authority Area 2000-2004 2005-2009 2010-2014 2015-2016 2000-2016
Angus 0.2 0.2 0 0 0.1
Aberdeenshire 22 13 9 15.5 14.9
Highland 77 121 53 59.5 80.9
Moray 2 4 3 0 2.5
Perth & Kinross 16 2 1 1 2.1
Total 104 141 65 76 100.5
34 | P a g eThe number of affordable houses completed across the whole National Park is not available,
however information for Badenoch and Strathspey is. According to data from Highland
Council, since 2004 of the 2005 dwellings completed in the area, 335 met some form of
affordable criteria (Figure 31). It is unsurprising to find that the completion rates in
affordable housing broadly correlate with overall completion rates.
70
60
Number of units
50
40
30
20
10
0
2004 2005 2006 2007 2008 2009 2010 2011 2012 2013 2014 2015
Home Ownership (Rural Housing Ownership Grant)
Home Ownership Private Developer
Home Ownership (Open Market Shared Equity)
Home Ownership (Low Cost Home Ownership - Shared Ownership)
Home Ownership (Low Cost Home Ownership - New Supply Shared Equity)
Housing Association Rent for Special Needs
Housing Association Rent for General Needs
Council House Building Rent
Figure 31 Affordable housing completions by tenure type in Badenoch and Strathspey (Source: Highland Council).
Ineffective Stock
In 2015 the National Park had a higher proportion of ineffective stock (the sum of second
homes and vacant dwellings) than the rest of Scotland (about 17% and 4% respectively) and
indeed its surrounding Local Authorities (Figure 32)
100%
80%
60%
40%
20%
0%
Occupied dwellings Vacant dwellings Second homes
Figure 32 Dwelling occupancy types in the Cairngorms National Park, comparable authorities and Scotland in 2015
(Source: http://www.sns.gov.uk/). 8, 9
8
CNP: Cairngorms National Park; LLTNP: Loch Lomond and Trossachs National Park.
9Second homes are defined as dwellings that are subject to a Council Tax discount of between 10 per cent and 50 per
cent due to being second homes. This includes self-catering holiday accommodation available to let for a total of less than
140 days per year. Second homes which are let out for 140 days or more are not included in these figures.
35 | P a g eSecond homes form the most significant proportion of this ineffective stock. Comparisons
with Scotland’s other authorities in fact demonstrates that the proportion of properties in
second home ownership within the National Park, is significantly higher than elsewhere in
Scotland (Figure 33), accounting for around 12% of all dwellings. Furthermore, the level of
second homes in the Cairngorms National Park is much higher than its sister authority, the
Loch Lomond and Trossachs National Park, where it is around 7%.
12.0%
10.0%
8.0%
6.0%
4.0%
2.0%
0.0%
CNPA
Clackmannanshire
East Ayrshire
East Lothian
East Dunbartonshire
Aberdeen City
Aberdeenshire
Edinburgh, City of
Falkirk
Glasgow City
Highland
West Lothian
North Ayrshire
South Ayrshire
Stirling
Orkney Islands
Renfrewshire
Angus
Dumfries & Galloway
West Dunbartonshire
LLTNPA
Inverclyde
South Lanarkshire
Scotland
Argyll & Bute
Dundee City
Fife
East Renfrewshire
Midlothian
Moray
Na h-Eileanan Siar
North Lanarkshire
Perth & Kinross
Scottish Borders
Shetland Islands
Figure 33 Proportion of dwellings used as second homes by authority area in Scotland in 2015
(Source: http://www.sns.gov.uk/).
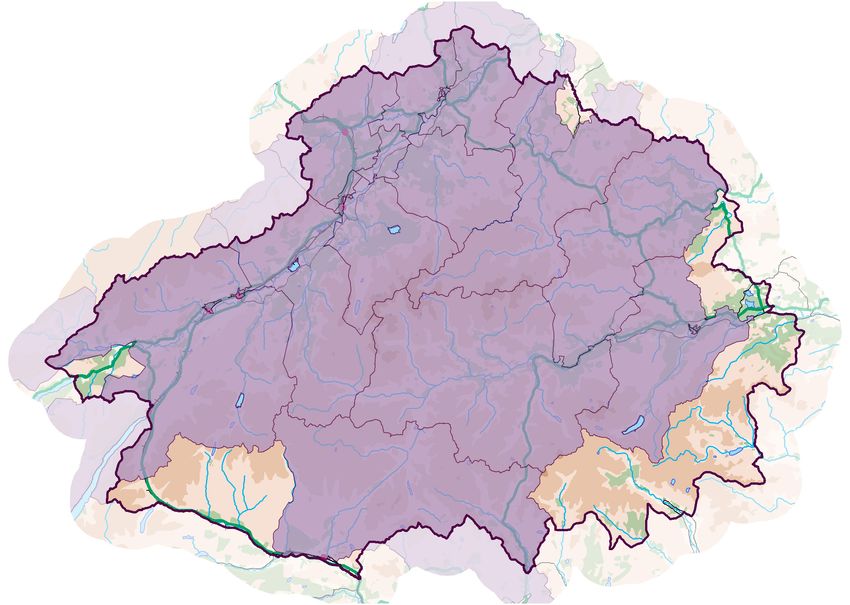
The level of Second homes is not evenly distributed throughout the National Park, with the
proportion of dwellings varying between 2% in data zone S01010544, which covers part of
Grantown-on-Spey, and 21% in data zone S01010535, which covers Kincraig. Table 9 and
Figure 34 shows that overall Badenoch and Strathspey has the lowest proportion of
second homes, however, as it is the most densely developed part of the National Park, it is
also home to the greatest number by some considerable margin. At a local level however,
parts of Strathspey have levels of second homes that are closer area as higher than
anywhere else in the National Park, with the areas around Boat of Garten, Glenmore,
Knicraig, Nethy Bridge experiencing levels of around 18% to 21%.
36 | P a g eTable 9 Ineffective housing stock in 2015 (Source: http://www.sns.gov.uk/).
Area of National Occupied Vacant Second Ineffective
All Dwellings
Park Dwellings Dwellings Homes Stock
Aberdeenshire 1983 77% 11% 14% 25%
Highland 7246 75% 3% 11% 14%
Moray 422 78% 7% 14% 22%
Perth & Kinross 537 77% 10% 13% 23%
CNPA 10188 83% 5% 12% 17%
0 – 4%
4 – 8%
North
8 – 12%
12 – 16%
16 – 20%
20 – 24%
Scale:
1:700,000
Figure 34 Proportion of second homes by data zone in 2015 (Source: http://www.sns.gov.uk/).
Reproduced by permission of Ordnance Survey on behalf of HMSO. © Crown copyright and database right 2017. All rights
reserved. Ordnance Survey Licence number 100040965 Cairngorms National Park Authority.
Further insight into the nature of second home ownership and ineffective stock can be
derived from a comparison with other parts of Scotland.
37 | P a g e0.0% 10.0% 20.0% 30.0% 40.0% 50.0% 60.0% 70.0% 80.0% 90.0% 100.0%
CNP
LLTNP
Scotland
Aberdeen City
Aberdeenshire
Angus
Argyll & Bute
Clackmananshire
Dumfries & Galloway
Dundee City
East Ayrshire
East Dunbartonshire
East Lothain
East Renfrewshire
City of Edinburgh
Eiean Siar
Falkirk
Fife
Glasgow City
Highland
Inverclyde
Midlothian
Moray
North Ayrshire
North Lanarkshire
Orkney Islands
Perth & Kinross
Renfrewshire
Scottish Borders
Shetland Islands
South Aytshire
South Lanarkshire
Stirling
West Dunbartonshire
West Lothian
Figure 35, which shows the percentage of ineffective stock within each data zone and
Figure 36, which shows the percentage of second homes, show that the median for both is
higher than every other authority within Scotland.
38 | P a g e0.0% 10.0% 20.0% 30.0% 40.0% 50.0% 60.0% 70.0% 80.0% 90.0% 100.0%
CNP
LLTNP
Scotland
Aberdeen City
Aberdeenshire
Angus
Argyll & Bute
Clackmananshire
Dumfries & Galloway
Dundee City
East Ayrshire
East Dunbartonshire
East Lothain
East Renfrewshire
City of Edinburgh
Eiean Siar
Falkirk
Fife
Glasgow City
Highland
Inverclyde
Midlothian
Moray
North Ayrshire
North Lanarkshire
Orkney Islands
Perth & Kinross
Renfrewshire
Scottish Borders
Shetland Islands
South Aytshire
South Lanarkshire
Stirling
West Dunbartonshire
West Lothian
Figure 35 Percentage of dwellings in each data zone that are ineffective stock (vacant and second homes) in each
authority area in 2015 (Source: http://www.sns.gov.uk/).
39 | P a g eYou can also read