UBS Global Oil & Gas Conference - Core Oil Delaware Basin Pure-Play May 21, 2019

Page created by Stephen Tran
 
CONTINUE READING
UBS Global Oil & Gas Conference - Core Oil Delaware Basin Pure-Play May 21, 2019
Core Oil
Delaware Basin Pure-Play

 UBS Global Oil & Gas
     Conference

       May 21, 2019
UBS Global Oil & Gas Conference - Core Oil Delaware Basin Pure-Play May 21, 2019
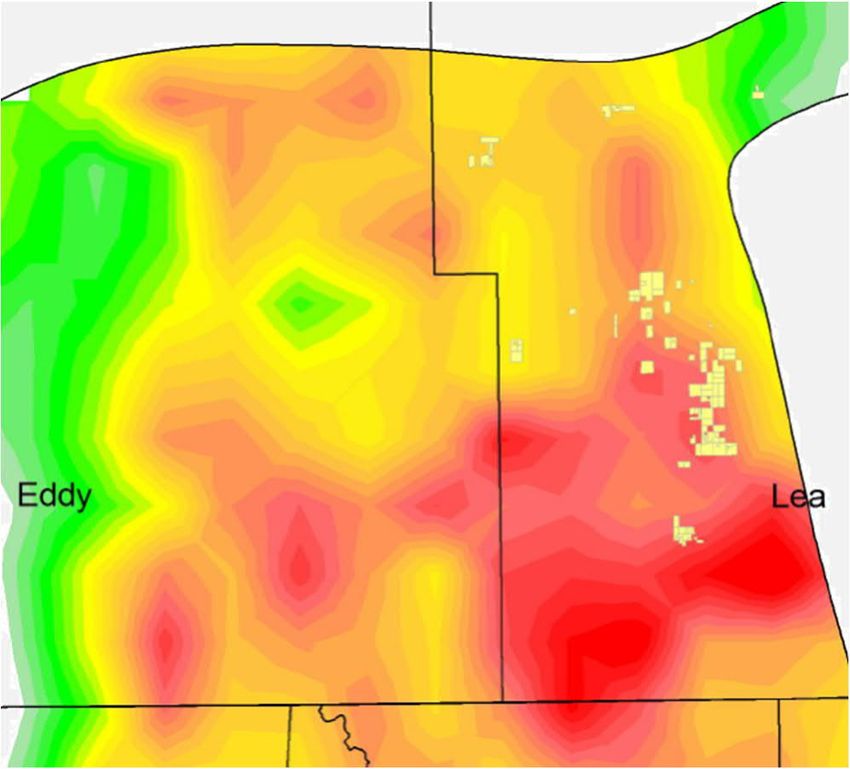
Important Information
Forward-Looking Statements
The information in this presentation includes “forward-looking statements” within the meaning of Section 27A of the Securities Act of 1933, as amended, and Section 21E
of the Securities Exchange Act of 1934, as amended. All statements, other than statements of historical fact included in this presentation, regarding our strategy, future
operations, financial position, estimated revenues and losses, projected costs, prospects, plans and objectives of management are forward-looking statements. When
used in this presentation, the words “could,” “believe,” “anticipate,” “intend,” “estimate,” “expect,” “project,” “goal,” “plan,” “target” and similar expressions are intended to
identify forward-looking statements, although not all forward-looking statements contain such identifying words.            These forward-looking statements are based on
management’s current expectations and assumptions about future events and are based on currently available information as to the outcome and timing of future events.
We caution you that these forward-looking statements are subject to all of the risks and uncertainties, most of which are difficult to predict and many of which are beyond
our control, incident to the development, production, gathering and sale of oil and natural gas. These risks include, but are not limited to, commodity price volatility,
inflation, lack of availability of drilling and production equipment and services, environmental risks, drilling and other operating risks, regulatory changes, the uncertainty
inherent in estimating reserves and in projecting future rates of production, cash flow and access to capital, the timing of development expenditures and the other risks
described in our filings with the Securities and Exchange Commission. Except as otherwise required by applicable law, we disclaim any duty to update any forward-
looking statements, all of which are expressly qualified by the statements in this section, to reflect events or circumstances after the date of this presentation.

Use of Non-GAAP Financial Measures
This presentation includes the non-GAAP financial measure, Adjusted EBITDAX. Please refer to slide 19 for a reconciliation of Adjusted EBITDAX to net income, the most
comparable GAAP measure. We believe Adjusted EBITDAX is useful as it allows us to more effectively evaluate our operating performance and compare the results of
our operations from period to period and against our peers without regard to financing methods or capital structure. We exclude the items listed on slide 19 from net
income (loss) in arriving at Adjusted EBITDAX because these amounts can vary substantially from company to company within our industry depending upon accounting
methods and book values of assets, capital structures and the method by which the assets were acquired. Adjusted EBITDAX should not be considered as an alternative
to, or more meaningful than, net income as determined in accordance with GAAP or as an indicator of our operating performance or liquidity. Certain items excluded from
Adjusted EBITDAX are significant components in understanding and assessing a company’s financial performance, such as a company’s cost of capital and tax structure,
as well as the historic cost of depreciable assets, none of which are components of Adjusted EBITDAX. Our presentation of Adjusted EBITDAX should not be construed
as an inference that our results will be unaffected by unusual or non-recurring items. Our computations of Adjusted EBITDAX may not be comparable to other similarly
titled measures of other companies.

                                                                                                                                                                                2
UBS Global Oil & Gas Conference - Core Oil Delaware Basin Pure-Play May 21, 2019
Centennial Resource Development Overview
       Company Overview                                                                Areas of Operation

         § Large, contiguous oil rich position in the Delaware Basin

               ‒ ~80,000 net acres in the core of the basin

               ‒ 89% operatorship allows for control of development                                            New Mexico   Texas

               ‒ Currently running 6 rigs across acreage position

               ‒ Q1 oil production of 40.5 Mbo/d (28% growth year-over-year)                                                                MIDLAND
                                                                                                            Lea                              BASIN
         § Top-tier technical team delivering differentiated results

         § Maintaining competitive cost structure and financial discipline
                                                                                            DELAWARE
         § Access to advantaged oil and gas infrastructure and takeaway                       BASIN

         § Conservative balance sheet and strong liquidity                                                                                   Midland

       Operational Overview                                                                           Reeves

     Production                                                          Q1 2019
     Total production (Boe/d)                                                72,035
     Oil production (Bbls/d)                                                 40,508
        % oil                                                                  56%
     Acreage                                                                 YE 2018
     Total net acreage                                                   ~80,200
        % CDEV Operated                                                        89%
     Proved reserves                                                         YE 2018          Northern Delaware                       Southern Delaware

     Total proved res erves (MBoe)                                       261,826       § Net acres: ~16,500                    § Net acres: ~63,700
        % growth (y-o-y)                                                       40%     § 2019 drilling plan: 1-2 rigs          § 2019 drilling plan: 4-5 rigs

Note: Acreage figures as of December 31, 2018
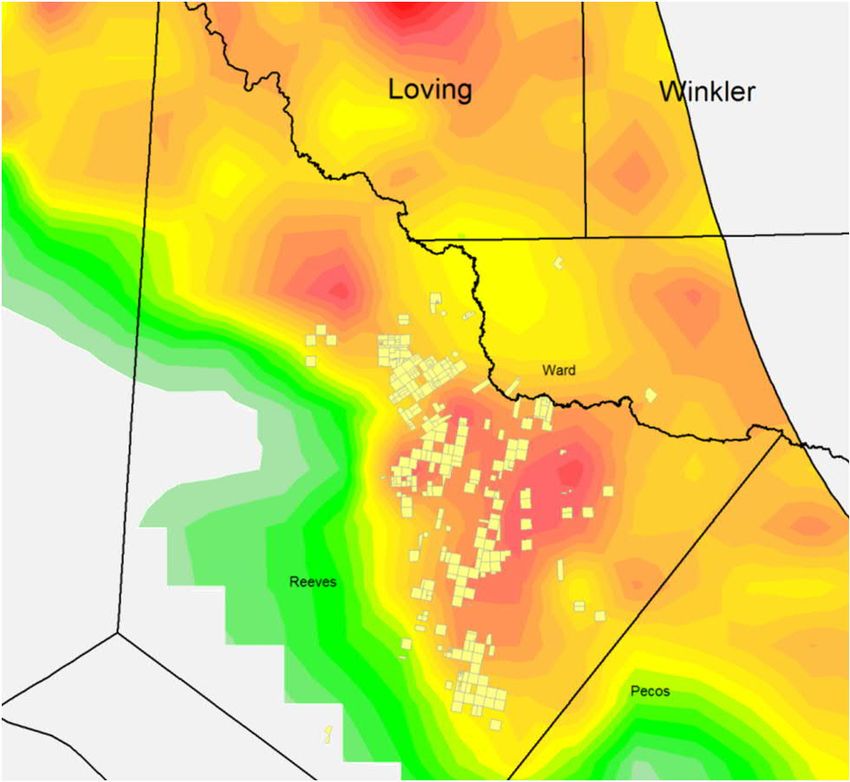
                                                                                                                                                                3
High Quality Acreage Position in Core of the Delaware
           Delaware Basin Well Productivity (Peak, Normalized 90-Day Oil - Bo/d/ft.)

                                                                       Maximum Oil                                                                            Minimum Oil
                                                        Scale                                                                                                 Productivity
                                                                       Productivity

           Southern Delaware Basin                                                                       Northern Delaware Basin

                                                                            Loving             Winkler

                                                                                      Ward

                                                                                                                Eddy                                                  Lea

                                  Lea                             Reeves                                                      Lea

                        Lov ing                         Winkler                                                     Lov ing                         Winkler

                                                                                             Pecos
                                        Ward                                                                                        Ward

              Reev es                                                                                     Reev es

                                               Pec os                                                                                      Pec os

Source: IHS Petra: Geological Interpretation Software

                                                                                                                                                                             4
Southern Delaware Basin Well Productivity
          Average 2018 Well Performance (6-Month Cumulative Oil Production, Mbo)

                                 125
                                           *Excerpt from JP Morgan Equity Research
                                           SMID Cap Peers: CPE, CRZO, JAG and PDCE
                                           Large Cap Peers: CXO, EOG                                                              CDEV

                                 100
          Cumulative Oil (Mbo)

                                 75

                                 50

                                 25

                                  0
                                       0                   1                  2            3                 4                5   6
                                                                                     Months on Production

                                                                             CDEV        SMID Peers         Large Cap Peers

Source: JP Morgan Equity Research and DrillingInfo
Note: Peers include CXO, CPE, CRZO, EOG, JAG and PDCE
                                                                                                                                         5
Well Productivity Drives Returns
              2018 Cash Return on Capital Invested

              *Excerpt from U.S. Capital Advisors Equity Research
                                                                                                Peer Results
                                                                                                Permian Peers

                    16%

                   CDEV

Source: U.S. Capital Advisors Equity Research, Bloomberg and U.S. Capital Advisors estimates.
Note: Permian peers include CPE, CRZO, CXO, FANG, HK, LPI, MTDR, PE, PXD, SM, QEP and WPX
                                                                                                                6
Centennial Q1 2019 Highlights: Continued Execution
      Q1 2019 Highlights                                                                                CDEV Q1’19 Results vs FY 2018 Avg (Upper WC A)1

         § Increased daily oil and equivalent                                                                                  70
           production 28% and 33% year-over-year,                                                                                                             Q1’19 well results are tracking
                                                                                                                                                              ~8% ahead of FY 2018 results
           respectively
                                                                                                                               60
         § Announced strong well results from
           multiple intervals in the Northern and
           Southern Delaware Basins
                                                                                                                               50

              ‒ Reported successful 3rd Bone Spring

                                                                                                        Cumulative Oil (Mbo)
                Sand step-out in Reeves County
                                                                                                                               40
         § All unit costs at or below the low-end of
           guidance
                                                                                                                               30
         § One of the few mid-caps to secure
           takeaway for essentially all crude oil and
           residue natural gas out of the Permian                                                                              20
           Basin

         § Maintained conservative balance sheet
           and strong liquidity                                                                                                10                                    Q1 2019 CDEV Upper WC A Average
                                                                                                                                                                     FY 2018 CDEV Upper WC A Average
              ‒ Net Debt / Book Cap. of 20%
                                                                                                                               0
              ‒ Net Debt / LTM EBITDAX of 1.3x                                                                                      0     10   20           30         40           50           60
                                                                                                                                                    Days on Production

(1)   Well results shown on a non-normalized basis; Q1 2019 average lateral length of 7,836 and FY 2018 average lateral length of 7,842

                                                                                                                                                                                                       7
Reeves County Downspacing Test Outperforming
             §                              Strong Upper Wolfcamp A 3-well pad from recently completed Doc                    Reeves County Well Locator Map
                                            Martens 3H, 9H and 16H
                                            –       Average IP-30 of 1,775 Boe/d; oil IP-30 of 1,444 Bo/d
                                            –       Wells successfully spaced at 660’ (8 wells / section) compared to
                                                    880’ (6 wells / section) assumed for Wolfcamp A inventory
                                                                                                                                                     Doc Martens 3-Well Pad
                                            –       Pad performance significantly exceeding legacy results and initial                                    660’ in-zone spacing
                                                    expectations
                                            –       Pad directly offsetting depletion from existing producers
             §                              Results further support Q4’18 acquisition of 2,100 net acres contiguous to
                                            the Doc Martens section

        Doc Martens Pad Well Results - Cum. Oil (Mbo)

                                           50
                                                             Doc Martens Pad Average (3 wells)
                                                             Avg FY'18 1.5 Mile Lateral Result (All Zones)
         Cumulative Oil Production (Mbo)

                                           40

                                           30

                                                                                                                                           Ward
                                           20

                                                                                                     Doc Martens Pad
                                                                                                       ~7,600’ Lateral
                                           10                                                           Upper WC A
                                                                                                     IP-30: 1,444 Bo/d                                              Q4’18 Acquisition
                                                                                                                                 Reeves
                                                                                                          81% Oil1                                                 Existing CDEV WC A Producers
                                           0                                                                                                                       Doc Martens Pad
                                                0            5         10           15         20        25              30                       Pecos
                                                                            Days on Production

Note: Cumulative oil production curves shown on an non-normalized basis
(1)   % Oil figures shown on a 2-stream basis
                                                                                                                                                                                              8
Extending the 3rd Bone Spring Boundaries
             Strong Fundamental A T45H - Cum. Oil (Mbo)                                                          Reeves County Well Locator Map1

                                             50                                                                                                    Strong Fundamental A T45H
                                                              Strong Fundamental A T45H                                                            Recent CDEV 3rd Bone Spring Sand Tests
                                                                                                                                                   Industry 3rd Bone Spring Sand Tests since 2015
                                                              Avg FY'18 2 Mile Lateral Result (All Zones)
                                             40
           Cumulative Oil Production (Mbo)

                                             30                                                                               Reeves                       Ward
                                                                                                                                                                        Historical Industry
                                                                                                                                                                      3rd Bone Spring Sand
                                                                                                                                                                           Development
                                             20

                                                                                                                   Strong Fundamental A
                                             10                                                                              T45H
                                                                                                                        ~9,100’ Lateral
                                                                                                                          rd
                                                                                                                         3 BS Sand
                                                                                                                      IP-30: 1,426 Bo/d
                                                                                                                           59% Oil2
                                             0
                                                  0       5          10       15       20           25      30
                                                                      Days on Production

           §                                  One of the strongest CDEV 3rd Bone Spring Sand wells drilled
                                              to date with an oil IP-30 of 1,426 Bo/d

           §                                  Important test to confirm 3rd Bone Spring Sand productivity on
                                              CDEV acreage outside of the traditional industry fairway
                                                                                                                                                                                 Pecos
           §                                  Additional development activity planned for 2019                                                                                     0           30,000

                                                                                                                                                                                        FEET

Note: Cumulative oil production curves shown on an non-normalized basis
(1)   Source: IHS Petra
(2)   % Oil figures shown on a 2-stream basis                                                                                                                                                           9
Airstream 502H Continues to Outperform
             Airstream 24 State Com 502H - Cum. Oil (Mbo)                                                                 Lea County Well Locator Map

                                               140
                                                                  Airstream 24 State Com 502H
                                                                  Avg FY'18 2 Mile Lateral Results (All Zones)
                                               120

                                               100
             Cumulative Oil Production (Mbo)

                                               80

                                               60

                                               40

                                               20

                                                0
                                                     0                          30                          60       90                           Airstream 502H
                                                                                      Days on Production                                          ~10,000’ Lateral
                                                                                                                                                    2nd BS Sand
                                                                                                                                                 IP-30: 1,983 Bo/d
            §                                   Strongest CDEV 2nd Bone Spring Sand well drilled to date                                         IP-90: 1,550 Bo/d
                                                                                                                                                      83% Oil1
                                                –        One of the best 2nd Bone Spring wells drilled in the area

            §                                   First two mile 2nd Bone Spring well drilled by CDEV

            §                                   Directly offsetting producers from the same interval
                                                                                                                                               Existing CDEV 2nd Bone
            §                                   Continues to outperform average two mile well after 90 days                                    Spring Sand Producers

Note: Cumulative oil production curves shown on an non-normalized basis
(1)   % Oil figures shown on a 2-stream basis
                                                                                                                                                                        10
Delivering on Competitive Unit Costs
       Q1 2019 Results vs Feb ’19 Guidance

      ü   LOE ($ / Boe)                                         ü      GP&T ($ / Boe)                                     ü   Cash G&A ($ / Boe)                      ü    DD&A ($ / Boe)

                $4.95                                                                                                                                                         $17.50
                                                                              $3.25                                                 $2.75
                                          $4.61

                                                                              $2.75                                                                                                                  $14.89
                $4.35                                                                                                                                                         $15.50
                                                                                                        $2.32                       $2.25
                                                                                                                                                       $1.89

                                                                                                                                                                                        Russell 6H
                                                                                                                                                                                            &
                                                                                                                                                                                       Stephens 2H
               Guidance                  Actual                            Guidance                     Actual                     Guidance            Actual                Guidance                Actual

       Q1’19 Unit Cost Benchmarking1

      Lease Operating Expense ($ / Boe) vs Permian Peers                                                                  Cash G&A Expense ($ / Boe) vs Permian Peers

        Peer Group Avg: $5.022                                                                                             Peer Group Avg: $2.332

                                                                                                                 $6.63
                                                                                                      $6.13                                                                                                   $3.17
                                                                         $5.78        $5.87                                                                                                     $2.90
                                                                                                                                                                                       $2.81
                                              $4.61        $4.61                                                                                                           $2.54
                                                                                                                                              $2.08       $2.27   $2.28
                                 $4.14
                    $3.65                                                                                                             $1.89
       $3.34

                                                                                                                          $0.55

      Peer 1       Peer 2       Peer 3        CDEV         Peer 4       Peer 5        Peer 6      Peer 7         Peer 8   Peer 1      CDEV    Peer 2     Peer 3   Peer 4   Peer 5      Peer 6   Peer 7        Peer 8

(1)   As of 3/31/19 public filings; peer group includes CPE, CXO, FANG, JAG, MTDR, LPI, PE and W PX
(2)   Peer average does not include CDEV
                                                                                                                                                                                                                  11
Crude & Natural Gas Flow Assurance Summary
 ü   Crude oil basis and takeaway risk mitigated through firm sales contracts

     –   In total, secured takeaway for >50,000 Bo/d gross in 2019 through firm sales agreements with major, integrated oil
         companies

     –   Contracts allow for full development plan flexibility

     –   Access to a diversified set of price indices over the life of the contracts

 ü   Flow assurance in place for all Centennial produced natural gas

     –   CDEV has secured takeaway for ~100% of expected residue gas through firm sales and firm transportation
         agreements from 2019 into 2022

     –   We have not and do not anticipate flaring any material amounts of gas

     –   Allows for realization of NGL revenue stream (12% of Q1 revenue)

 ü   Near-term Waha exposure limited due to firm transportation contracts and hedge profile

     –   90,000 gross MMBtu/d from Q2’19 – Q4’20 to be sold at a Mid-Continent based price, limiting Waha exposure for
         the majority of anticipated production over that period

     –   35,000 MMBtu/d and 15,000 MMBtu/d of Waha basis and fixed price hedges in place for remainder of 2019,
         respectively

                                                                                                                              12
Capital Structure and Liquidity Overview
           Capital structure overview                                                                                    Capitalization and Liquidity ($ mm)

         §      Borrowing base increased by 20% to $1.2bn during Spring Redetermination                                 Capitalization
                                                                                                                                                                        Actual
                                                                                                                                                               (as of 3/31/19)
         §      Credit facility undrawn as of 3/31/19                                                                   Cash and cash equivalents                        $89

         §      Conservative leverage profile                                                                           Revolving credit facility                         $0
                                                                                                                                                    1
                                                                                                                        Senior Unsecured Notes                         $900
                ¾ Net Debt / Total Book Capitalization of 20%
                                                                                                                        Total debt                                     $900
                ¾ Net Debt / LTM EBITDAX of 1.3x
                                                                                                                         Book equity 2                                $3,242

         §      Credit facility matures in 2023, Senior Notes mature in 2026 and 2027                                   Total capitalization                          $4,142

                                                                                                                        Credit statistics
           Debt maturity schedule ($ mm)                                                                                Net debt / LTM EBITDAX                          1.3x

               Credit Facility Borrowings                                 $1,200                                        Net debt / book capitalization                  20%
               5.375% Senior Unsecured Notes                               Borrowing
                                                                             Base3
               6.875% Senior Unsecured Notes                                                                            Liquidity ($ mm)

                                                                                                                        Borrowing bas e 3                             $1,200
                                                                            $800
                                                                           Elected
                                                                         Commitments                                    Elected Commitment                             $800

                                                                                                                 $500    Les s: Revolver borrowings                       $0
                                                                                                          $400
                                                                                                                         Les s: Letters of credit                        ($1)
                                            No borrowings
                                             as of 3/31/19                                                               Plus: Cash                                      $89

                                                                             $0                                         Elected liquidity 4                            $889
                 2019           2020           2021          2022           2023          2024     2025   2026   2027
                                                                                                                         Borrowing b ase utilization                      0%

Note: Amounts may not sum due to rounding
(1)   Reflects the aggregate principal amount
(2)
(3)
      Book equity includes non-controlling interest
      Borrowing base pro-forma for Spring 2019 Redetermination
                                                                                                                                                                                 13
(4)   Elected liquidity calculation based on elected commitment amount, not total borrowing base
Industry Benchmarking – Net Debt / Book Capitalization
         Net Debt / Book Capitalization (as of Q1’19)

        70%
                                                                                                                                                                                               Permian Peers

        60%

        50%

        40%
                                                                                                                                                                                          Industry Median: 36%

        30%

                                                                                                                                                                                                        20%
        20%

        10%

          0%
                                                                                                                                                                                                       CDEV

Source: Company filings and financials
Note: Peers represent public U.S. E&P companies with market cap over $1bn; all peers shown as of 3/31/19. Permian peers include CPE, CRZO, CXO, FANG, HK, JAG, LPI, MTDR, PE, PXD, QEP,
SM and W PX                                                                                                                                                                                                      14
Centennial Resource Development Highlights

             Large, contiguous oil-rich position in core of the Delaware Basin

                  Top-tier technical team delivering differentiated results

              Maintaining competitive cost structure and financial discipline

              Access to advantaged oil and gas infrastructure and takeaway

                           Low leverage profile, strong liquidity

                                                                                15
Appendix

           16
Q1 2019 Financial Results
                              Financial summary ($mm, unless otherwise noted)1

                                                                                                                                                     2018                                                    2019

                            ($ in millions, unless specified)                                             Q1                           Q2                           Q3                           Q4          Q1

                               Average Daily Production (Boe/d)                                        54,069                       57,528                       62,930                       69,609        72,035
                               Average Daily Oil Production (Bo/d)                                     31,573                       31,271                       36,027                       39,978        40,508
                                  % Oil                                                                 58%                          54%                          57%                          57%          56%
                            Financial highlights
                               Total Revenue                                                           $215.9                       $217.8                       $234.9                       $222.5        $214.6
                               Adjusted EBITDAX2                                                       $161.6                       $164.6                       $177.9                       $165.7        $141.1
                               Net Income (loss)3                                                       $66.1                        $63.5                        $39.3                        $31.0        ($8.1)
                            Unit Costs ($/Boe)
                               Lease Operating Expense                                                  $3.34                        $3.66                        $4.09                        $3.77        $4.61
                               Gathering, Processing & Transportation                                    2.84                         2.92                         2.78                         1.94         2.32
                               Severance & Ad Valorem Taxes                                              2.91                         2.71                         2.49                         2.14         2.49
                               Cash G&A                                                                  2.13                         1.84                         2.02                         2.00         1.89
                               Depreciation, Depletion & Amortization                                   13.57                        14.32                        14.41                        15.94        14.89
                            Capital Expenditures Incurred
                               Drilling & Completion                                                   $181.8                       $162.7                       $222.4                       $199.2        $188.4
                               Facilities, Seismic and Other                                             50.2                         34.3                         43.5                         73.1         45.6
                               Land and Other                                                             6.3                          6.2                          7.7                          9.8         11.2
                               Total Capital Expenditures                                              $238.3                       $203.2                       $273.6                       $282.1        $245.2
                               Cash and Cash Equivalents                                                $38.2                        $42.7                        $58.9                        $18.2        $89.5
                               Total Debt Outstanding                                                  $400.0                       $430.0                       $540.0                       $700.0        $900.0
                               Liquidity4                                                              $637.4                       $611.8                       $518.0                       $517.4        $888.7

(1)   Amounts may not sum due to rounding
(2)   Adjusted EBITDAX is not presented in accordance with generally accepted accounting principles in the United States. Please refer to slide 19 for a reconciliation of Adjusted EBITDAX to net income

(3)
      (loss), the most comparable GAAP measure.
      Net income (loss) attributable to common shareholders. Figure reflects a Q1’19 impairment charge of $31.3mm
                                                                                                                                                                                                                     17
(4)   Liquidity defined as cash, plus availability under the revolving credit facility
Hedge Position Overview
                                                                    FY 2019 (9 months ended 12/31/19)
                                                           Q2             Q3               Q4           Bal 2019
                  MidCush Basis Swaps
                     Total Volume (Bbl)                  91,000       1,380,000          920,000        2,391,000
                     Daily Volume (Bbl/d)                 1,000         15,000           10,000           8,695
                     Weighted Average Price ($ / Bbl)    ($10.00)       ($9.03)           ($4.24)        ($7.22)

                  Henry Hub Fixed Price Swaps
                     Total Volume (MMBtu)               2,730,000     2,760,000         2,760,000       8,250,000
                     Total Volume (MMBtu/d)              30,000         30,000           30,000          30,000
                     Weighted Average Price ($/MMBtu)     $2.78         $2.78             $2.78           $2.78

                  Waha Fixed Price Swaps
                     Total Volume (MMBtu)               1,365,000     1,380,000         1,380,000       4,125,000
                     Daily Volume (MMBtu/d)              15,000         15,000           15,000          15,000
                     Weighted Average Price ($/MMBtu)     $1.61         $1.61             $1.61           $1.61

                  Waha Differential Basis Swaps
                     Total Volume (MMBtu)               3,185,000     3,220,000         3,220,000       9,625,000
                     Daily Volume (MMBtu/d)              35,000         35,000           35,000          35,000
                     Weighted Average Price ($/MMBtu)    ($1.31)        ($1.31)           ($1.31)        ($1.31)

Note: Hedge positions as of March 31, 2019

                                                                                                                    18
Reconciliation of Adjusted EBITDAX to Net Income (Loss)

         Adjusted EBITDAX reconciliation ($ thousands)1

                                                                                        Q1 2018                  Q2 2018               Q3 2018            Q4 2018               2018                2019

                                                                                      3 months ended            3 months ended        3 months ended     3 months ended     12 months ended      3 months ended
      Adjusted EBITDAX reconciliation to net income (loss):                            March 31, 2018             June 30, 2018         Sept. 30, 2018     Dec. 31, 2018       Dec. 31, 2018      March 31, 2019

      Net income (loss) attributable to common shareholders                                    $66,090                     $63,541           $39,288           $30,980            $199,899              ($8,112)

      Net income (loss) attributable to noncontrolling interest                                   4,682                      3,941             2,386              1,828            $12,837                  (425)

      Interest expense                                                                            5,813                      5,791             6,534              8,220            $26,358                 10,160

      Income tax expense (benefit)                                                              19,137                      19,940            11,652              8,711            $59,440                 (2,263)

      Depreciation, depletion and amortization                                                  66,010                      74,946            83,423           102,083            $326,462                 96,558

      Impairment and abandonment expenses                                                             -                      1,784             8,612                740                11,136              31,264

      Non-cash portion of derivative (gain) loss                                                 (7,482)                   (11,534)           18,437              5,853                 5,274               5,494

      Stock-based compensation expense                                                            3,952                      4,166             4,888              5,848                18,854               5,884

      Exploration expense                                                                         3,447                      1,867             2,712              1,942                 9,968               2,516

      Transaction costs                                                                               -                         -                  -                  -                    -                   -

      (Gain) loss on sale of oil and natural gas properties                                         (15)                      141                (52)               (549)                (475)                     2

      Adjusted EBITDAX                                                                       $161,634                  $164,583             $177,880          $165,656            $669,753            $141,078

(1)   Adjusted EBITDAX is not presented in accordance with generally accepted accounting principles in the United States

                                                                                                                                                                                                                       19
You can also read