UC Merced Frontiers of Biogeography - eScholarship
←
→
Page content transcription
If your browser does not render page correctly, please read the page content below
UC Merced
Frontiers of Biogeography

Title
Geographic and ecological segregation in an extinct guild of flightless birds: New
Zealand’s moa

Permalink
https://escholarship.org/uc/item/2m85q6d5

Journal
Frontiers of Biogeography, 13(4)

Authors
Lomolino, Mark V.
Tomlinson, Sean
Wood, Jamie
et al.

Publication Date
2021

DOI
10.21425/F5FBG53416

Supplemental Material
https://escholarship.org/uc/item/2m85q6d5#supplemental

Copyright Information
Copyright 2021 by the author(s).This work is made available under the terms of a
Creative Commons Attribution License, available at
https://creativecommons.org/licenses/by/4.0/

Peer reviewed

 eScholarship.org                               Powered by the California Digital Library
                                                                University of California
a
Frontiers of Biogeography 2021, 13.4, e53416
Frontiers of Biogeography
Research Article the scientific journal of
the International Biogeography Society
Geographic and ecological segregation in an extinct guild of flightless
birds: New Zealand’s moa
Mark V. Lomolino1* , Sean Tomlinson2 , Jamie Wood3 ,
Janet Wilmshurst3 and Damien A. Fordham2
1
Department of Environmental and Forest Biology, SUNY College of Environmental Science and Forestry, Syracuse, NY,
13210, USA; 2 School of Biological Sciences, University of Adelaide, Adelaide, SA, 5000, Australia; 3 Manaaki Whenua
Landcare Research, Lincoln, Canterbury, 7608, New Zealand.
*Corresponding author: Mark V. Lomolino, island@esf.edu
Abstract Highlights
The nine currently recognized species of moa (Order – • In the absence of non-volant mammals, moa became
Dinornithiformes; Bonaparte 1853) suffered extinction evolutionary marvels – losing their power of flight
soon after New Zealand was settled by humans. They were and undergoing gigantism to comprise a guild
the result of an evolutionary radiation that produced a converging to fill the vacant, large herbivore niche
unique guild of birds – giant, and totally wingless species in New Zealand.
that evolved in the absence of non-volant mammals.
Recent advances in dating and paleoclimatology, and • Evolutionary divergence of moa produced a lineage
compilations of data on distributions of the nine species that collectively exploited a broad range of habitats
of moa, along with information on the geographic, across New Zealand, with different species segregating
topographic, climatic and edaphic characteristics of their niches along a combination of geographic and
sites from which moa remains have been recovered, ecological (environmental) dimensions.
enabled us to test whether their evolutionary radiation
truly was ‘adaptive’, producing ecologically distinct • Moa exhibited a marked surge in elevational limits
species. Randomization, resampling analyses of moa within the past four or five millennia – this possibly
distributions across North and South Islands revealed associated with concurrent shifts in climate and
highly significant geographic and ecological segregation, vegetation zones, and possibly later amplified
with different species tending to occupy different islands, by anthropogenic factors (the introduction of
regions within islands, or elevations within regions.
Polynesian rats [Rattus exulans] and establishment
Quadratic Discriminant Analyses demonstrated niche
segregation at even finer scales, including that based and subsequent expansion of ecologically significant
on vegetation‑defined habitats and on local climatic, populations of Māori).
topographic and edaphic conditions. Moa distributions
also appear to have been dynamic over time, shifting
in their upper elevational limits as climatic conditions
changed and vegetative zones shifted upward during the
Holocene Epoch. Our ongoing studies are building on the
results presented here to explore the temporal dynamics
of moa distributions, assess differential responses of
moa species to natural and anthropogenic drivers, and
determine how these forces may have combined to cause
the extinction of moa just a few centuries ago.
Keywords: adaptive radiation, Dinornithiformes, evolution, geographic range, moa, New Zealand, niches, paleoecology
Introduction and informative phenomena because, among other
reasons, they demonstrate the complex yet compelling
Adaptive radiations describe the ecological and interplay of ecological and evolutionary forces.
evolutionary diversification of monophyletic lineages, Some evolutionary radiations may, however, appear
largely driven by divergent selection from competition non‑adaptive – yielding lineages with only negligible
among closely related species (Lomolino et al. segregation of functional niches and ecological
2017). They are among nature’s most intriguing character (see Rundell and Price 2009).
e-ISSN: 1948-6596 https://escholarship.org/uc/fb doi:10.21425/F5FBG53416
© the authors, CC-BY 4.0 license 1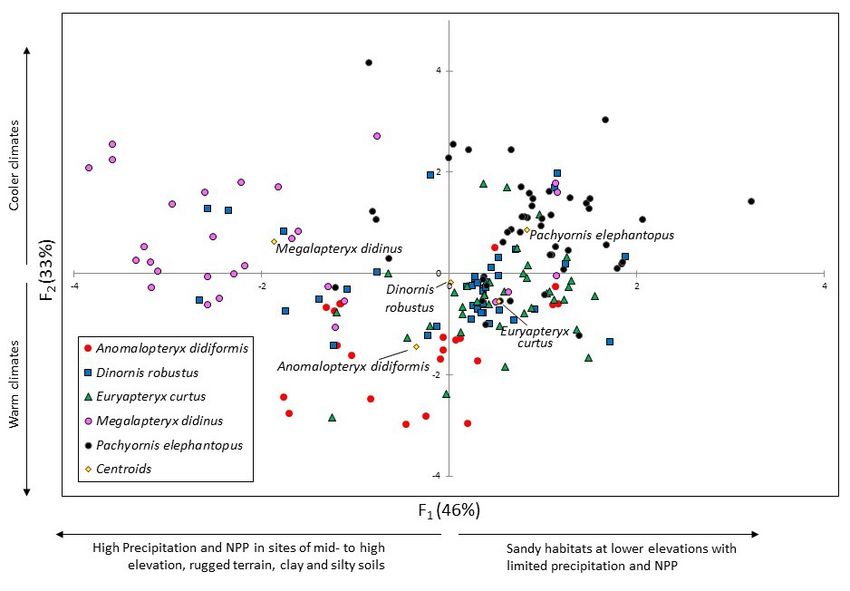
Lomolino et al.                                                               Geographic and ecological segregation of moa

    Evolutionary diversification of New Zealand’s now         diversification and extinction, surviving the Oligocene
extinct moa (Fig. 1) was not nearly as extensive in           marine transgression (~ 22 Ma) and its consequent
numbers as some of the more spectacular cases (e.g.,          reduction of New Zealand’s land area, with moa
Hawaiian honeycreepers and lobeliads (Callicrate et al.       persisting as a remnant, and possibly monospecific
2014, Givnish et al. 2009); Madagascar’s lemurs               lineage (Bunce et al. 2009; but see also Tennyson et al.
and other Malagasy animals and plants (Wirta et al.           2010, which suggests two moa species may have
2008, Reddy et al. 2012, Herrera 2017) or the cichlids        persisted at this time). The current diversity of moa,
of East Africa’s Rift Valley Lakes (Salzburger et al.         thus, appears to have arisen relatively recently, being
2014, McGee et al. 2016)). Nonetheless, it produced           closely associated with uplift of the Southern Alps
one of the most anomalous assemblages of native               (5 – 8.5 Ma; Fig. 1), which simultaneously created
vertebrates known to science – giant wingless birds           intra-island dispersal barriers and increased diversity
that converged on the large herbivore niches typically        of habitats and potential niches (Bunce et al. 2009).
filled on continents by ungulates. The ancestors                  Biologists have speculated on the ecological
of this lineage were volant birds that colonized              associations of moa since the earliest descriptions of
the islands around 58 Ma (Mitchell et al. 2014).              the species by Sir Richard Owen in 1839 (see review by
The lineage likely underwent alternating periods of           Worthy 1990). The earliest inferences were based on

Figure 1. Comparisons of the distributions and body sizes (mass and body length) of all nine currently recognized species
of moas (modified after Bunce et al. 2009; mass estimates after Latham et al. 2020).

Frontiers of Biogeography 2021, 13.4, e53416                                       © the authors, CC-BY 4.0 license     2
Lomolino et al.                                                             Geographic and ecological segregation of moa

morphology, suggesting that the mass and structure           the temporal dynamics in the ranges and ecological
of their beaks, necks and cervical vertebrae indicated       affinities of moa by testing the prediction that the
moa were broadly distributed across the “rhizophagous        upper elevation limits of these species increased as
habitats … dislodging the farinaceous roots of the           climatic and vegetative zones shifted following the
ferns that grow in abundance over the soil of New            last glacial maximum.
Zealand” (Owen 1879). Later investigations would
include, along with morphological characteristics            Materials and Methods
of the species, analyses of gizzard contents and
reconstructions of environmental characteristics             Development of the moa distributional and
generating alternating opinions that moa were                environmental databases
browsers, grazers or frugivores – inferring from this
general habitat preferences of the guild for shrublands,         Fossil and subfossil records for the analysis of moa
grasslands or forests, respectively (see Worthy 1990).       interspecific segregation were accessed from published
Anderson (1983) concluded that, based on his analyses        radiocarbon (14C) dating studies (663 specimens from
of environmental distributions of moa in relation to         Perry et al. 2014a). As per prior reports (Perry et al.
past climatic, edaphic and vegetative conditions, that       2014a), these radiocarbon dates were calibrated
the species overlapped to the degree that there was          using the ‘BChron’ R package (Haslett and Parnell
little reason to distinguish among the distributions         2008) and the SHCal13 calibration curve (Hogg 2013).
of the taxa or genera. Worthy (1990), however, took          All calibrated dates are reported as years prior to
                                                             1950 AD. We discarded 83 specimens for which there
issue with this – citing Atkinson and Greenwood’s
                                                             was no reliable taxonomic information, then quality-
(1989) assertion that the high degree of geographic          assessed each fossil (Barnosky and Lindsey 2010),
overlap among species was facilitated by differences         retaining 528 specimens for our analysis (Table S1).
in beak morphology and diet (i.e., segregation of their      These data were then used to describe the incidence
functional vs. spatial niches; see Young et al. 2012).       of records for each species across all 116 fossil sites
Assessing all data available at the beginning of the new     with at least one species of moa (hereafter, ‘moa sites’)
millennium, Worthy and Holdaway (2002) analyzed              (Table S2). We have used published data reporting the
the distributions and environmental associations of          fossil records of moa in New Zealand, calibrated using
what were then believed to be 11 species, concluding         the SHCal13 curve. The average deviation between this
that three or four species often co-occurred in any          and the updated SHCal20 curve is 557 ± 50 years for
region, but that “the dominant species varied from           the moa fossils used in this study (Fig. S5). Deviations
place to place” (Worthy and Holdaway 2002:192).              in more recent periods (over the last 4-thousand
That is, despite much geographic overlap among the           yr) were more limited and, more generally, these
species, each was thought to have a preferred habitat        deviations are unbiased and therefore unlikely to have
– the three principal habitats being broadly defined         contributed to the shifts in upper elevational limits we
as either the upland zone, lowland wet forest zone or        observed. Given the multitude of earlier studies that
lowland dry climate zone. Most recently, Wood et al.         used the SHCal13 curve, however, we recommend a
(2020:13) inferred habitat associations from diets of        formal sensitivity analysis to reconcile any potential
moa by compiling and analyzing plant remains from            differences and biases introduced when comparing
moa gizzard contents and coprolites, concluding that         results in future analysis using the SHCal20 curve to
“the nine different moa species had distinct habitat         those using the older curve.
and food requirements” (see also Wood et al. 2013).              Paleoclimate data were simulated as a 30-year
     Here we further investigate this assertion of           average at an annual (1 year) step from 21 kBP to the
habitat segregation by utilizing the most extensive          present using PaleoView v1.5.1 (Fordham et al. 2017),
compilation of data on moa distributions yet analyzed        resulting in biologically meaningful estimates of past
to directly assess the ecological relations of this unique   climatic shifts (Fordham et al. 2018). Modern climate
guild of species. Recent advances in ancient DNA             data were extracted from the University of East Anglia
and other genetic analyses enable us to identify all         Climatic Research Unit (CRU) data set (Harris et al.
species of moa from subfossil remains (e.g., bones,          2020) as a 30-year average centered on 1985 (1970-
egg-shells, and coprolites), while other technological       1999) at 0.50° resolution. To capture important
advances allow reconstructions of past climates              orthographic elements in New Zealand’s climate, we
and other environmental conditions throughout                downscaled this baseline (modern) data using a high
the late-Pleistocene and into the Holocene and               spatial (0.005°; approx. 500 m2) resolution 30-year
recent times. Together, these emerging frontiers of          average climatology produced by the New Zealand
paleobiogeography and paleoecology now provide               National Institute of Water and Atmospheric Research
valuable opportunities to assess whether evolutionary        (NIWA; 1970-1999) resampled to approximately 0.25°
diversification of moa was indeed adaptive – producing       (20 km2) resolution.
an assemblage of species whose distributions became              Because data in PaleoView are not available after
segregated at geographic, and more local climatic            1989 (see below), we adjusted the baseline so that
and habitat scales. Here we test the hypothesis that         it was centered on 1970 using CRU data and then
the nine recent species of moa comprised a guild of          corrected for paleoclimatic changes throughout the
ecologically distinct herbivores. We then provide a          last 21000 years. In both cases this was done using
preview and prospective of our ongoing research on           the change factor method for downscaling climate

Frontiers of Biogeography 2021, 13.4, e53416                                     © the authors, CC-BY 4.0 license     3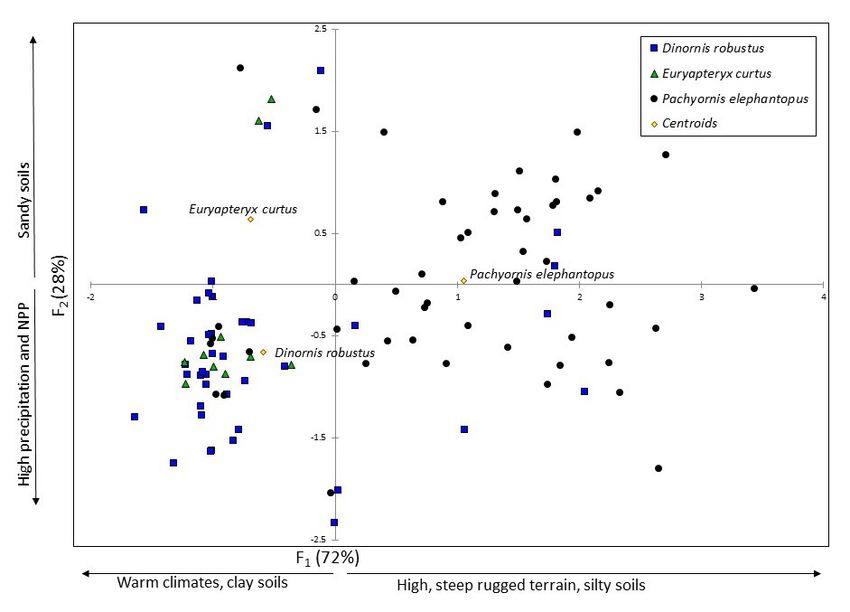
Lomolino et al. Geographic and ecological segregation of moa
data (Wilby and Wigley 1997). We generated six among sites was significantly different than would be
continuous estimates of climate variables between observed if the species were randomly distributed
21 kBP to 1989 AD: the total annual average rainfall with respect to each other. We first constructed a
(mL), the annual average temperature, and the average matrix describing the frequency of records for each
monthly maximum and minimum temperatures (°C) species across all 116 sites with at least one species
for the coolest (July) and warmest (January) months. (columns and rows, respectively; Table S2). Next, we
The monthly minimum and maximum temperatures counted the number of sites where species occurred
were used to calculate net primary productivity (NPP) separately, and the number of sites where at least
using the empirical Miami model (Lieth 1973), as two species co-occurred. We then randomly shuffled
described in Equation 1. occurrence frequencies for each species among sites
(shuffling data within species columns), while retaining
3000
1.315 − 0.991×Ta the total incidence of records for each species as in
NPP = min 1 + e the observed data. We calculated for this randomized
(1)
(
3000 × 1 − e
−0.000644× P
)
matrix the count of sites with just one species, and the
count of sites with at least two species co-occurring.
Where Ta is temperature and P is precipitation. We repeated these randomization procedures
We calculated two measures reflecting topography 1000 times and analyzed the probabilities that the
at each moa site – ruggedness and steepness. Average observed results could have resulted from random
ruggedness of each grid cell was calculated from a distributions of the nine species of moa among the
digital elevation model available on the New Zealand 116 sites. The proportion of simulations with results as
Land Resource Information Systems Portal (https:// or more extreme as the observed data was calculated.
lris.scinfo.org.nz/layer/48131-nzdem-north-island- We conducted Quadratic Discriminant Analysis
25-metre/ and https://lris.scinfo.org.nz/layer/48127- (QDA; see Tharwat 2016) in Excel using XLSTAT
nzdem-south-island-25-metre/) as the largest inter-cell (2021, Addinsoft LLC, www.xlstat.com) to investigate
difference between each pixel and its surrounding cells. and visualize the potential segregation among moa
We calculated steepness as the proportion of each species (dependent variable) across geographic,
0.25° cell with a gradient greater than 20°. We also climatic, topographic and edaphic dimensions (Table
included three measures of edaphic character at moa S3). In comparison to Linear Discriminant Analysis,
sites, including the content (g.kg-1) of clay, sand and silt QDA in XLSTAT is less influenced by non-normality,
in the topsoil layer (5-15cm deep), downscaled from heteroscedasticity of covariance matrices, and
their native 10 arcsec resolution (Hengl et al. 2017). collinearity among independent variables (see
Table S3 shows geographic, climatic, topographic and Clark et al. 2007). We performed QDA for three
edaphic variables at each of 116 sites where moa alternative sets of the data including the three most
were recorded. common species, the five most common species, and
The potential vegetation types (PVTs) during the then for data including all nine species. While the latter
late-Holocene prior to human settlement of New subset of the data included species occurring on a
Zealand at each moa site were determined based on limited number of sites, it did allow some speculation
data from Leathwick (2001), and that available on the on the environmental affinities of all moa, including
New Zealand Land Resource Information Systems Portal these less frequently recorded species.
(https://lris.scinfo.org.nz/layer/48279-new-zealand- We used Quantile Regression Analyses (QRA) in Excel
potential-vegetation-grid-version/). These vegetative using XLSTAT (2021, Addinsoft LLC, www.xlstat.com)
reconstructions are based on extensive surveys of to investigate the temporal dynamics in elevational
forest and open-habitat ecosystems, complemented by limits of moa following the last glacial maximum (i.e.,
information on meteorological data across New Zealand. including just those records after 15,000 radiocarbon
Additional environmental variables, including solar yr BP). We conducted a QRA for all nine species of
radiation, soil and atmospheric water deficit, soil leaching, moa combined, and separate QRAs for each of the
slope, and soil parent material and drainage, were included three most common species (N = 184 for all species
in regression analyses to determine the combination of combined, and 42, 36 and 32, respectively for the three
environmental variables that best predicted vegetative most common species –Pachyornis elephantopus,
patterns (Leathwick 2001, Leathwick et al. 2003). The final Dinornis robustus, and Euryapteryx curtus). Inspection
product was a series of GIS layers describing the PVTs of residuals and bivariate plots of elevation-on-age
across New Zealand (i.e., during the late-Holocene but revealed two outliers for records of Eurapteryx
prior to arrival of humans and their commensals in the curtus, so these were removed from the analyses (N
13th Century; Wilmshurst et al. 2008). We then assigned = 30). We restricted analyses of elevation-on-age to
each of the moa sites to a PVT based on its geographic records dated using post-1980 methods, and regressed
coordinates in order to assess the vegetative associations elevation of each moa record against its radiocarbon
of moa species. date to calculate the 95% upper quantile (upper
elevational limits of moa distributions) in each QRA.
Statistical Analyses PVTs were utilized to calculate niche breadths (NB)
We used Resampling STATS for EXCEL (2019 Statistics. and niche overlap among moa species by comparing
com LLC, www.resample.com; after Simon 1997) to test the proportion of land area for each PVT to the
whether the observed patterns of moa co-occurrence proportion of occurrences for each species within
Frontiers of Biogeography 2021, 13.4, e53416 © the authors, CC-BY 4.0 license 4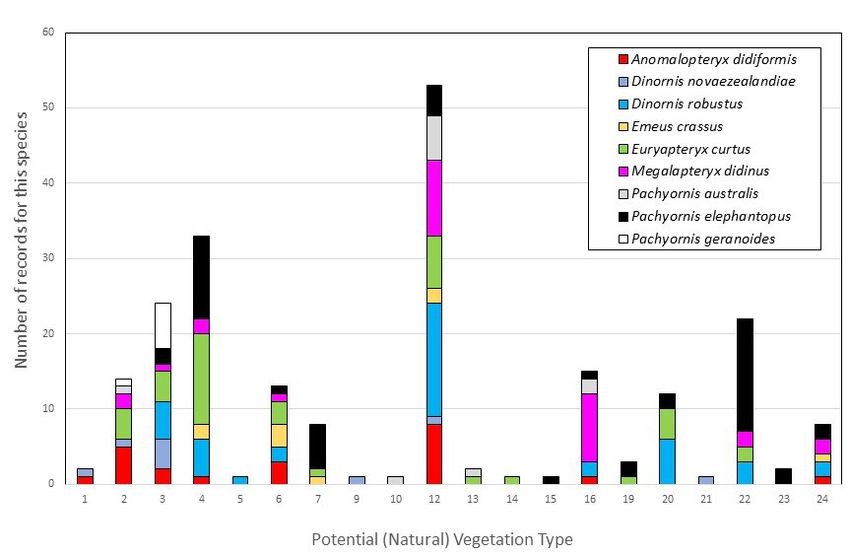
Lomolino et al.                                                          Geographic and ecological segregation of moa

each of the 24 PVTs. These indices are electivity         sandy soils, and moderate to cool climates with limited
measures equivalent to the percent similarity index       precipitation and NPP.
of Feinsinger et al. (1981; Equation 2).                      Despite their limited records, it may still be
                                                          informative to inspect results for the infrequently
             qi − pi                                      recorded species of moa (Fig. S2). The distributional
NB = 1 − ∑                                          (2)
                2                                         requirements of Pachyornis australis on the South
Where qi and pi equal the proportions of available        Island seems most similar to that of Megalapteryx
resources (land area) and occurrence records of this      didinus, while Emeus crassus appears to exhibit
species in PVTi (for I = 2 to 24).                        an environmental association similar to that of
    Niche overlap, mean niche overlap over all species    Pachyornis elephantopus. Pachyornis geranoides was
comparisons, and the statistical difference between       intermediate in its environmental affinities, with its
observed and simulated mean niche overlap when            six records tending to be located in low elevation sites
species occurrences were randomly distributed             with moderately warm climates on the North Island.
among PVTs were calculated using ECOSIM (Gotelli,         Dinornis novaezealandiae may have had the most
                                                          distinct habitat affinities among these rare species,
N.J. and A.M. Ellison. 2013. EcoSimR. Version 1.00,       which is not surprising given it was exclusively limited
http://www.uvm.edu/~ngotelli/EcoSim/EcoSim.html;          to the North Island.
Iterations = 1000, Resource State = User-defined, based       Consistent with the above patterns derived from
on relative land area in each PVT; Niche Breadth =        QDA of moa on environmental variables, reconstructions
Relaxed, Zero States = Reshuffled, Czekanowski Index).    of potential (natural) vegetation (PVT) across New
                                                          Zealand during the late-Holocene (but prior to human
Results                                                   colonization; Fig. 4; Fig. S3) revealed multi-species
                                                          patterns of distribution qualitatively consistent with
    Resampling randomization analyses revealed highly     those above. Collectively, the entire guild of moa
significant, negative associations among moa species      inhabited a broad range of habitats, while select
(Fig. S1). None of the 1000 randomized simulations of     species or pairs of species tended to discriminate
species distributions among the 116 moa sites yielded     among vegetation zones they inhabited. Similar to
results as extreme as the observed data. That is, none    the patterns illustrated in Fig. S2, the PVT affinities
of the simulations yielded results where the count of     of Megalapteryx didinus and Pachyornis australis
sites with just one species of moa approached the         were similar, both peaking in Rimu-miro/kamahi-
observed 95 single-species sites, and none yielded a      red beech-hard beech forest (PVT 12). In contrast,
count of sites where at least two species co-occurred     Euryapteryx curtus exhibited its highest incidence
as rarely as the observed 21 multi-species sites.         in Matai-kahikatea-totara forest (PVT 4), Pachyornis
    The highly significant negative association among     geranoides and Dinornis novaezelandiae were most
moa distributions resulted from segregation among         common in Kahikatea-pukatea-tawa forest (PVT 3), while
geographic and environmental (climatic, topographic       Pachyornis elephantopus exhibited its highest incidence
and edaphic) dimensions. Moa were spatially               in low forest woodland and scrubland below treeline
segregated among islands, regions within islands,         (PVT 22) and in Matai-kahikatea-totara forest (PVT 4).
and across elevations (Fig. 2). Quadratic Discriminant        Niche breadths (NB) of moa across PVT-defined
Analyses also revealed finer scale, environmental         habitats were relatively narrow, ranging from
segregation among moa ranges (Fig. 3). The results        0.22 to 0.54 among the nine species (theoretical
of the latter analyses, thus, provide a relatively        maximum = 1.0; Table 2). Contrary to our expectations
high‑resolution assessment of moa distributions           (see for example Wood et al. 2013), however, NB
(Table 1) and one that complements inferences drawn       of moa was not directly related to body mass, with
from previous studies (Bunce et al. 2009, after Worthy    Anomalopteryx didiformis (44 kg) exhibiting the
and Holdaway 2002), particularly that based on dietary    highest NB and Dinornis novaezealandiae (138 kg)
analyses of coprolites (Wood et al. 2020).                exhibiting one of the lowest observed NBs in this study
    Focusing first on the five most common species,       (0.54 versus 0.34, respectively).
the QDA ordination charts of Fig. 3 reveal Dinornis           Consistent with the results based on quadratic
robustus to have been distributed across a broad          discriminant analyses of species and environmental
range of habitats, elevations and climates across the     variables, niche overlap (NO) of moa species across the
South Island. In contrast, Anomalopteryx didiformis       24 PVT-defined habitats was significantly lower (species
was most common in sites at low to mid-elevations         more segregated by habitat) than that expected if these
with moderate temperatures, precipitation and NPP         species were randomly distributed with respect to each
on both islands, while Megalapteryx didinus was a         other (Table 2). Although highly variable depending on
mid- to high-elevation species inhabiting cool and wet    the species pair (ranging from 0.000 to 0.639), the mean
habitats in steep and rugged terrain, with silty soils    value of observed NO indices (0.265) was less than
of the South Island. Euryapterx curtus was distributed    half the mean value of 1000 randomized distribution
across a range of elevations in habitats with clay or     matrices (0.667; P < 0.001). Niche overlap tended to
sandy soils and moderate levels of precipitation and      be low (higher segregation) between congeneric pairs
NPP on both islands. Pachyornis elephantopus also         of species (NO = 0.152 for Dinornis robustus – Dinornis
occurred across a range of low to mid-elevations          novaezealandiae, and ranged from 0.017 to 0.060 for
across the South Island, more often in habitats with      pairings of the three Pachyornis species).

Frontiers of Biogeography 2021, 13.4, e53416                                  © the authors, CC-BY 4.0 license     5
Lomolino et al. Geographic and ecological segregation of moa Figure 2. Geographic and elevational segregation among the five most common (based on number of site records) species of moas. Figure 3a. Habitat and niche segregation among the three most common species of moas. F1 and F2 refer to Factor scores from discriminant analyses, explaining 72 and 28% of total variation in environmental variables, respectively. Frontiers of Biogeography 2021, 13.4, e53416 © the authors, CC-BY 4.0 license 6
Lomolino et al.                                                               Geographic and ecological segregation of moa

Figure 3b. Habitat and niche segregation among the five most common species of moas. F1 and F2 refer to Factor scores
from discriminant analyses, explaining 46 and 33% of total variation in environmental variables, respectively.

Figure 4. Relative incidence of nine moa species across Potential Vegetative Types (PVTs) of New Zealand. PVTs represent
the natural vegetation during the late-Holocene Epoch, but prior to human colonization (see Figure S3 for distributions
and descriptions of PVTs).

Frontiers of Biogeography 2021, 13.4, e53416                                      © the authors, CC-BY 4.0 license      7
Lomolino et al. Geographic and ecological segregation of moa
Table 1. A synopsis of complementary information on the distributional, climatic and ecological associations or moa.
Taxon a Environmental associations and diet
This study - climatic,
General habitat
edaphic and Diet/food plants
associations
Common Mass ecological affinities (after Wood et al.,
Family Genus species (Bunce et al., 2009,
name (kg) b
(n = number of 2020 - based on
after Worthy and
occurrences of this coprolites)
Holdaway 2002)
species)
Megalapteryidae Megalapteryx didinus Upland 42 mid- to high “… a widely varied “subalpine scrub,
moa elevation sites with diet, which included grassland and high
steep and rugged browsing of trees, country forests
terrain, cool and wet shrubs and herbs” (usually > 900 m)”
climates, and silty
soils (n = 29)
Dinornithidae Dinornis robustus South 138 broadly distributed “two distinct diets … “browsing generalist
Island across a range of (1) a diet consisting … upland, lowland
giant habitats, elevations mainly of browsed and open forests”
moa and climates (n = 41) forest trees and
shrubs … (2) a diet
dominated by grazed
herbs in non-forested
habitats”
novaezealandiae North 138 based on few (too few samples to habitat described
Island available records estimate diet) as that of above,
giant (n = 8), suggested congeneric species
moa affinity for sites with
moderate levels
of precipitation
and NPP, warm
temperatures and
moderately rugged
terrain
Emeidae Euryapteryx curtus Coastal 50 habitats with clay “ … leaves and fruits “drier climates -
moa or sandy soils of trees and shrubs” typically lowland
and moderate open forest and
precipitation and coastal sites”
NPP (n = 40)
Emeus crassus Eastern 56 based on few “… soft plant tissues, “lowland forest
moa available records (n = mainly leaves and (usually < 200 m) and
7), suggested affinity fruit of trees and swamps”
for sites with sandy shrubs”
soils and moderate
climates at mid-
elevations
Anomalopteryx didiformis Little 44 sites at low to “… most likely a “non-coastal lowland
bush mid-elevations browser of plants forests with a
moa with moderate within the forest continuous canopy”
temperatures, understory”
precipitation and
NPP (n = 22)
Pachyornis geranoides Mantell’s 26 based on few (too few samples to “lowland forest
moa available records (n = estimate diet) edges and wetland
6), suggested affinity vegetation”
for low elevation
sites with moderately
warm climates
elephantopus Heavy- 75 sandy habitats in “… mainly a grazer … habitat described
footed moderate to cooler short-statured plants as that of above,
moa climates with limited of non-forested congeneric species
precipitation and habitats and lianas”
NPP (n = 49)
australis Crested 65 based on few (too few samples to “subalpine
moa available records estimate diet) grassland”
(n = 11), suggested
affinity is similar to
that of Megalapteryx
(see above)
a
Taxonomy follows Bunce et al. 2009. b Mass estimates after Latham et al. 2020.
Frontiers of Biogeography 2021, 13.4, e53416 © the authors, CC-BY 4.0 license 8Lomolino et al. Geographic and ecological segregation of moa
Table 2. Niche breadths (NB) and niche overlap matrix of moas based on comparisons of species occurrences across
24 habitats (PVTs). These indices are electivity measures and range from 0 to 1 for perfectly specialized versus perfectly
generalized niche breadths, and for complete segregation versus complete niche overlap (N = total number of occurrences
of this species across all sites and PVTs; P-values represent proportion of 1000 randomized species distribution matrices
yielding lower NB values). None of the 1000 randomized species matrices yielded mean niche overlaps that were less
than the observed mean value (0.265; mean niche overlap of the randomized matrices = 0.667; ECOSIM - Gotelli, N.J.
and A.M. Ellison 2012. http://www.uvm.edu/~ngotelli/EcoSim/EcoSim.html).
Anomalopteryx Dinornis Dinornis Emeus Euryapteryx Megalapteryx Pachyornis Pachyornis Pachyornis
didiformis novaezealandiae robustus crassus curtus didinus australis elephantopus geranoides
(56 (65 kg;
(44 kg; both (138 kg; N. (138 kg; (50 kg; both (42 kg; South (75 kg; S. (26 kg; N.
kg; S. South
islands) Island) S. Island) islands) Island) Island) Island)
Island) Island)
N- 22 9 41 9 40 29 11 49 7
NB - 0.54 0.34 0.42 0.29 0.49 0.45 0.26 0.42 0.22
P- 0.014 0.000 0.000 0.000 0.001 0.000 0.000 0.000 0.000
Niche Overlap among species (Czekanowski Index)
Anomalopteryx 0.240 0.508 0.523 0.376 0.626 0.365 0.176 0.146
didiformis
Dinornis 0.152 0.079 0.168 0.136 0.097 0.071 0.289
novaezealandiae
Dinornis 0.359 0.639 0.559 0.294 0.361 0.073
robustus
Emeus crassus 0.454 0.375 0.174 0.345 0.000
Euryapteryx 0.385 0.202 0.422 0.089
curtus
Megalapteryx 0.409 0.296 0.056
didinus
Pachyornis 0.060 0.017
australis
Pachyornis 0.021
elephantopus
Pachyornis
geranoides
Discussion and Conclusion existed; Braithwaite 1992), and by release into the niche
space of large herbivorous vertebrates following the
Evolution of moa represents one of the most extinction of dinosaurs and in the absence of non-volant
compelling examples of ‘reversals in natural selection’ mammals (see Mitchell et al. 2014).
(sensu Lomolino 2009) yet described for insular birds Whether considering the results for just the
– they became flightless in the absence of non-volant more common species, or those for all nine species
mammals (see Trewick 1997, Clark 1964, Dekker 1989), combined, adaptive radiation of moa produced a
and occupied the niches filled by large, herbivorous guild of species that segregated their distributions
mammals (i.e., ungulates) on continents. Although across geographic and more fine-scale, environmental
more limited in terminal diversity than other, classic dimensions of the geographic template and available
cases of evolutionary divergence of insular linages habitats (PVTs) of New Zealand. The ecological
(e.g., those referenced in the Introduction), the segregation among species may have been even more
diversification of moa may have been the largest avian demonstrable than our results have indicated because
radiation in New Zealand and clearly was adaptive. our inferences were based on records of occurrences
That is, as a group, moa filled the “large herbivore pooled across a very broad and climatically variable
niche”, but the species also clearly segregated their temporal scale (the past 20,000 years). It is likely that
ecological niches within this broader niche. the geographic ranges and habitat and niche breadths
As with adaptive radiations of other insular lineages, of these species were narrower during particular
evolutionary diversification of moa was shaped by both periods of distinctive climatic and ecological conditions.
ecological displacement and by character release as While moa represented the largest terrestrial birds
well. It was driven by competitive displacement, not in the Pacific, ratites are a globally distributed group
just from other moa, but from over 200 other, relatively of birds that have a tendency towards gigantism and
small avian species native to New Zealand (see Worthy flightlessness (Phillips et al. 2010). Typically, they are
and Holdaway 2002, Davies 2003). This transformation not strongly diversified. In the Indian Ocean, however,
toward gigantism may have been amplified in its later Madagascar also supported a guild of flightless,
stages by predatory pressures from Haast’s eagle terrestrial giants – the elephant birds (Aepyornithidae),
(Harpagornis moorei – the largest eagle known to have whose isolation, origins and evolutionary trajectory
Frontiers of Biogeography 2021, 13.4, e53416 © the authors, CC-BY 4.0 license 9Lomolino et al. Geographic and ecological segregation of moa
closely parallel those of the moa in New Zealand during the Holocene Epoch. We can only speculate
(Hansford and Turvey 2018). Although apparently that the most recent shifts in elevational limits of
fewer in number (four vs. nine currently recognized these species (beginning around 4,700 BP) may have
species of elephant birds vs. moa, respectively), been a response to a shift toward hotter and drier
evolutionary diversification of elephant birds similarly summers that occurred in New Zealand around this
evidenced allopatric divergence across elevations time with concurrent shifts in vegetative cover (van
and ecoregions, with niche segregation appearing den Bos et al. 2018), this perhaps later amplified by
to be most pronounced between congeneric species
(Aepyornis hildebrandti and A. maximus; Hansford anthropogenic factors (the introduction of Polynesian
and Turvey 2018). We suggest that the techniques rats [Rattus exulans] and dogs [Canis familiaris],
applied here, coupled with appropriate dating of the and establishment and subsequent expansion of
numerous egg shells of the elephant birds across the ecologically significant populations of Māori who
full extent of Madagascar’s ecoregions, may reveal hunted moa and substantially modified native habitats
a similarly intriguing story of insular diversification, with fire; Perry et al. 2014b).
ecological segregation and adaptive radiation. A more rigorous assessment of the causes of these
While our ongoing research includes niche elevational dynamics and, more generally, the patterns
modelling of the temporal as well as spatial dynamics of range collapse and ultimate extinction of this guild
of moa ranges, a preliminary analysis here of of giant, wingless birds awaits further analyses on the
elevational dynamics of moa distributions during interdependence among temporal-spatial dynamics of
the late-Pleistocene and the Holocene is instructive. climate, vegetation, Polynesian rats, Māori and moa.
The macroecological pattern of Fig. 5 reveals a We are currently incorporating data from these paleo-
constrained relationship in the elevational limits of archives into process-based (theory and data-driven)
moa since the last glacial maximum. We thus extend
Rawlence et al.’s (2012) description of pronounced, simulation models, which run at fine temporal and
post-glacial elevational shifts of Pachyornis australis spatial scales and across large geographical extents,
to three other species (Dinornis robustus, Pachyornis opening windows into moa dynamics during the late-
elephantopus and Euryapteryx curtus) and to the moa Quaternary. A central goal of this modelling is to apply
guild, in general. The increase in the upper elevational the lessons of past extinctions for conserving rare and
limits of moa is consistent with concurrent dynamics endangered assemblages of today (see Fordham et al.
in climatic conditions and upward shifts in habitats 2011, 2016, 2020).
Figure 5. Temporal dynamics in the elevational distributions of moa during the past 20,000 years. The increase in upper
elevational limits of this guild following the last glacial maximum (diagonal constraint lines; 95th percentile, quantile
regression) is consistent with the concurrent elevational shifts in climate and habitats of these species, and may also have
been influenced by the first arrival of kiore (Rattus exulans) and later establishment and rapid expansion of ecologically
significant populations of Māori (~1280 A.D.; Wilmhurst et al. 2008). Quantile lines present results for the three most
common species (Dinornis robustus, Euryapteryx curtus and Pachyornis elephantopus – blue squares, green triangles and
black circles, respectively; values for the other six species are represented here as small open circles).
Frontiers of Biogeography 2021, 13.4, e53416 © the authors, CC-BY 4.0 license 10Lomolino et al. Geographic and ecological segregation of moa
Acknowledgments Brathwaite, D.H. (1992) Notes on the weight, flying
ability, habitat, and prey of Haast’s Eagle
We are indebted to the countless scientists and other (Harpagornis moorei). Notornis, 39, 239–247.
individuals who have contributed to information on the
distributions of this intriguing guild of species, along Bunce, M., Worthy, T.H., Phillips, M.J., et al. (2009) The
with those estimating and compiling information on evolutionary history of the extinct ratite moa
the environmental characteristics of moa distributions and New Zealand Neogene paleogeography.
and their environments over the past 20,000 years. Proceedings of the National Academy of
This research was supported by an Australian Research Sciences USA, 106, 20646–20651. https://
Council Discovery Project (DP180102392) awarded to doi.org/10.1073/pnas.0906660106
DAF and MVL.
Callicrate, T., Dikow, R, Thomas, J.W., Boykin, K.G.,
Author Contributions Frey, J.K. & Anderson, M.C. (2014) Genomic
resources for the endangered Hawaiian
MVL conceived this study and, together with ST, honeycreepers. BMC Genomics, 15, 1098.
conducted the statistical analyses. DAF provided
guidance and financial support for the studies, overall, https://doi.org/10.1186/1471-2164-15-1098
and with ST compiled the datasets utilized in these Clark, G.A. (1964) Life histories and the evolution
analyses. J. Wood and J. Wilmshurst provided key of megapodes. The Living Bird, 3, 149-167.
insights into the ecological dynamics of moa and the Clark, W.R., Lachenbrunch, P.A. & Broffitt,
environments across New Zealand, and all four authors
contributed to the writing and editing of this paper. B. (2007) How non-normality affects
the quadratic discriminant function.
Supplementary Material Communications in Statistics – Theory
and Methods, 8, 1285-1301. https://doi.
The following materials are available as part of the org/10.1080/03610927908827830
online article at https://escholarship.org/uc/fb
Figure S1. Results of resampling analyses assessing the Davies, S.J.J.F. (2003) Moa. In: Grzimek’s Animal Life
probabilities of results of moa species co-occurrence Encyclopedia, volume 8. (Birds I. Tinamous
as extreme as the observed patterns. and Ratites to Hoatzins). 2nd edition (ed. by M.
Figure S2. Habitat and niche segregation among all Hutchins), pp. 95-98. Gale Group, Farmington
nine species of moa. Hills, MI:
Figure S3. Description of potential vegetation types.
Figure S4. Loadings of environmental variables on the Dekker, R.W.R.J. (1989) Predation and the
first two dimensions of factor scores. western limits of megapode distribution
Figure S5. Deviations between the SHCal13 curve and (Megapodiidae; Aves). Journal of Biogeography,
the updated SHCal20 curve. 16, 317-321.
Table S1. Fossil database for all species of moa. Feinsinger, P., Spears, E.E. & Poole, R.W. (1981) A
Table S2. Incidence of species records across 116 sites
where at least one species of moa was recorded. Simple Measure of Niche Breadth. Ecology,
Table S3. Geographic, climatic, Net Primary Productivity 62, 27-32.
(NPP), topographic and edaphic characteristics at 116 Fordham, D.A., Wigley, T.M. & Brook, B.W. (2011)
moa sites used in this study. Multi‐model climate projections for
Table S4. Description of Potential Vegetation Types biodiversity risk assessments. Ecological
reproduced from Leathwick et al.(2012).
Applications, 21, 3317-3331. https://doi.
org/10.1890/11-0314.1
References
Fordham, D.A., Saltré, F., Haythorne, S., Wigley,
Anderson, A.J. (1983) Faunal depletion and subsistence T.M., Otto‐Bliesner, B.L., Chan, K.C. & Brook,
change in the early prehistory of southern New B.W. (2017) PaleoView: a tool for generating
Zealand. Archaeology in Oceania, 19, 1-10. continuous climate projections spanning
Atkinson, I.A.E. & Greenwood, R.M. (1989) the last 21,000 years at regional and global
Relationships between moa and plants. New scales. Ecography, 40, 1348-1358. https://
Zealand Journal of Ecology, 12, 67-96. doi.org/10.1111/ecog.03031
Barnosky, A.D. & Lindsey, E.L. (2010) Timing of Fordham, D.A., Akçakaya, H.R., Alroy, J., Saltré, F.,
Quaternary megafaunal extinction in South Wigley, T.M.L. & Brook, B.W. (2016) Predicting
America in relation to human arrival and and mitigating future biodiversity loss using
climate change. Quaternary International, long-term ecological proxies. Nature Climate
217, 10-29. https://doi.org/10.1016/j. Change, 6, 909-916. https://doi.org/10.1038/
quaint.2009.11.017 nclimate3086
Frontiers of Biogeography 2021, 13.4, e53416 © the authors, CC-BY 4.0 license 11Lomolino et al. Geographic and ecological segregation of moa
Fordham, D.A., Saltré, F., Brown, S.C., Mellin, C. & Wigley, estimates for extinct moa. Ecography, 43, 353–
T.M. (2018) Why decadal to century timescale 364. https://doi.org/10.1111/ecog.04917
palaeoclimate data are needed to explain Leathwick, J.R. (2001) New Zealand’s potential forest
present‐day patterns of biological diversity and pattern as predicted from current species‐
change. Global Change Biology, 24, 1371-1381. environment relationships. New Zealand
https://doi.org/10.1111/gcb.13932 Journal of Botany, 39, 447-464. https://doi.
Fordham, D.A., Jackson, S.T., Brown, S.C., et al. (2020) org/10.1080/0028825X.2001.9512748
Using paleo-archives to safeguard biodiversity Leathwick, J., Morgan, F., Wilson, G., Rutledge,
under climate change. Science, 369, https:// D., McLeod, M. & Johnston, K. (2003) Land
doi.org/10.1126/science.abc5654 environments of New Zealand: a technical
Givnish, T.J., Millam, K., Mast, A., Paterson, T., Themi, guide. Ministry of the Environment 2002.
T., Hipp, A., Henss, J., Smith, J., Wood, K., & https://www.landcareresearch.co.nz/
Sytsma, K.J. (2009) Origin, adaptive radiation Leathwick, J., McGlone, M. & Walker, S. (2012) New
and diversification of the Hawaiian lobeliads Zealand’s potential vegetation pattern. Metadata
(Asterales: Campanulaceae). Proceedings of to spatial data layers. Landcare Research.
the Royal Society B, 276, 407–416. https:// https://doi.org/10.26060/8NK5-VJ54
doi.org/10.1098/rspb.2008.1204 Lieth, H. (1973) Primary production: terrestrial
Hansford, J.P. & Turvey, S.T. (2018) Unexpected ecosystems. Human Ecology, 1, 303-332.
diversity within the extinct elephant birds https://doi.org/10.1007/BF01536729
(Aves: Aepyornithidae) and a new identity for Lomolino, M.V. (2009) Four Darwinian themes
the world’s largest bird. Royal Society Open on the origin, evolution and preservation
Science, 5, 181295. https://doi.org/10.1098/ of island life. Journal of Biogeography, 37,
rsos.181295 985-994. https://doi.org/10.1111/j.1365-
Harris, I., Osborn, T.J., Jones, P. & Lister, D. (2020) 2699.2009.02247.x
Version 4 of the CRU TS monthly high- Lomolino, M.V., Riddle, B.R. & Whittaker, R.J. (2017)
resolution gridded multivariate climate Biogeography: biological diversity across space
dataset. Scientific Data 7, 1-18. https://doi. and time. Oxford University Press, Oxford.
org/10.1038/s41597-020-0453-3 McGee, M.D., Neches, R.Y. & Seehausen, O. (2016)
Haslett, J. & Parnell, A.C. (2008) A simple monotone Evaluating genomic divergence and
process with application to radiocarbon- parallelism in replicate ecomorphs from
dated depth chronologies. Journal of the young and old cichlid adaptive radiations.
Royal Statistical Society: Series C (Applied Molecular Ecology, 25, 260–268. https://doi.
Statistics), 57, 399–418. https://doi. org/10.1111/mec.13463
org/10.1111/j.1467-9876.2008.00623.x Mitchell, K.J., Llamas, B., Soubrier, J., Rawlence, N.J.,
Hengl, T., Mendes de Jesus, J., Heuvelink, G.B., et al. Worthy, T.H., Wood, J., Lee, M.S.Y. & Cooper, A.
(2017) SoilGrids250m: Global gridded soil (2014) Ancient DNA reveals elephant birds
information based on machine learning. and kiwi are sister taxa and clarifies ratite bird
PLoS ONE 12, p.e0169748. https://doi. evolution. Science, 344, 898-900. https://doi.
org/10.1371/journal.pone.0169748 org/10.1126/science.1251981
Herrera, J.P. (2017) Testing the adaptive radiation Perry, G.L., Wheeler, A.B.; Wood, J.R. & Wilmshurst,
hypothesis for the lemurs of Madagascar. J.M. (2014a) A high-precision chronology
Royal Society Open Science, 4, 161014. http:// for the rapid extinction of New Zealand
dx.doi.org/10.1098/rsos.161014 moa (Aves, Dinornithiformes). Quaternary
Hogg, A. (2013) SHCal13 Southern Hemisphere Science Reviews, 105, 126-135. https://doi.
calibration, 0-50,000 Years cal BP. Radiocarbon, org/10.1016/j.quascirev.2014.09.025
55, 1889-1903. https://doi.org/10.2458/ Perry, G.L., Wilmshurst, J.M. & McGlone, M.S.
azu_js_rc.55.16783 (2014b) Ecology and long-term history of
Latham, A.D.M., Latham, M.C., Wilmshurst, J.M., fire in New Zealand. New Zealand Journal of
Forsyth, D.M., Gormley, A.M., Pech, R.P., Perry, Ecology, 38, 157-176. https://www.jstor.org/
G.L.W. & Wood, J.R. (2020) A refined model of stable/24060795
body mass and population density in flightless Phillips M.J., Gibb G.C., Crimp E.A. & Penny, D.
birds reconciles extreme bimodal population (2010) Tinamous and moa flock together:
Frontiers of Biogeography 2021, 13.4, e53416 © the authors, CC-BY 4.0 license 12Lomolino et al. Geographic and ecological segregation of moa
mitochondrial genome sequence analysis Wilby R.L. & Wigley, T.M.L. (1997) Downscaling
reveals independent losses of flight among general circulation model output: a review of
ratites. Systematic Biology, 59, 90–107. methods and limitations. Progress in Physical
https://doi.org/10.1093/sysbio/syp079 Geography, 21, 530– 548. https://doi.org/10
Rawlence, N.J., Metcalf, J.L., Wood, J.R., Worthy, .1177%2F030913339702100403
T.H., Austin, J.J. & Cooper, A. (2012) The Wilmshurst, J.M., Anderson, A.J., Higham, T.F. &
effect of climate and environmental change Worthy, T.H. (2008) Dating the late prehistoric
on the megafaunal moa of New Zealand dispersal of Polynesians to New Zealand
in the absence of humans. Quaternary using the commensal Pacific rat. Proceedings
Science Reviews, 50, 141-153. https://doi. of the National Academy of Sciences USA,
org/10.1016/j.quascirev.2012.07.004 105, 7676-7680. https://doi.org/10.1073/
Reddy, S., Driskell, A., Rabosky, D.L., Hackett, S.J. & pnas.0801507105
Schulenberg, T.S. (2012) Diversification and the Wirta, H., Orsini, L. & Hanski, I. (2008) An old
adaptive radiation of the vangas of Madagascar. adaptive radiation of forest dung beetles
Proceedings of the Royal Society B, 279, 2062– in Madagascar. Molecular Phylogenetics
2071. http://doi.org/10.1098/rspb.2011.2380 and Evolution, 47, 1076-1089. https://doi.
Rundell, R.J. & Price, E.D. (2009) Adaptive radiation, org/10.1016/j.ympev.2008.03.010
nonadaptive radiation, ecological speciation, Wood, J.R., Wilmshurst, J.M., Richardson, S.J., Rawlence,
and nonecological speciation. Trends in N.J., Wagstaff, S.J., Worthy, T.H. & Cooper, A.,
Ecology and Evolution, 24, 394–399. https:// (2013) Resolving lost herbivore community
doi.org/10.1016/j.tree.2009.02.007 structure using coprolites of four sympatric
Salzburger, W., Van Bocxlaer, B. & Cohen, A.S. (2014) moa species (Aves: Dinornithiformes).
Ecology and evolution of the African Great Proceedings of the National Academy of
Lakes and their faunas. Annual Review of Sciences USA, 110, 16910-16915. https://doi.
Ecology, Evolution and Systematics, 45, org/10.1073/pnas.1307700110
519–545. https://doi.org/10.1146/annurev- Wood, J.R., Richardson, S.J., McGlone, M.S., &
ecolsys-120213-091804 Wilmshurst, J.M. (2020) The diets of moa
Simon, J.L. (1997) Resampling: the new statistics. (Aves: Dinornithiformes). New Zealand
2nd Edition. Resampling Stats, Arlington, VA. Journal of Ecology, 44, 3397. https://dx.doi.
Tennyson, A.J.D, Worthy, T.H., Jones, C.M., Scofield, org/10.20417/nzjecol.44.3
R.P. & Hand, S.J. (2010) Moa’s Ark: Miocene Worthy, T.H. (1990) An analysis of the distribution
fossils reveal the great antiquity of moa (Aves: and relative abundance of moa species (Aves:
Dinornithiformes) in Zealandia. Records of Dinornithiformes), New Zealand Journal of
the Australian Museum, 62, 105-114. https:// Zoology, 17, 213-241. https://doi.org/10.1
doi.org/10.3853/j.0067-1975.62.2010.1546 080/03014223.1990.10422598
Tharwat, A. (2016) Linear vs. quadratic discriminant Worthy, T.H. & Holdaway, R.N. (2002) The lost world
analysis classifier: a tutorial. International of the moa: prehistoric life of New Zealand.
Journal of Applied Pattern Recognition, Indiana University Press, Bloomington, IN.
3, 145–180. https://doi.org/10.1504/ Young M.T., Rayfield, E.J., Holliday, C.M., Witmer,
IJAPR.2016.079050 L.M., Button, D.J., Upchurch, P. & Barrett, P.M.
Trewick, S.A. (1997) Flightlessness and phylogeny (2012) Cranial biomechanics of Diplodocus
amongst endemic rails (Aves: Rallidae) (Dinosauria, Sauropoda): testing hypotheses of
of the New Zealand Region. Philosophical feeding behaviour in an extinct megaherbivore.
Transactions of the Royal Society B, 352, 429- Naturwissenschaften, 99, 637–643. https://doi.
446. https://doi.org/10.1098/rstb.1997.0031 org/10.1007/s00114-012-0944-y
Van den Bos, V., Rees, A., Newnham, R., Vandergoes, M.,
Wilmshurst, J. & Augustinus, P. (2018) Holocene
temperature, humidity and seasonality in Submitted: 28 May 2021
northern New Zealand linked to Southern First decision: 7 July 2021
Hemisphere summer insolation. Quaternary Accepted: 6 August 2021
Science Reviews, 201, 77 – 88. https://doi.
org/10.1016/j.quascirev.2018.10.008 Edited by Kenneth F. Rijsdijk and Robert J. Whittaker
Frontiers of Biogeography 2021, 13.4, e53416 © the authors, CC-BY 4.0 license 13You can also read