Brief communication: The role of using precipitation or river discharge data when assessing global coastal compound flooding - Articles
←
→
Page content transcription
If your browser does not render page correctly, please read the page content below

Nat. Hazards Earth Syst. Sci., 20, 1765–1782, 2020
https://doi.org/10.5194/nhess-20-1765-2020
© Author(s) 2020. This work is distributed under
the Creative Commons Attribution 4.0 License.

Brief communication: The role of using precipitation or river
discharge data when assessing global coastal compound flooding
Emanuele Bevacqua1,z , Michalis I. Vousdoukas2 , Theodore G. Shepherd1 , and Mathieu Vrac3
1 Department  of Meteorology, University of Reading, Reading, UK
2 JointResearch Centre (JRC), European Commission, Ispra, Italy
3 Laboratoire des Sciences du Climat et de l’Environnement, CNRS/IPSL, Gif-sur-Yvette, France
z Invited contribution by Emanuele Bevacqua, recipient of the Outstanding Student Poster and PICO (OSPP) Award 2018.

Correspondence: Emanuele Bevacqua (e.bevacqua@reading.ac.uk)

Received: 16 December 2019 – Discussion started: 9 January 2020
Revised: 11 May 2020 – Accepted: 14 May 2020 – Published: 17 June 2020

Abstract. Interacting storm surges and high water runoff can     et al., 2017; Olbert et al., 2017; Hendry et al., 2019). Prac-
cause compound flooding (CF) in low-lying coasts and river       titioners and the scientific community are becoming more
estuaries. The large-scale CF hazard has been typically stud-    aware of CF risk, and there were several recent studies ad-
ied using proxies such as the concurrence of storm surge ex-     dressing the phenomenon at local (Bevacqua et al., 2017;
tremes either with precipitation or with river discharge ex-     Kumbier et al., 2018; van den Hurk et al., 2015; Ridder et al.,
tremes. Here the impact of the choice of such proxies is ad-     2018) or larger scales (Wahl et al., 2015; Bevacqua et al.,
dressed employing state-of-the-art global datasets. Although     2019; Couasnon et al., 2020; Ward et al., 2018; Ganguli and
they are proxies of diverse physical mechanisms, we find         Merz, 2019a, b; Wu and Leonard, 2019; Wu et al., 2018;
that the two approaches show similar CF spatial patterns. On     Moftakhari et al., 2017). Recent advances in large-scale sea
average, deviations are smaller in regions where assessing       level and river discharge modelling allowed for the genera-
the actual CF is more relevant, i.e. where the CF potential      tion of sub-daily time series of water levels along the global
is high. Differences between the two assessments increase        coastline (Vousdoukas et al., 2018; Muis et al., 2016), thus
with the catchment size, and our findings indicate that CF in    enabling continental CF assessments (Ward et al., 2018; Be-
long rivers (catchment &5–10×103 km2 ) should be analysed        vacqua et al., 2019; Couasnon et al., 2020).
using river discharge data. The precipitation-based assess-          CF can be the result of different mechanisms depending
ment allows for considering local-rainfall-driven CF and CF      on the local topography and meteorology. According to Wahl
in small rivers not resolved by large-scale datasets.            et al. (2015), CF is possible to occur when (1) the joint oc-
                                                                 currence of high river discharge and storm surge in estuarine
                                                                 regions may elevate water levels to a point where flooding
                                                                 is initiated or its impacts are exacerbated; (2) a destructive
1   Introduction                                                 storm surge, which already caused widespread flooding, is
                                                                 followed by rainfall, as the latter can drive additional flood-
Compound flooding (CF) happens in low-lying coastal ar-          ing, even if it is not an extreme event on its own; and (3) a
eas due to the interaction of high precipitation runoff and      moderate storm surge occurs which does not directly cause
high sea level. The combination of the two hazards can           flooding but is high enough to fully block or slow down
cause larger damages than those caused by either of the haz-     gravity-fed storm water drainage, and as a result precipita-
ards in isolation, and recent events have occurred in e.g.       tion causes flooding. In addition, CF may occur if (4) precip-
Mozambique (2019), Texas (USA, 2017), the Shoalhaven es-         itation falls on wet soil that is saturated by a preceding storm
tuary (Australia, 2016), Ravenna (Italy, 2015), Cork (Ireland,   surge (Bevacqua et al., 2019).
2009), and Lymington (UK, 1999) (Couasnon et al., 2020;
Zscheischler et al., 2018; Kumbier et al., 2018; Bevacqua

Published by Copernicus Publications on behalf of the European Geosciences Union.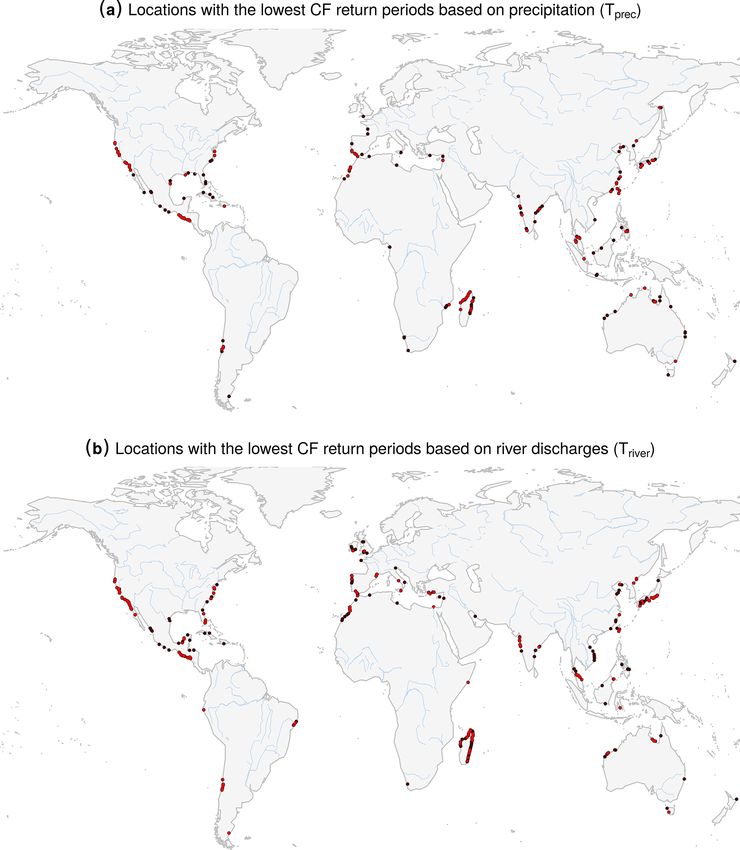
1766                               E. Bevacqua et al.: Difference in assessing global compound flooding based on sea level

   Quantifying the actual CF, i.e. the water level resulting       qua et al., 2019; Wu et al., 2018; Couasnon et al., 2020; Wu
from the combination of pluvial or fluvial flooding and high       et al., 2018; Paprotny et al., 2018; Bevacqua et al., 2020).
sea level, is challenging. For example, quantifying and inter-     Against the foregoing background, the present study aims to
preting CF in the vicinity of rivers (mechanism 1) requires        assess whether a precipitation-based large-scale CF assess-
water level measurements in the river mouth, which are rare,       ment can be used as a surrogate for potential CF in estu-
probably because most gauges are installed to monitor either       aries at the large-scale. To that end we use coherent global
riverine or marine processes (Bevacqua et al., 2017; Paprotny      model datasets of storms surges (including wave effects;
et al., 2018). Model-based data are also limited because only      Vousdoukas et al., 2018), precipitation (Beck et al., 2017b),
recently have modellers started considering CF. Statistical        and river discharge (Couasnon et al., 2020; Eilander, 2019)
and hydrodynamic modelling approaches integrating fluvial          and conduct a first global comparison of the results obtained
and sea level flooding have been developed and applied re-         through the two approaches, keeping all the other method-
cently at the local scale (Bevacqua et al., 2017; van den Hurk     ological aspects identical.
et al., 2015; Kumbier et al., 2018; Khanal et al., 2019); how-
ever, at a large scale, these approaches are only now being de-
veloped. Similarly, the explicit study of the actual CF water      2   Data
level due to pluvial flooding and storm surges (mechanisms
2-4) has not received much attention so far, to our knowl-         We analyse the period 1979–2015. We consider river dis-
edge, which may also be due to the scarcity of data. Thus,         charge daily maxima from a publicly available global
to gain information on the CF hazard at the regional, conti-       dataset (Eilander, 2019; Couasnon et al., 2020), which
nental, or global scales, scientists usually employ proxies of     includes coastal catchments larger than 1000 km2 . The
flood hazard, e.g. the probability of potential CF (Bevacqua       dataset was the result of hydrological model simulations
et al., 2019; Ward et al., 2018; Wahl et al., 2015; Couasnon       forced with temperature and potential evaporation derived
et al., 2020; Paprotny et al., 2018). Quantifying potential CF,    from ERA-Interim (European Centre for Medium-Range
under the present or future climate, is useful, as it allows for   Weather Forecasts Reanalysis) and with precipitation from
identifying potential hotspots of CF hazard. Then, more de-        the MSWEPv1.2 dataset (Multi-Source Weighted-Ensemble
tailed assessments of the local CF risk can be carried out at      Precipitation; Couasnon et al., 2020). The latter is obtained
such hotspots, using computationally intensive methodolo-          by merging gauge, satellite, and reanalysis data (including
gies that integrate all the hydrological and meteorological        ERA-Interim); more information can be found in Beck et al.
sources of flooding and their physical interaction (Wahl et al.,   (2017b).
2015).                                                                Precipitation is taken from the same MSWEPv1.2 dataset
   The large-scale assessment of potential CF includes the         used to simulated river discharges and consists of daily data
analysis of the probability (or return periods) of concurring      over a 0.25◦ grid. On each day we consider accumulated pre-
extreme values of CF drivers. Two main approaches exist,           cipitation amounts within a 3 d centred window. This enables
focussing, respectively, on the analysis of the probability of     us to account for precipitation occurring just before and af-
concurring high values of sea level and river discharge or         ter midnight of the storm surge day (Bevacqua et al., 2019;
of sea level and precipitation. Through considering river dis-     Martius et al., 2016) and to consider different mechanisms
charge, the first approach takes into account CF in estuaries      causing CF (Wahl et al., 2015; Bevacqua et al., 2019).
and deltas, i.e. serving as a proxy of CF mechanism 1. The            Storm surges and waves were simulated with the hydro-
second approach, based on the analysis of accumulated pre-         dynamic model D-Flow Flexible Mesh (D-Flow FM; Vous-
cipitation around the coast when the high sea levels occur,        doukas et al., 2017, 2018) and the wave model Wavewatch III
can represent CF due to local precipitation extremes, i.e. re-     (Mentaschi et al., 2017; Vousdoukas et al., 2017, 2018). The
lated to mechanisms 2, 3, and 4. Given that precipitation is       wave model was forced by 6-hourly wind, while D-Flow FM
among the main drivers of river discharge, the two proxies         was also forced by sea level pressure fields, both available
are correlated to a certain extent, and the use of precipita-      from the ERA-Interim reanalysis (Dee et al., 2011). The ef-
tion can thereby allow for quantifying CF potential also in        fects of tropical cyclones (TCs) were considered in the re-
certain river estuaries. However, the correlation between the      analysis through storm surge simulations forced by down-
two proxies can be sometimes poor, especially in locations         scaled atmospheric fields from all recorded TCs and by con-
where river discharge is strongly influenced by other factors      sidering satellite-observed TC wave extremes (Vousdoukas
such as snowmelt, evaporation, and accumulated precipita-          et al., 2018). Astronomical tides are not considered in this
tion over previous weeks or months (Blöschl et al., 2019).         analysis in order to focus on the meteorological component
   Given the scarcity and heterogeneous distribution of in situ    of the sea level, excluding the stochastic coupling with tide
data (Ward et al., 2018; Couasnon et al., 2020; Wu et al.,         induced water level variations. We consider daily water level
2018), scientists have started to employ model data – of           maxima from the combined result of storm surges and wave
river discharge, storm surge, and precipitation – to assess the    setup (hereinafter mentioned as storm surges) according to
large-scale potential CF hazard (Ward et al., 2018; Bevac-         Vousdoukas et al. (2018).

Nat. Hazards Earth Syst. Sci., 20, 1765–1782, 2020                                https://doi.org/10.5194/nhess-20-1765-2020
E. Bevacqua et al.: Difference in assessing global compound flooding based on sea level                                         1767

   We analyse CF only around river mouth locations whose            sented by the maximum X and Y values observed in the clus-
nearest precipitation and storm surge grid points lie within        ter. Note that while this choice has the drawback of not fully
a distance of 75 km (Couasnon et al., 2020). This results in        respecting the assumptions of independent realisations of the
considering locations at river mouths of catchments with a          extreme events, which is necessary to apply extreme-value
size of between about 1000 and 3 690 000 km2 (95 % having           theory in its generic form, it allows for considering multi-
a size smaller than 50 000 km2 ; Fig. 3f).                          ple storm surges that may occur during a sustained period
                                                                    of high river discharge and that could lead to multiple com-
2.1   Methods                                                       pound floods.
                                                                       The return period is defined as
We assess the potential CF hazard via bivariate return peri-
ods of concurring extreme events (Vandenberghe et al., 2011;        T (xext , yext )
Manning et al., 2019) of the variables X and Y , i.e. storm
                                                                                              µ
surge and precipitation (CFprec ) or storm surge and river dis-     =
charge (CFriver ). Extremes of the individual variables (xext         P ((x > xext and y > yext ) | (x > xsel and y > ysel ))
                                                                                        µ
and yext ) are defined as the associated α-year return levels.      =                                       ,                   (1)
We use different α values in the following, though we present         1 − uXext − uYext + CXY uXext , uYext
the main results for α = 5; images for α = 2 are shown in
the Appendix. Return levels are obtained through fitting a          where µ is the average time elapsing between the selected
generalised-extreme-value distribution to the annual maxima         pairs, uXext = FX (xext ), FX is the marginal cumulative distri-
of the individual variables (Coles et al., 2001). Annual max-       bution of the excesses over the selection threshold (accord-
ima are defined based on adjacent windows centred on the            ingly for Y ), and CXY is the copula modelling the depen-
month where the climatological river discharge average is           dence between the selected pairs (see Fig. A1 for the depen-
the highest, rather than from January–December windows              dence associated with the fitted copulas in the two assess-
(such a window definition reduces the chance of selecting           ments). Note that, as the return period is obtained as a com-
two consecutive annual maxima belonging to the same river           bination of the average elapsing time µ and the parametric
discharge extreme event and therefore leads to a more robust        probability density function of the data in the tail, an exact
definition of the return levels). Overall, given the definition     correspondence between the dependence of the copula and
of the extremes based on α-year return levels, the bivariate        the return period is not expected. We model the marginal
return period is inherently linked to the dependence of the         distributions of X and Y beyond the selection thresholds
pairs in the tail of the distribution.                              by a generalised Pareto distribution (GPD). We fit copulas
   CF bivariate return periods are computed following the           from the families Gaussian, t, Clayton, Gumbel, Frank, Joe,
methodology presented by Bevacqua et al. (2019). The                Clayton–Gumbel, Joe–Gumbel, Joe–Clayton, and Joe–Frank
CF return period computation is based on the bivariate dis-         to the pair (uX , uY ) (obtained via empirical marginal cumu-
tribution of the variables of interest (X and Y ), which is esti-   lative distribution function; Vandenberghe et al., 2011; Man-
mated semi-empirically to allow for robust estimation. For a        ning et al., 2018); then we select the best ranked family ac-
given location, we select pairs whose individual values are si-     cording to the Akaike information criterion. In general, the
multaneously larger than the individual 95th percentiles (xsel      physical processes captured by the two assessments can dif-
and ysel ), and we model these pairs via a copula-based dis-        fer (even at the same location); therefore we allow for the
tribution. If the defined thresholds result in a small group of     selection of different copulas in the two assessments. We
selected pairs, we lower the 95th percentile selection thresh-      fit copulas and marginal distributions via a maximum like-
old to guarantee having at least 20 pairs. The choice of            lihood estimator (“VineCopula” R package of Schepsmeier
20 pairs is a trade off between having a sufficient amount          et al., 2016; “ismev” R package of Heffernan et al., 2016).
of selected pairs and employing a reasonably high thresh-           We test the goodness of fit of copulas and marginals via the
old for the fit of extreme-value parametric distributions in        Cramér–von Mises criterion (“eva” R package of Bader and
the tail. Furthermore, the return periods are largely insen-        Yan, 2016; VineCopula R package).
sitive to changes in the threshold (results are similar based          When referring to the assessment of whether the CF re-
on 20, 30, and 40 pairs; not shown). The selection thresh-          turn periods based on river discharge (Triver ) are statistically
olds are generally high: 75 % of the locations have a selected      different from those based on precipitation (Tprec ) or not,
threshold larger than or equal to the 95th and 94th percentile      we use the concept of statistical compatibility, recently in-
for the precipitation- and river-based analysis, respectively.      troduced by Amrhein et al. (2019). We compute the cen-
And 95 % (99 %) of the locations have a selected threshold          tred 95 % (2.5 %–97.5 %) confidence interval of Tprec on the
above the 93rd (88.5th) and 89th (85th) percentile for the          basis of 600 resampled bivariate time series of precipita-
precipitation- and river-based analysis, respectively.              tion and storm surge (each of them built randomly combin-
   Once pairs are selected, clusters of pairs separated by less     ing observed 1-calendar-year bivariate time series; Bevacqua
than 3 d were considered as part of the same event repre-           et al., 2020). Triver is regarded as being statistically compati-

https://doi.org/10.5194/nhess-20-1765-2020                                  Nat. Hazards Earth Syst. Sci., 20, 1765–1782, 2020
1768 E. Bevacqua et al.: Difference in assessing global compound flooding based on sea level
ble with Tprec if Triver lies within the 95 % confidence interval We find that there is a tendency towards higher differ-
of Tprec and incompatible otherwise. ences in the two assessments at locations where either or both
We qualitatively investigate how the two assessments com- Tprec and Triver are high (i.e. where T approaches the value
pare for different classes of catchment size. To do so, we expected under the independence of the CF drivers; Fig. A6).
rank the rivers based on their catchment size and divide them (This appears consistent with the high uncertainty associated
into groups having the same sample size; for each group with large CF return periods.) Such a finding has relevant im-
we compute different statistics to compare the two assess- plications, as it indicates that the two assessments tend to be
ments: the Spearman correlation of Triver and Tprec , the ra- similar, on average, where assessing the actual CF is more
tio of Triver /Tprec , and the percentage of locations with Triver important, i.e. where there is a relatively high CF potential
compatible to Tprec . This binning procedure provides equally (Fig. A6).
robust statistics for each bin and shows similar results for The spatial association of the return period map obtained
small variations in the bin size. from the two assessments is shown in Figs. 3a and A7a. The
Spearman correlation between Triver and Tprec is ∼ 0.7 and
2.1.1 Results and discussion increases as the return level threshold employed to define the
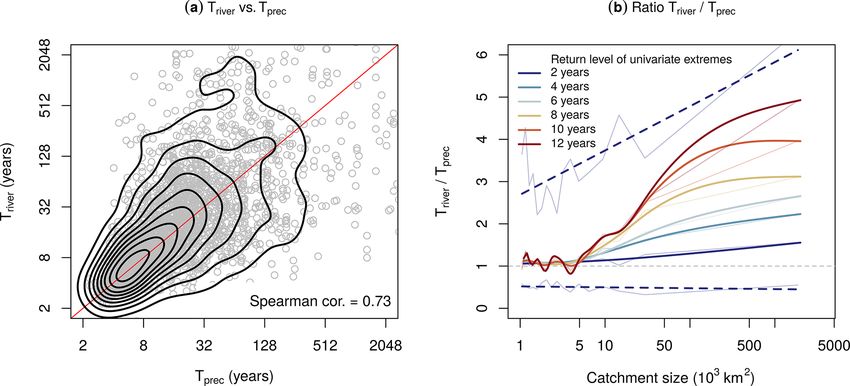
extremes decreases, e.g. 0.66 and 0.73 for the 5- and 2-year
The spatial patterns of the potential CF return periods based return level, respectively (Figs. 3a and A7a). This trend in the
on either precipitation (Tprec ) or river discharge (Triver ) are correlation is consistent with the higher uncertainties charac-
very similar (Fig. 1; Fig. A2 is identical but shows results terising larger return periods.
based on extremes defined considering 2-year return lev- Although some of the differences between the two assess-
els). The results for clusters of locations with the 5 % low- ments can be driven by uncertainties in the return period
est CF return periods are also similar in the two assessments estimation, also several physical processes, e.g. topography-
(Figs. A3 and A4). These hotspot regions are mainly found dependent ones, may be involved. The Spearman correlation
along the US, Central American, and southern North Atlantic between the two assessments decreases (p value < 0.0024)
coasts and in central Chile, Madagascar, and southern Japan. as the catchment size increases (Fig. 3c). The latter suggests
While the spatial patterns of the CF return periods ob- that – for larger catchments – different processes may cause
tained from the two approaches are very similar, their rela- either positive or negative deviations between Triver and Tprec .
tive differences can be substantial, especially at certain lo- Water levels in the mouth of small rivers are expected to
cations (Figs. 2 and A5). Given that the return period com- be largely influenced by the precipitation around the coast
putation procedure involves several uncertainty factors (e.g. (Hendry et al., 2019; van den Hurk et al., 2015; Bevacqua
bivariate model fitting and the definition of the return levels), et al., 2017), while around large rivers, inland hydrologi-
we test the hypothesis that the return period based on the cal processes are usually dominant. Therefore, we qualita-
river discharge is statistically compatible (at a 95 % confi- tively investigate whether the actual difference between the
dence level) with that based on precipitation. When defining two assessments (quantified as Triver /Tprec ) depends on the
extremes based on the 5-year return levels, the river-based re- size of the catchment (Hendry et al., 2019). For example, the
turn period is compatible with the precipitation-based value Triver /Tprec ratio, defined using the 5-year return level, tends
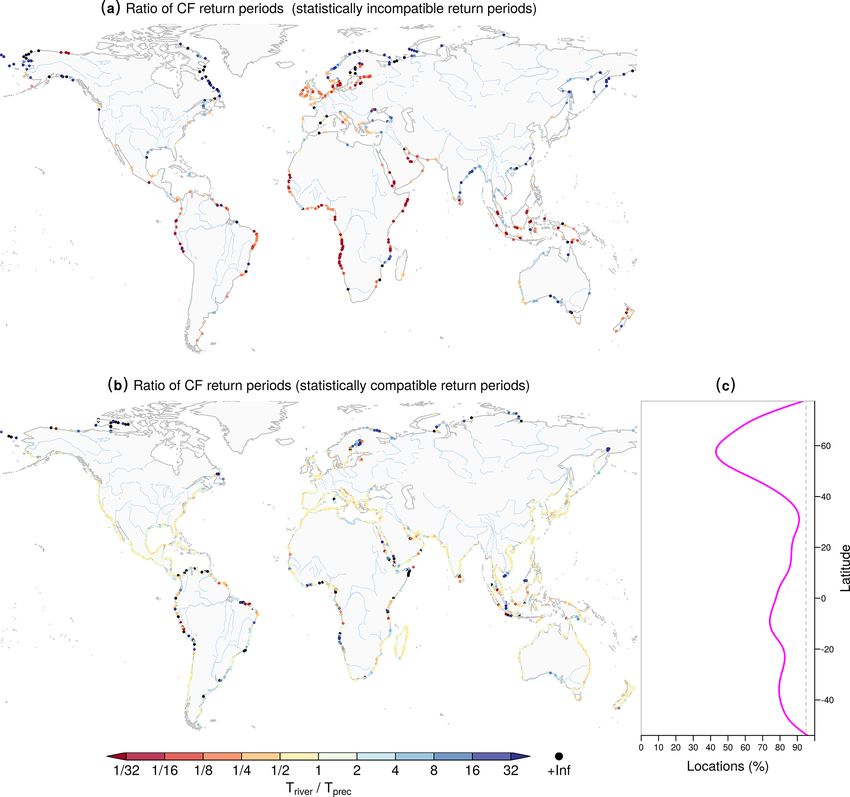
in about 82 % of the locations (Fig. 2c; 76 % for 2-year return to increase with the catchment size (Fig. 3b; see the devia-
levels; Fig. A5c). The spatial distribution of locations where tion of the scatterplot of Triver vs. Tprec from the identity line
Triver is not statistically compatible with Tprec does not seem emerging with the increasing dimension of the catchment).
to follow a clear spatial pattern, though it appears that Triver is For CF return periods defined based on 2-year return level
lower than Tprec in northern Europe and in the tropics. The extremes, the median Triver /Tprec ratio is near unity for most
latter are areas where CF is unlikely. Triver is higher than Tprec of the catchments, even though the Triver /Tprec ratio increases
along the Gulf of Mexico (Figs. 2c and A5c). Compatible slightly for larger catchments (blue line in Fig. 3d). For
Triver and Tprec values are found but with large discrepan- higher return levels, the median Triver /Tprec ratio increases
cies in the tropics and above 60◦ N (Fig. 2b), consistent with with the size of the catchment (Fig. 3d), indicating that the
the high uncertainty of these large CF return periods that do CF assessments based on precipitation and river discharge
not allow for detecting potential differences between Triver differ largely for large rivers. For all return levels, the median
and Tprec . Triver /Tprec ratio is near unity for rivers whose catchment size
In areas with a tendency towards high CF return periods, is up to about 5–10 × 103 km2 (Fig. 3d), i.e. about 75 % of
e.g. the tropics, neighbour locations show divergent values in the rivers presently analysed (Fig. 3f). Binning the rivers per
the ratio between the return periods of the two assessments catchment size, we find that the variance of the Triver /Tprec
(dark-blue and red dots in Fig. 2). Further tests showed that ratio within each bin tends to be smaller for small rivers than
this behaviour is not related to the goodness of fit of the for large rivers (Fig. 3d, shown by the dashed line for the 2-
bivariate distributions; rather it appears associated with the year return level). However, it is important to highlight that
large uncertainties of high return periods and potentially with there is substantial variance (Fig. 3d for the 2-year return
different catchment characteristics. level extremes), and that for a river of any catchment size
Nat. Hazards Earth Syst. Sci., 20, 1765–1782, 2020 https://doi.org/10.5194/nhess-20-1765-2020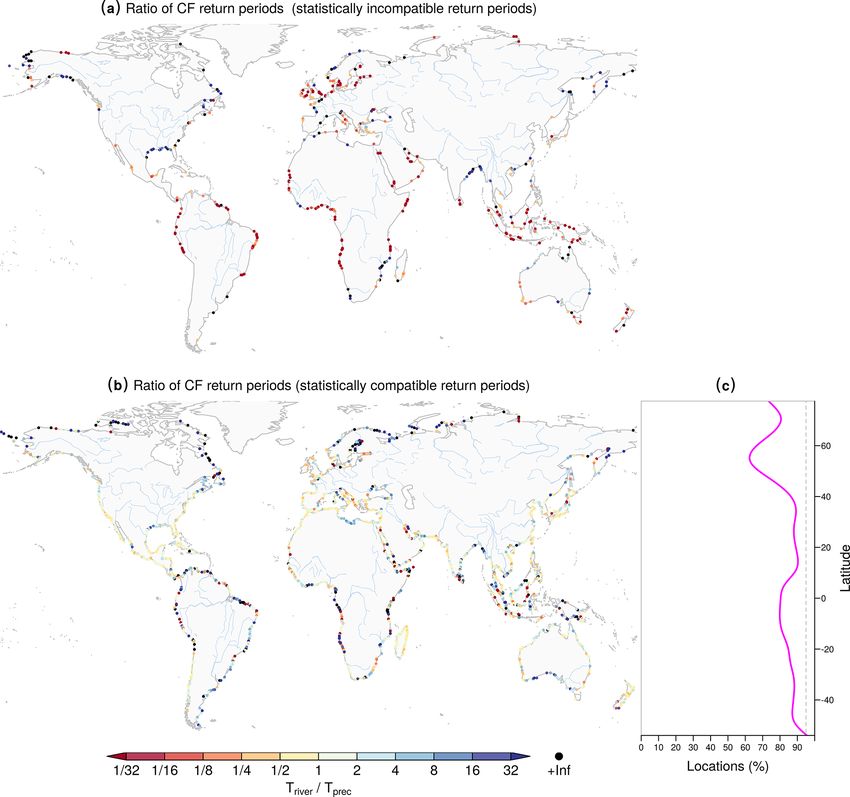
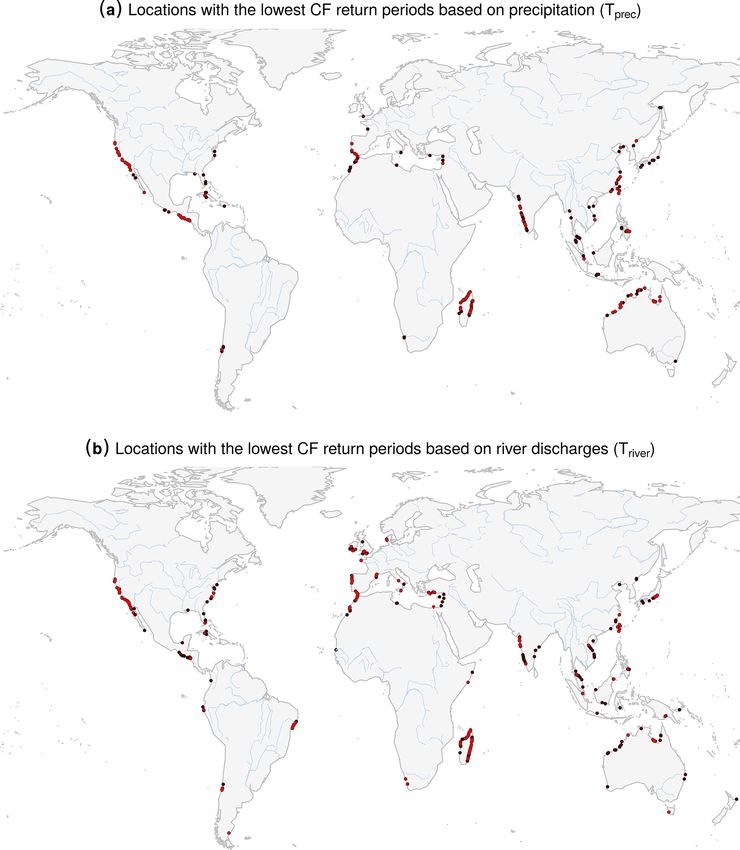
E. Bevacqua et al.: Difference in assessing global compound flooding based on sea level                                            1769

Figure 1. Present-day (1980–2014) potential compound-flooding probability based on precipitation and on river discharge. Return periods
of CF defined as co-occurring extremes (5-year return levels) of the CF drivers. Return period of co-occurring (a) storm surge (including
waves) and precipitation (accumulated 3 d centred) extremes and (b) storm surge (including waves) and river discharge extremes. Major
rivers are shown in light blue. Infinite values are shown in black.

the associated Triver /Tprec ratio can be either small or large.       small rivers (catchment size < 5000 km2 ) and for ∼ 75 % of
Overall, the similarity of Triver and Tprec for small rivers is        large rivers (catchment size > 50 000 km2 ). The decrease in
highlighted by the fact that for small rivers it is more likely        the compatibility of Triver and Tprec with the catchment size
that Triver is statistically compatible with Tprec (Fig. 3e).          (Fig. 3e) is statistically significant for return levels smaller
For example, Fig. 3e (4-year return level curve) shows that            than the 6-year return level (p value < 0.022). However, for
Triver is statistically compatible with Tprec for ∼ 82 % of the        high return levels this decrease is not prominent, most likely

https://doi.org/10.5194/nhess-20-1765-2020                                    Nat. Hazards Earth Syst. Sci., 20, 1765–1782, 2020
1770                                  E. Bevacqua et al.: Difference in assessing global compound flooding based on sea level

Figure 2. Difference between the present-day (1980–2014) potential compound-flooding probability based on precipitation and on river
discharge. Ratio (Triver /Tprec ) of CF return period of concurring river discharge and storm surge extremes (Triver ) to CF return period of
concurring precipitation (accumulated 3 d centred) and storm surge extremes (Tprec ). (a) The ratio where Triver is statistically incompatible
(at 95 % confidence level; see Methods) with Tprec . (b) The ratio where Triver is statistically compatible with Tprec , while (c) shows the
coastline fraction where this happens (binned every 5◦ of latitude and smoothed using a spline function). In (c), the dashed grey line shows
the 95 % level.

due to the large uncertainty associated with longer return pe-              The differences between Triver and Tprec are not only con-
riods. Figure 3e indicates the discrepancy for large catch-              trolled by the catchment size but can be the result of several
ments in the Triver /Tprec ratio being greater for low return            other factors. During the hydrological modelling, input data
levels, whereas Fig. 3d indicates the opposite; this is also             artefacts or model inaccuracies, among other factors, intro-
likely caused by the larger uncertainty of return periods of             duce uncertainty which may contribute to the observed dif-
higher return levels, which does not allow for detecting po-             ferences. Another important contribution should arise from
tential differences between large values of Triver and Tprec .           the uncertainties in the bivariate return period estimation

Nat. Hazards Earth Syst. Sci., 20, 1765–1782, 2020                                        https://doi.org/10.5194/nhess-20-1765-2020
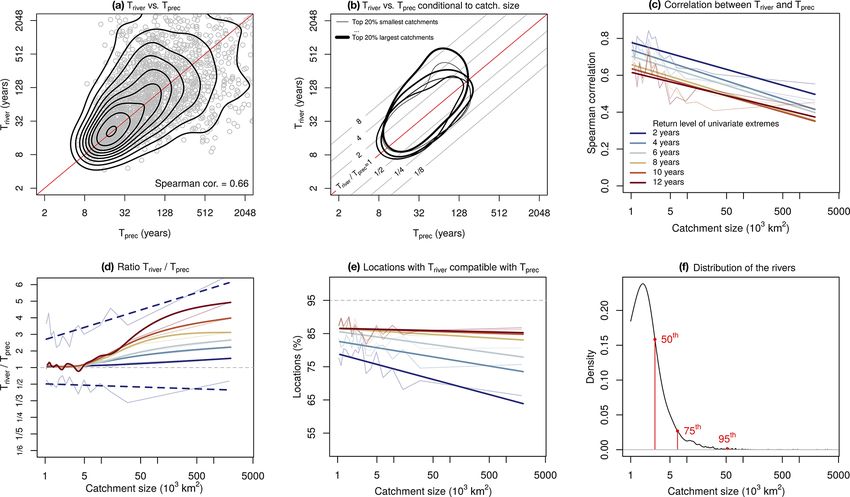
E. Bevacqua et al.: Difference in assessing global compound flooding based on sea level                                                      1771

Figure 3. Comparison of the potential compound-flooding probability based on precipitation and on river discharge. (a) Scatterplot (based
on Fig. A2) of CF return periods based on river discharge (Triver ) and on precipitation (Tprec ) for extremes defined based on 5-year return
levels. Black contours represent the isolines of the kernel density containing from 10 % to 90 % of the (Triver , Tprec ) pairs. The identity line
is shown in red. (b) Empirical probability density function of the variables (Triver , Tprec ) conditioned on the catchment size; the thickness
of the isolines increases with the catchment size such that each bin considers one fifth of the total number of analysed rivers (3178). Each
contour line (isolines of the kernel density) contains about 50 % of the (Triver , Tprec ) pairs. (c-e) Statistics comparing Triver and Tprec as a
function of the catchment size and of the return levels used to define the CF univariate extremes (see legend in a). (c) Spearman correlation
between the maps of Triver and Tprec . (d) Triver /Tprec ratio. The dashed line is the centred 68 % (16th–84th percentiles) confidence interval
of the ratio based on the 2-year return levels. A non-linear y axis for values below 1 is plotted such that the specular cases, e.g. ratio r = 2
(Triver = 2 · Tprec ) and r = 1/2 (Tprec = 2 · Triver ) (see b), appear symmetric with respect to r = 1 (Triver = Tprec ). (To obtain the plot, the
ratio is defined as r = Triver /Tprec ; then if r < 1, r is transformed to r = −Tprec /Triver + 2. Now e.g. r = 2 and r = 0 represent specular
cases; therefore, where the y axis is r = 0, 1, 2, . . . , we can write r = 1/2, 1/3, 1/4, . . . .) See Fig. A7b for the plot with a standard axis.
(e) Percentage of locations where Triver is statistically compatible with Tprec at the 95% confidence level. (f) Probability density function
of the catchment size of the analysed rivers; 50th, 75th, and 95th percentiles of the distribution are shown in red. In (c–e), thick lines are
obtained through regressing the obtained statistical values per bin (thin lines) to the natural logarithm of the mean size of the catchment bins.
All lines are regressed using linear regression, except from the median of the ratio in (d), where a spline function is used. The slopes of the
linear regressions are all significant in (c) (p value < 0.0024) and significant up to the 6-year return level in (e) (p value < 0.022).

(Bevacqua et al., 2019; Wahl et al., 2015), which can con-                  (Blöschl et al., 2019). For example, for any given catch-
tribute to both positive and negative deviations between Triver             ment, a slow catchment response time may either increase
and Tprec . Moreover, the catchment response time to pre-                   or decrease the Triver /Tprec ratio. In locations where cyclones
cipitation depends also on rock and soil catchment perme-                   cause frequent concurring storm surge and widespread
ability (Hendry et al., 2019). Finally, river discharge is in-              coastal precipitation, it is not guaranteed that CFriver prob-
fluenced not only by local coastal precipitation but also by                ability will be also high. For example, if the rainfall in
the weather over the previous weeks or months over the                      the catchment upstream needs time to reach the coast long
catchment, including evaporation and potentially snowmelt                   enough for the storm surge to recede, then CFriver will be
(Couasnon et al., 2020; Bevacqua et al., 2017).                             unlikely, and in this case the Triver /Tprec ratio will be high
   Clearly, the diversity of the physical processes leading                 (Klerk et al., 2015; Ward et al., 2018). In contrast, where the
to CFprec and CFriver is very relevant and can cause both                   CFprec is unlikely because different weather systems cause
positive and negative differences between Triver and Tprec                  precipitation and storm surge extremes, a relatively slow

https://doi.org/10.5194/nhess-20-1765-2020                                          Nat. Hazards Earth Syst. Sci., 20, 1765–1782, 2020
1772                               E. Bevacqua et al.: Difference in assessing global compound flooding based on sea level

catchment response time may sometimes allow for high river         such processes are not resolved by the global models used to
discharge and storm surge to concur if e.g. a first cyclone        generate the forcing datasets used in the present study. For
causes precipitation driving high river discharge reaching the     these reasons, the present findings should be interpreted with
coast when a second cyclone drives a storm surge (contribut-       care, especially in northern regions (Couasnon et al., 2020).
ing to a low Triver /Tprec ratio; Bevacqua et al., 2019).             The two approaches investigated here provide information
   In addition the presence of a pronounced annual cycle           only on the potential for CF. The actual CF occurrence de-
in river discharge can modulate the river-discharge-driven         pends also on the local topography which can favour or not
CF hazard and thus the Triver /Tprec ratio. In regions where       favour the interaction between the CF drivers; also, concur-
CFprec is likely, CFriver may be unlikely if the storm surge       rent but not hydrologically interacting storm surges and plu-
season does not coincide with the season of the high river         vial or fluvial flooding are relevant as they can e.g. limit the
discharge (high Triver /Tprec ratio; Ward et al., 2018). In        ability to respond to emergency and amplify the impacts that
contrast, where the CFprec is unlikely, CFriver may be more        the two hazards would have caused if they occurred in iso-
likely if the storm surge season coincides with the high-river-    lation (Martius et al., 2016; Barton et al., 2016; Zscheis-
discharge season (low Triver /Tprec ratio). In addition, precip-   chler et al., 2019). Moreover, while the two approaches in-
itation extremes are typically short in duration, while river      vestigated here are supposed to represent different CF mech-
discharge extremes are less dynamic. Although events ex-           anisms, separating the CF mechanisms in this way could
ceeding the α-year return level threshold occur both for pre-      be misleading, as CF may happen due to a combination of
cipitation and river discharge on average every α years, the       river discharge, local rainfall and associated surface runoff,
number of days with high river discharge can be larger than        and high sea level. For example, in July 2019, New Orleans
the number of days with a high precipitation amount. From a        (Louisiana, USA; Vahedifard et al., 2016) was simultane-
statistical point of view, the above mechanism alone would         ously threatened by Hurricane Barry causing local rainfall
make CFriver more likely than CFprec (low Triver /Tprec ra-        and a storm surge around the coast and by extremely high
tio; this effect is even more pronounced in catchments with        water discharge from the Mississippi River which lasted from
a slow response time and especially in areas where differ-         March to July. CF risk assessment at the local scale should
ent weather systems cause precipitation and storm surge ex-        be carried out via complex hydrological modelling that can
tremes; Bevacqua et al., 2020). The above effect is weakened       take into account the complex mechanisms causing CF, in-
as the return level threshold used to define extremes increases    cluding storm surges, waves, astronomical tides, and when
due to the shorter duration of river discharge extremes. The       necessary not only fluvial or pluvial flooding but also their
above considerations justify the Triver /Tprec ratio increasing    combination.
with the return level choice (Fig. 3d).
   While the relevance of the mechanisms discussed above
may depend on the local climate, they are expected to be           3   Conclusions
less relevant in very small rivers where the catchment re-
sponse time is small, and thus autocorrelation in the river        We conduct two global-scale potential CF hazard assess-
time series is smaller. Consistently, we find that Triver and      ments, using either storm surge and precipitation or storm
Tprec tend to match more in smaller catchments. However,           surge and river discharge model data, and we then compare
a higher agreement for small rivers might also arise from          how the choice of precipitation vs. river discharge as a co-
the relatively coarse spatial resolution of the data which         variate with storm surge affects the results. We find that the
would attenuate differences between precipitation and river        two approaches result in similar spatial CF hazard patterns,
discharges in small rivers. Overall, we find that independent      which tend to deviate as the river catchment size increases. In
of the catchment size, Triver tends to be higher than Tprec on     addition, on average, the deviations between the two assess-
average (Fig. 3d), suggesting that the mechanisms causing          ments are smaller in regions where assessing the actual CF is
Triver > Tprec may be more likely or relevant. Apparently this     more relevant, i.e. where the CF potential is high.
is a general remark and not a universal law, since there are          Due to data scarcity, current large-scale CF assessments
also several locations where Tprec exceeds Triver .                rely on approaches and model-based datasets similar to
   The presented results are based on state-of-the-art model       those used here. This study indicates that for these large-
data which have been validated and discussed in previous           scale assessments, a precipitation-based CF analysis can pro-
papers (Vousdoukas et al., 2018; Beck et al., 2017a; Couas-        vide satisfactory information on the CF potential in estuar-
non et al., 2020; Bevacqua et al., 2019; Muis et al., 2016).       ies of small- and medium-sized rivers (catchment smaller
However, the above-mentioned validation efforts did not in-        than about 5–10 × 103 km2 ). Moreover, a precipitation-based
clude areas where field measurements are scarce, like parts of     CF analysis allows for assessing the CF hazard arising from
South America, Africa, and Asia (Ward et al., 2018). At high       the interaction of local coastal rainfall and storm surges
latitudes, ice and snow dynamics apply a certain control to        where no rivers exist or along the mouths of small rivers often
both river hydrology (Yamazaki et al., 2014) and wave and          not represented in global river datasets. Naturally, employing
storm surge dynamics (Vousdoukas et al., 2017). However,           river discharge data should always be preferred to using pre-

Nat. Hazards Earth Syst. Sci., 20, 1765–1782, 2020                                https://doi.org/10.5194/nhess-20-1765-2020
E. Bevacqua et al.: Difference in assessing global compound flooding based on sea level                          1773

cipitation when studying both the large- and local-scale CF in
estuaries, when data are available, especially in areas where
we detected large differences between the two approaches.
The importance of using river discharge data is even greater
in estuaries of long rivers.

https://doi.org/10.5194/nhess-20-1765-2020                          Nat. Hazards Earth Syst. Sci., 20, 1765–1782, 2020
1774                                 E. Bevacqua et al.: Difference in assessing global compound flooding based on sea level

Appendix A: Supporting figures

Figure A1. Kendall’s τ correlation associated with the copulas fitted to the selected pairs of (a) precipitation and sea level and (b) river
discharge and sea level.

Nat. Hazards Earth Syst. Sci., 20, 1765–1782, 2020                                       https://doi.org/10.5194/nhess-20-1765-2020
E. Bevacqua et al.: Difference in assessing global compound flooding based on sea level                                      1775

Figure A2. The same as Fig. 1, but the extremes are defined as 2-year return levels.

https://doi.org/10.5194/nhess-20-1765-2020                                      Nat. Hazards Earth Syst. Sci., 20, 1765–1782, 2020
1776                                 E. Bevacqua et al.: Difference in assessing global compound flooding based on sea level

Figure A3. Locations with the lowest potential compound-flooding probability based on precipitation and on river discharge. Locations with
return periods below the 10th and 5th percentile are shown in black and red, respectively. The extremes are defined considering 5-year return
levels. CF return periods are based on precipitation in (a) and on river discharge in (b).

Nat. Hazards Earth Syst. Sci., 20, 1765–1782, 2020                                        https://doi.org/10.5194/nhess-20-1765-2020
E. Bevacqua et al.: Difference in assessing global compound flooding based on sea level                                     1777

Figure A4. The same as Fig. A3, but the results are based on extremes defined considering 2-year return levels.

https://doi.org/10.5194/nhess-20-1765-2020                                     Nat. Hazards Earth Syst. Sci., 20, 1765–1782, 2020
1778                                 E. Bevacqua et al.: Difference in assessing global compound flooding based on sea level

Figure A5. The same as Fig. 2, but the results are based on extremes defined considering 2-year return levels.

Nat. Hazards Earth Syst. Sci., 20, 1765–1782, 2020                                       https://doi.org/10.5194/nhess-20-1765-2020
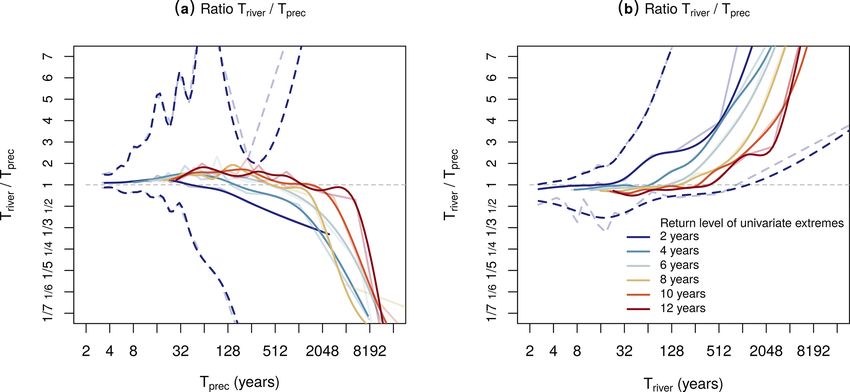
E. Bevacqua et al.: Difference in assessing global compound flooding based on sea level                                                     1779

Figure A6. (a) Ratio between the CF return periods based on river discharge (Triver ) and on precipitation (Tprec ) as a function of Tprec (and
of the return levels used to define the CF univariate extremes; see legend in b). The dashed line is the centred 68 % (16th–84th percentiles)
confidence interval of the ratio based on the 2-year return levels. Thick lines are obtained through regressing the investigated statistical
values to the natural logarithm of the mean return period of the bins via a spline function. (b) The same as (a), but the ratio is conditioned
on Triver . As in Fig. 3d of the original paper, a non-linear y axis for values below 1 is employed such that the specular cases, e.g. ratio r = 2
(Triver = 2 · Tprec ) and r = 1/2 (Tprec = 2 · Triver ) (see Fig. 3b), appear symmetric with respect to r = 1 (Triver = Tprec ).

Figure A7. (a) The same as Fig. 3a, but the results are based on extremes defined considering 2-year return levels (the figure is based on
Fig. A2). (b) As Fig. 3d but with a linear y axis.

https://doi.org/10.5194/nhess-20-1765-2020                                         Nat. Hazards Earth Syst. Sci., 20, 1765–1782, 2020
1780                                   E. Bevacqua et al.: Difference in assessing global compound flooding based on sea level

Data availability. Precipitation data are available on request on-        References
line (https://ec.europa.eu/jrc/en/publication/mswep-3-hourly-025-
global-gridded-precipitation-1979-2014 last access: 15 July 2020)         Amrhein, V., Greenland, S., and McShane, B.: Scientists rise
(Beck et al., 2017b). Sea level data are available at https://data.jrc.     up against statistical significance, Nature, 567, 305–307,
ec.europa.eu/collection/liscoast (last access: 15 July 2020) (Vous-         https://doi.org/10.1038/d41586-019-00857-9, 2019.
doukas et al., 2018) (further inquiries should be addressed to            Bader, B. and Yan, J.: eva: Extreme Value Analysis with
Michalis I. Vousdoukas). River discharge data obtained from the             Goodness-of-Fit Testing, R package version 0.2.4, avail-
dataset “Paired time series of daily discharge and storm surge”             able at: https://mran.microsoft.com/snapshot/2017-08-06/web/
are available at https://doi.org/10.5281/zenodo.3258007 (Eilander,          packages/eva/eva.pdf (last access: 16 December 2019), 2016.
2019).                                                                    Barton, Y., Giannakaki, P., Von Waldow, H., Chevalier, C., Pfahl,
                                                                            S., and Martius, O.: Clustering of regional-scale extreme precip-
                                                                            itation events in southern Switzerland, Mon. Weather Rev., 144,
Author contributions. EB initiated the study, carried out the data          347–369, 2016.
analysis, and drafted the paper. EB designed the study development        Beck, H. E., van Dijk, A. I. J. M., de Roo, A., Dutra, E., Fink,
with contributions from MIV. EB and MIV worked on the final ver-            G., Orth, R., and Schellekens, J.: Global evaluation of runoff
sion of the paper. MIV performed the storm surge runs. All the au-          from 10 state-of-the-art hydrological models, Hydrol. Earth Syst.
thors gave conceptual inputs during the data analysis, discussed the        Sci., 21, 2881–2903, https://doi.org/10.5194/hess-21-2881-2017,
results, and commented on the paper.                                        2017a.
                                                                          Beck, H. E., van Dijk, A. I. J. M., Levizzani, V., Schellekens,
                                                                            J., Miralles, D. G., Martens, B., and de Roo, A.: MSWEP: 3-
                                                                            hourly 0.25◦ global gridded precipitation (1979–2015) by merg-
Competing interests. The authors declare that they have no conflict
                                                                            ing gauge, satellite, and reanalysis data, Hydrol. Earth Syst. Sci.,
of interest.
                                                                            21, 589–615, https://doi.org/10.5194/hess-21-589-2017, 2017b.
                                                                          Bevacqua, E., Maraun, D., Hobæk Haff, I., Widmann, M.,
                                                                            and Vrac, M.: Multivariate statistical modelling of compound
Special issue statement. This article is part of the special issue          events via pair-copula constructions: analysis of floods in
“Global- and continental-scale risk assessment for natural hazards:         Ravenna (Italy), Hydrol. Earth Syst. Sci., 21, 2701–2723,
methods and practice”. It is a result of the European Geosciences           https://doi.org/10.5194/hess-21-2701-2017, 2017.
Union General Assembly 2018, Vienna, Austria, 8–13 April 2018.            Bevacqua, E., Maraun, D., Vousdoukas, M. I., Voukouvalas, E.,
                                                                            Vrac, M., Mentaschi, L., and Widmann, M.: Higher probabil-
                                                                            ity of compound flooding from precipitation and storm surge
Acknowledgements. Emanuele Bevacqua acknowledges the Eu-                    in Europe under anthropogenic climate change, Sci. Adv., 5,
ropean COST Action DAMOCLES programme (no. CA17109).                        eaaw5531, https://doi.org/10.1126/sciadv.aaw5531, 2019.
Mathieu Vrac acknowledges financial support from the EUPHEME              Bevacqua, E., Vousdoukas, M., Zappa, G., Hodges, K., Shepherd,
project and CoCliServ project, which are part of ERA4CS, an ERA-            T., Maraun, D., Mentaschi, L., and Feyen, L.: Global projections
NET initiated by JPI Climate and co-funded by the European Union.           of compound coastal meteorological extremes, preprint: Earth-
The authors would like to thank Lorenzo Mentaschi and Evange-               ArXiv, https://doi.org/10.31223/osf.io/4x2u8, 2020.
los Voukouvalas, who contributed in the generation of the storm           Blöschl, G., Hall, J., Viglione, A., Perdigão, R. A., Parajka, J., Merz,
surge time series, and Dirk Eilander for creating and publicly shar-        B., Lun, D., Arheimer, B., Aronica, G. T., Bilibashi, A., Boháč,
ing the dataset “Paired time series of daily discharge and storm            M., Bonacci, O., Borga, M., Čanjevac, I., Castellarin, A., Chirico,
surge”, which was fundamental for the development of this study.            G. B., Claps, P., Frolova, N., Ganora, D., Gorbachova, L., Gül,
Finally, the authors would like to thank two anonymous reviewers            A., Hannaford, J., Harrigan, S., Kireeva, M., Kiss, A., Kjeld-
for their valuable and constructive comments and suggestions that           sen, T. R., Kohnová, S., Koskela, J. J., Ledvinka, O., Macdonald,
contributed to improving the paper.                                         N., Mavrova-Guirguinova, M., Mediero, L., Merz, R., Molnar,
                                                                            P., Montanari, A., Murphy, C., Osuch, M., Ovcharuk, V., Rade-
                                                                            vski, I., Salinas, J. L., Sauquet, E., Šraj, M., Szolgay, J., Volpi,
Financial support. This research has been supported by the Euro-            E., Wilson, D., Zaimi, K., and Živković, N.: Changing climate
pean Research Council (grant no. 339390) and the European Union             both increases and decreases European river floods, Nature, 573,
(grant no. 690462).                                                         108–111, 2019.
                                                                          Coles, S., Bawa, J., Trenner, L., and Dorazio, P.: An introduction
                                                                            to statistical modeling of extreme values, in: vol. 208, Springer,
Review statement. This paper was edited by Philip Ward and re-              London, 2001.
viewed by two anonymous referees.                                         Couasnon, A., Eilander, D., Muis, S., Veldkamp, T. I., Haigh, I. D.,
                                                                            Wahl, T., Winsemius, H., and Ward, P. J.: Measuring compound
                                                                            flood potential from river discharge and storm surge extremes
                                                                            at the global scale, Nat. Hazards Earth Syst. Sci., 20, 489–504,
                                                                            https://doi.org/10.5194/nhess-20-489-2020, 2020.
                                                                          Dee, D. P., Uppala, S., Simmons, A., Berrisford, P., Poli, P.,
                                                                            Kobayashi, S., Andrae, U., Balmaseda, M., Balsamo, G., Bauer,
                                                                            P., Bechtold, P., Beljaars, A. C. M., van de Berg, L., Bidlot, J.,

Nat. Hazards Earth Syst. Sci., 20, 1765–1782, 2020                                         https://doi.org/10.5194/nhess-20-1765-2020
E. Bevacqua et al.: Difference in assessing global compound flooding based on sea level 1781 Bormann, N., Delsol, C., Dragani, R., Fuentes, M., Geer, A. J., Nat. Commun., 7, 11969, https://doi.org/10.1038/ncomms11969, Haimberger, L., Healy, S. B., Hersbach, H., Hólm, E. V., Isak- 2016. sen, L., Kållberg, P., Köhler, M., Matricardi, M., McNally, A. Olbert, A. I., Comer, J., Nash, S., and Hartnett, M.: High-resolution P., Monge-Sanz, B. M., Morcrette, J.-J., Park, B.-K., Peubey, C., multi-scale modelling of coastal flooding due to tides, storm de Rosnay, P., Tavolato, C., Thépaut, J.-N., and Vitart, F.: The surges and rivers inflows. A Cork City example, Coast. Eng., 121, ERA-Interim reanalysis: Configuration and performance of the 278–296, 2017. data assimilation system, Q. J. Roy. Meteorol. Soc., 137, 553– Paprotny, D., Vousdoukas, M. I., Morales-Nápoles, O., Jonkman, S. 597, 2011. N., and Feyen, L.: Compound flood potential in Europe, Hydrol. Eilander, D.: Paired time series of daily discharge and storm surge, Earth Syst. Sci. Discuss., https://doi.org/10.5194/hess-2018-132, Zenodo, https://doi.org/10.5281/zenodo.3258007, 2019. 2018. Ganguli, P. and Merz, B.: extreme coastal Water Levels exacerbate Ridder, N., de Vries, H., and Drijfhout, S.: The role of atmo- fluvial flood Hazards in northwestern europe, Scient. Rep., 9, 1– spheric rivers in compound events consisting of heavy precipi- 14, 2019a. tation and high storm surges along the Dutch coast, Nat. Hazards Ganguli, P. and Merz, B.: Trends in Compound Flooding in North- Earth Syst. Sci., 18, 3311–3326, https://doi.org/10.5194/nhess- western Europe During 1901–2014, Geophys. Res. Lett., 46, 18-3311-2018, 2018. 10810–10820, 2019b. Schepsmeier, U., Stoeber, J., Brechmann, E. C., Graeler, B., Nagler, Heffernan, J., Stephenson, A., and Gilleland, E.: Ismev: an intro- T., and Erhardt, T.: VineCopula: Statistical inference of vine cop- duction to statistical modeling of extreme values, R package ulas, R package version 2.0.5, availble at: https://cran.r-project. version 1.41, available at: https://CRAN.R-project.org/package= org/web/packages/VineCopula/ (last access: 16 December 2019), ismev (last access: 16 December 2019), 2016. 2016. Hendry, A., Haigh, I. D., Nicholls, R. J., Winter, H., Neal, Vahedifard, F., AghaKouchak, A., and Jafari, N. H.: Com- R., Wahl, T., Joly-Laugel, A., and Darby, S. E.: Assessing pound hazards yield Louisiana flood, Science, 353, 1374, the characteristics and drivers of compound flooding events https://doi.org/10.1126/science.aai8579, 2016. around the UK coast, Hydrol. Earth Syst. Sci., 23, 3117–3139, Vandenberghe, S., Verhoest, N., Onof, C., and De Baets, B.: A https://doi.org/10.5194/hess-23-3117-2019, 2019. comparative copula-based bivariate frequency analysis of ob- Khanal, S., Ridder, N., de Vries, H., Terink, W., and van den Hurk, served and simulated storm events: A case study on Bartlett- B.: Storm Surge and Extreme River Discharge: A Compound Lewis modeled rainfall, Water Resour. Res., 47, W07529, Event Analysis Using Ensemble Impact Modeling, Front. Earth https://doi.org/10.1029/2009WR008388, 2011. Sci., 7, 224, https://doi.org/10.3389/feart.2019.00224, 2019. van den Hurk, B., van Meijgaard, E., de Valk, P., van Heeringen, K.- Klerk, W.-J., Winsemius, H., van Verseveld, W., Bakker, A., and J., and Gooijer, J.: Analysis of a compounding surge and precip- Diermanse, F.: The co-incidence of storm surges and extreme dis- itation event in the Netherlands, Environ. Res. Lett., 10, 035001, charges within the Rhine–Meuse Delta, Environ. Res. Lett., 10, https://doi.org/10.1088/1748-9326/10/3/035001, 2015. 035005, https://doi.org/10.1088/1748-9326/10/3/035005, 2015. Vousdoukas, M. I., Mentaschi, L., Voukouvalas, E., Verlaan, M., Kumbier, K., Carvalho, R. C., Vafeidis, A. T., and Woodroffe, and Feyen, L.: Extreme sea levels on the rise along Europe’s C. D.: Investigating compound flooding in an estuary using coasts, Earth’s Future, 5, 304–323, 2017. hydrodynamic modelling: a case study from the Shoalhaven Vousdoukas, M. I., Mentaschi, L., Voukouvalas, E., Verlaan, River, Australia, Nat. Hazards Earth Syst. Sci., 18, 463–477, M., Jevrejeva, S., Jackson, L. P., and Feyen, L.: Global https://doi.org/10.5194/nhess-18-463-2018, 2018. probabilistic projections of extreme sea levels show inten- Manning, C., Widmann, M., Bevacqua, E., Van Loon, A. F., Ma- sification of coastal flood hazard, Nat. Commun., 9, 2360, raun, D., and Vrac, M.: Soil moisture drought in Europe: a com- https://doi.org/10.1038/s41467-018-04692-w, 2018. pound event of precipitation and potential evapotranspiration on Wahl, T., Jain, S., Bender, J., Meyers, S. D., and Luther, M. E.: In- multiple time scales, J. Hydrometeorol., 19, 1255–1271, 2018. creasing risk of compound flooding from storm surge and rainfall Manning, C., Widmann, M., Bevacqua, E., Van Loon, A. F., for major US cities, Nat. Clim. Change, 5, 1093–1097, 2015. Maraun, D., and Vrac, M.: Increased probability of com- Ward, P. J., Couasnon, A., Eilander, D., Haigh, I. D., Hendry, pound long-duration dry and hot events in Europe dur- A., Muis, S., Veldkamp, T. I., Winsemius, H. C., and Wahl, ing summer (1950–2013), Environ. Res. Lett., 14, 094006, T.: Dependence between high sea-level and high river dis- https://doi.org/10.1088/1748-9326/ab23bf, 2019. charge increases flood hazard in global deltas and estuaries, Martius, O., Pfahl, S., and Chevalier, C.: A global quantification of Environ. Res. Lett., 13, 084012, https://doi.org/10.1088/1748- compound precipitation and wind extremes, Geophys. Res. Lett., 9326/aad400, 2018. 43, 7709–7717, 2016. Wu, W. and Leonard, M.: Impact of ENSO on dependence between Mentaschi, L., Vousdoukas, M. I., Voukouvalas, E., Dosio, A., and extreme rainfall and storm surge, Environ. Res. Lett., 14, 124043, Feyen, L.: Global changes of extreme coastal wave energy fluxes https://doi.org/10.1088/1748-9326/ab59c2, 2019. triggered by intensified teleconnection patterns, Geophys. Res. Wu, W., McInnes, K., O’grady, J., Hoeke, R., Leonard, M., and Lett., 44, 2416–2426, 2017. Westra, S.: Mapping Dependence Between Extreme Rainfall and Moftakhari, H. R., Salvadori, G., AghaKouchak, A., Sanders, B. F., Storm Surge, J. Geophys. Res.-Oceans, 123, 2461–2474, 2018. and Matthew, R. A.: Compounding effects of sea level rise and Yamazaki, D., O’Loughlin, F., Trigg, M. A., Miller, Z. F., Pavelsky, fluvial flooding, P. Natl. Acad. Sci. USA, 114, 9785–9790, 2017. T. M., and Bates, P. D.: Development of the global width database Muis, S., Verlaan, M., Winsemius, H. C., Aerts, J. C., and Ward, for large rivers, Water Resour. Res., 50, 3467–3480, 2014. P. J.: A global reanalysis of storm surges and extreme sea levels, https://doi.org/10.5194/nhess-20-1765-2020 Nat. Hazards Earth Syst. Sci., 20, 1765–1782, 2020
1782                              E. Bevacqua et al.: Difference in assessing global compound flooding based on sea level

Zscheischler, J., Westra, S., Hurk, B. J., Seneviratne, S. I.,   Zscheischler, J., Martius, O., Westra, S., Bevacqua, E., Raymond,
  Ward, P. J., Pitman, A., AghaKouchak, A., Bresch, D. N.,         C., Horton, R., van den Hurk, B., AghaKouchak, A., Jézéquel,
  Leonard, M., Wahl, T., and Zhang, X.: Future climate risk        A., Mahecha, M. D., Maraun, D., Ramos, A. M., Ridder, N.,
  from compound events, Nat. Clim. Change, 8, 469–477,             Thiery, W., and Vignotto, E.: A typology of compound weather
  https://doi.org/10.1038/s41558-018-0156-3, 2018.                 and climate events, Nat. Rev. Earth Environ., accepted, 2019.

Nat. Hazards Earth Syst. Sci., 20, 1765–1782, 2020                               https://doi.org/10.5194/nhess-20-1765-2020
You can also read