UNDERSTANDING NATURAL GAS MARKETS - American Petroleum ...
←
→
Page content transcription
If your browser does not render page correctly, please read the page content below

UNDERSTANDING NATURAL GAS MARKETS


Table of Contents

                    PREVIEW

                    Overview....................................................................... 2

                    The North American Natural Gas Marketplace................ 4

                    Natural Gas Supply........................................................ 8

                    Natural Gas Demand.................................................... 12

                    Natural Gas Exports..................................................... 15

                    How Natural Gas is Traded........................................... 16

                    Conclusion: A New Era For U.S. Natural Gas Markets.... 20

                    Glossary...................................................................... 20

                    References.................................................................. 23
Understanding Natural Gas Markets                                                                                                                                     2

Overview

Natural Gas is an Important Source                                                                                                   Production of Shale Gas
of Energy for the United States.                                                                                                        2006                                         2013
Natural gas is an attractive fuel because it is clean burning and

                                                                                                                                       5%
efficient, and ample supplies of natural gas are available from

                                                                                                                                                                               40%
domestic resources. Recently, natural gas production in the U.S.
has increased substantially due to technological advancements
in natural gas extraction methods. This increased production has
displaced traditional supply sources and resulted in reduced prices
for natural gas consumers. The prospect of ample natural gas
supplies, continued low prices, and the favorable environmental
and economic position of natural gas-fired electric generation plants                                                              As of 2013, shale gas production accounted for approximately 40%
are leading to expectations of growing U.S. demand for natural gas,                                                                of U.S. Lower 48 natural gas production, compared to about 5% in 2006.
especially in the electric and industrial sectors, and potentially for
export as liquefied natural gas1 (LNG).
                                                                                                                               for approximately 40% of U.S. Lower 48 natural gas production,
The increases in U.S. natural gas production have come from                                                                    compared to about 5% in 2006. This unexpected production growth
unconventional shale gas resources, which have become more                                                                     has led to major changes in the landscape of the U.S. natural gas industry.
accessible and economic due to advancements in horizontal drilling                                                             The important trends now affecting the industry include the following:
and hydraulic fracturing. These technological advancements have
resulted in domestic production growth that has exceeded even the                                                              •      U.S. natural gas demand is increasingly served by domestic
most optimistic forecasts of natural gas production from a decade                                                                     production from unconventional shale gas sources rather than
ago (see Figure 1). As of 2013, shale gas production accounted                                                                        imported natural gas from Canada and other conventional

                                                                                                                                                                                                     1
                                LOWER 48 DRY GAS PRODUCTION BY TYPE (Bcf/d)
                           70
                                                  AEO 2004 Forecast Reference                         AEO 2004 Forecast Rapid Tech                    AEO 2004 Forecast Slow Tech
                           60

                           50
 Volume Produced (Bcf/d)

                           40

                           30

                           20

                           10

                            0
                                   2000          2001          2002          2003          2004          2005          2006           2007      2008      2009         2010   2011     2012      2013
                                Source: 2000-2010 data from EIA AEO 2013, 2011-2013 data is from EIA AEO 2014 Early Release.
                                Unconventional Production includes Coalbed Methane, Tight Gas, and Shale Gas production.                     Conventional Production          Unconventional Production
                                Conventional Production includes Lower 48 Offshore and Lower 48 Onshore.
3
supplies. The technological advancements that have led to The shale gas revolution has led to U.S. natural gas supply growth
growing shale gas production were spurred, in part, by the high that has exceeded demand growth. As a result, Canadian imports
natural gas prices that existed during much of the last decade. and other conventional supplies have been displaced, prices have
fallen substantially and price volatility has declined to some extent
• Natural gas use for electricity generation is poised to increase (see Figure 2). The current environment is a considerable change
due to low natural gas prices and expectations that coal-fired from the tight supply-demand balance that characterized U.S.
power plants will continue to be retired due to environmental natural gas markets for much of last decade, and led to natural
regulations. Low natural gas prices are also expected to drive gas price spikes in several periods during 2000-2008. The last
demand growth in the industrial sector. large price spike in the summer of 2008 gave way to a substantial
price decline as shale gas production increased and the economic
• The growth in shale gas production has resulted in shifting recession brought on by the global financial crisis decreased the
flows on the U.S. interstate pipeline network. In particular, demand for natural gas. While demand has increased since 2009,
Marcellus shale production in Pennsylvania and West Virginia is domestic shale production has increased even faster. The result has
in relatively close proximity to the major east coast consuming been relatively low prices over the past several years, but not as low
markets. This is reducing the need for long-haul pipeline as the prices experienced during most of the 1990s.
transportation from traditional supply areas while at the same
time increasing the need for local pipeline infrastructure to This brochure examines these trends in more detail and describes
support the new production. some of the key changes that will affect U.S. natural gas markets
and prices in the coming years, including expectations for natural
• The substantial production increases, and low prices in the
gas demand growth in the electric and industrial sectors and the
U.S. relative to overseas, are leading to the development of
prospects for LNG exports from the U.S. to overseas markets.
both LNG and pipeline export projects. These projects could
result in the U.S. becoming a net exporter of natural gas2,
whereas historically the U.S. was a net importer due to its
reliance on Canadian natural gas supplies in meeting domestic
consumption.
2
NYMEX NATURAL GAS 12-MONTH AVERAGE FUTURE PRICES (April 1990-December 2013)
16
1990–1999 2000–2008 2009–2013
14
12
Future Price (US$/MMBtu)
12-Month Standard
Year
Average Deviation
10
1990–1999 $2.04 0.32
8
2000–2008 $6.45 2.45
6 2009–2013 $4.32 0.80
4
2
0
Apr-91
Apr-92
Apr-93
Apr-94
Apr-95
Apr-96
Apr-97
Apr-98
Apr-99
Apr-00
Apr-01
Apr-02
Apr-03
Apr-04
Apr-05
Apr-06
Apr-07
Apr-08
Apr-09
Apr-10
Apr-11
Apr-12
Apr-13
Source: Bloomberg.
Understanding Natural Gas Markets                                                                                                4

The North American Natural Gas                                              Storage
Marketplace                                                                 The natural gas production and delivery system is not designed to
                                                                            produce and transport the entire amount of natural gas consumers
The U.S. relies on natural gas as                                           want during periods of peak demand. In order to meet peak

an important part of its energy
                                                                            demand, large customers and distribution companies inject gas into
                                                                            underground storage located near final consumers. The stored gas is
portfolio.                                                                  withdrawn to meet consumers’ needs during times of peak demand,
                                                                            such as a cold winter day. There is also a substantial amount of
Natural gas provides 27% of the marketable energy consumed in               storage in producing areas, which allows producers to maintain
the United States.3 Oil products and coal are the other two major           constant production and helps balance supply and demand.
sources of energy. Natural gas is a valued source of energy because
it is versatile and burns cleanly. As a result, natural gas use is
commonplace in applications including cooking, residential and
commercial heating, industrial process feed stocks, and electricity
generation.

Physical Structure of the U.S.
Natural Gas Industry
Figure 3 is a schematic illustration of the physical structure of the
natural gas industry and illustrates the principal activities required to
supply gas to consumers. The primary activities are:
                                                                                Underground Storage in Salt Caverns
Exploration and Production
                                                                            Local Distribution
Exploration and production include finding and developing natural
gas by drilling wells, and ultimately producing gas from natural gas        Local distribution companies own and operate the network of
fields or gas that is produced in association with crude oil.               pipes that carry natural gas from high-pressure trunk lines to final
                                                                            consumers. These consumers include residential, commercial,
Processing                                                                  electric generation, and industrial customers, although large electric
                                                                            generators and industrial customers frequently take service directly
                                                                            from a pipeline rather than from a local distribution company.
Natural gas processing removes impurities and separates higher-
valued products (known as natural gas liquids or NGLs) that are
sold in separate markets. Processing prepares a dry gas stream
that meets industry standards for transportation in high-pressure           Liquefied Natural Gas
pipelines. Pipeline companies require that the natural gas
                                                                            Imports of LNG have never been a large part of the U.S. natural gas
provided at the inlet of their pipelines conforms to certain quality
                                                                            supply, but in the 2000’s when natural gas was perceived to be in
specifications in order for it to be transported on their systems. Only
                                                                            short supply and prices were high, LNG import quantities grew and
natural gas that meets these specifications is transported on the
                                                                            several new large-scale LNG import terminals were constructed.
extensive North American pipeline grid.
                                                                            Due to the rise in shale gas production and the fall in natural gas
                                                                            prices, many of these new import facilities have generally been
Transportation                                                              unutilized.
Natural gas is transported in high-pressure pipelines from producing
                                                                            The U.S. currently imports less than one percent of its natural gas
areas to local distribution companies, storage areas, industrial end
                                                                            in the form of LNG (compared to a peak of three percent in 2007)
users, and electricity generation facilities.
                                                                            primarily from the Everett terminal near Boston and the Elba Island
5

                                                                   PHYSICAL FLOW OF NATURAL GAS
3
          -           North                                   LNG Exports        LNG Imports
                      American
                      Producers

                                    Processors

Underground Storage

                                                                      LNG Terminals

                                                  Pipelines

                         Local Distribution Companies

Gas-Fired
Electricity
Generators

                                                                     Residential and
                                       Industrial End Users          Commercial End Users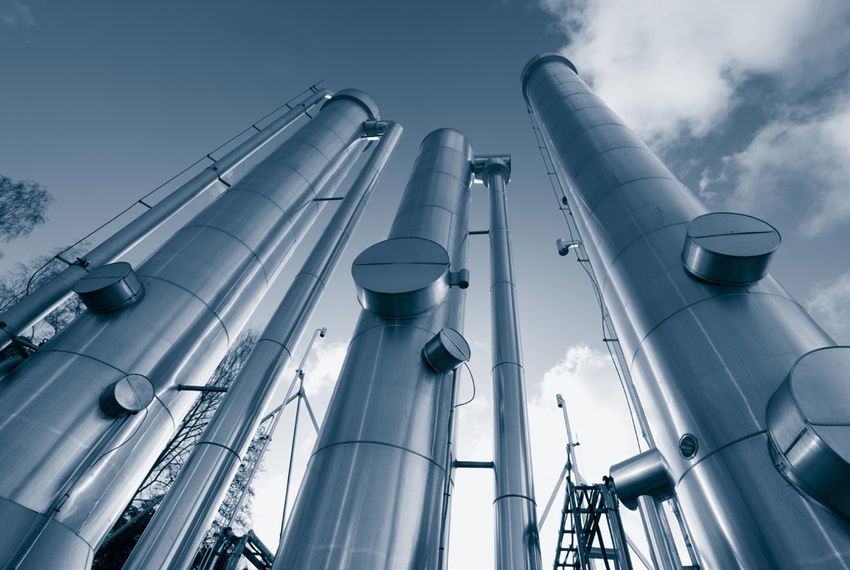
Understanding Natural Gas Markets                                                                                             6

terminal in Georgia, two of eleven existing U.S. LNG import terminals.      The growing Marcellus supplies have required substantial
The growth in shale gas production in the U.S. has resulted in              investment in new pipeline infrastructure to allow these supplies to
proposals to develop LNG export terminals to liquefy and ship natural       be delivered into the Northeast U.S. pipeline grid. At the same time,
gas produced in the U.S. to overseas markets. One such terminal             other pipelines that provided long-haul transportation of natural gas
is now under construction in Louisiana and many other liquefaction          supplies from traditional supply areas, such as Canada and the Gulf
terminals have been proposed. Some of the uncertainties regarding           Coast, have become less utilized as the region shifts to consuming
LNG export projects are discussed in a later section.                       local Marcellus natural gas production.

Figure 4 shows some of the primary areas where natural gas is
produced in the United States. As the figure indicates, natural gas
is found in a large number of states. Major onshore production
areas include the Rocky Mountains, Texas and the Gulf coast, and
Appalachia. In addition, significant but declining amounts of natural
gas are produced from offshore areas in the Gulf of Mexico.

While Figure 4 shows the major flow patterns of natural gas in the
U.S., these flow patterns have been changing and are expected
to continue to change as a result of the development of shale gas
supplies. For example, the development of substantial Marcellus
shale supplies in the Appalachian region is making the region less
dependent on long-haul flows of natural gas from Canada and the
Gulf Coast, and is likely to result in natural gas flows from the U.S.
northeast into other regions such as the U.S. Midwest and Southeast             Natural Gas Tanker
and Ontario, Canada.

     SELECTED U.S.NATURAL GAS PRODUCING REGIONS AND PIPELINE FLOWS                                                                           4

                                                   2012 Flow Levels
  5,000
  4,000
                                                   (Billion Cubic Feet)
  3,000
  2,000                                            =Direction of the Flow
  1,000
      0                                            =Bi-directional

          Source: Recreated based on graphics from EIA.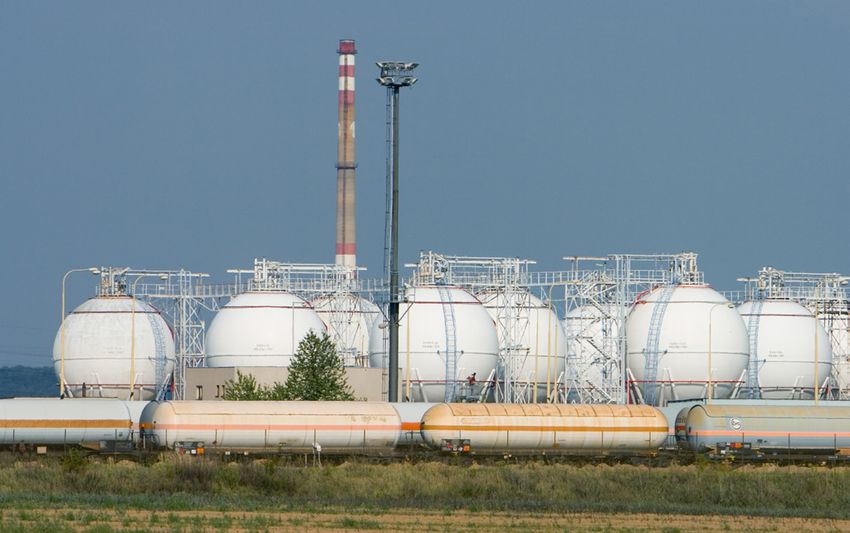
7

As shown in Figure 5, some areas are subject to access
restrictions that make some of the U.S. natural gas resource base
(approximately 96 TCF) unavailable for exploration, including
offshore areas in the lower 48 and the Alaskan Peninsula.4

Once natural gas is produced and processed, it is injected
into pipelines for transmission to end-use customers and local
distribution companies. Transmission and distribution costs are a
significant portion of the total cost of delivered natural gas. The
rates charged by both natural gas pipelines and local distribution
companies are regulated at the federal and state level.

In recent years, the cost of the natural gas itself has decreased
from 59% in 2007-2008 to 28% in 2011-2012 of the delivered
natural gas cost paid by residential consumers during the heating                            Off-Shore
season (November through March), while transmission and
distribution charges have increased from 41% to 72% of the
consumer’s average heating season cost (see Figure 6).

  OFFSHORE UNDISCOVERED TECHNICALLY RECOVERABLE FEDERAL OIL AND NATURAL GAS RESOURCES MAP                                               5

                                                      87%             of federal
                                                        offshore acreage is off
                                                                                                                        4.7 Bbl
                                                        limits to development                                           37.5 Tcf

                                                                                                         Bbl= Billion Barrels
                                                                                                         Tcf= Trillion Cubic Feet
         Source: API primer “Offshore Access to Oil and Natural Gas Resources," July 2014.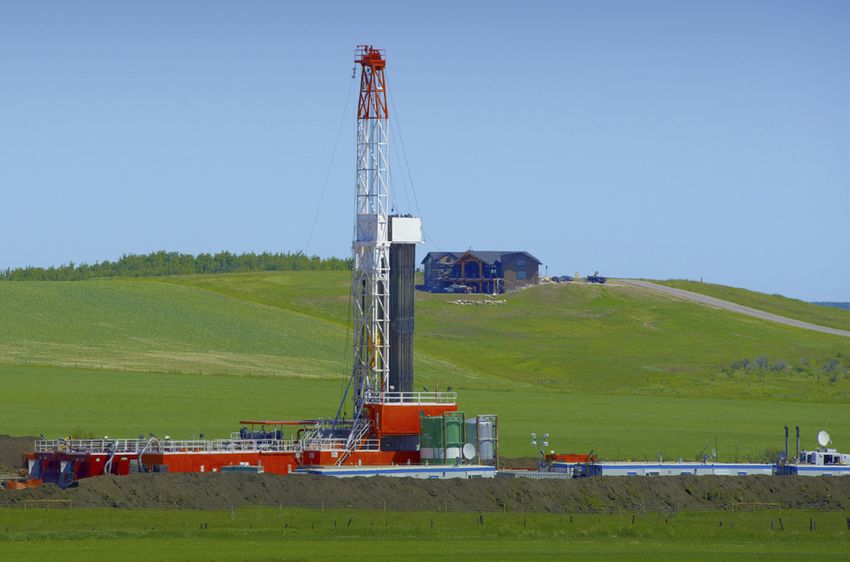
Understanding Natural Gas Markets                                                                                                                                      8

Natural Gas Supply                                                                                                                                (including shale gas and tight gas) will account for nearly 80%
                                                                                                                                                  of natural gas production in the future. Other supply sources are
The overall size of the U.S. natural gas resource base has recently                                                                               projected to decline in the coming years, with the largest reduction
been reevaluated upward, and annual natural gas production                                                                                        in conventional onshore sources not produced in association with oil.
has increased substantially, as a result of the identification and
development of shale gas supplies. Shales are fine-grained                                                                                        The technological advancements—horizontal drilling and hydraulic
sedimentary rocks that can be rich sources of petroleum and natural                                                                               fracturing—that have resulted in substantial shale gas production
gas.5 Technically recoverable natural gas resources in the U.S. have                                                                              have also changed the historical relationship between the number
been estimated at 2,431 Tcf currently, compared to 1,594 Tcf in                                                                                   of natural gas-directed drilling rigs in operation and the volume
2005,6 with much of the increase due to increased estimates in                                                                                    of natural gas production. As a result of these advancements,
the amount of shale gas resources. Likewise, annual U.S. Lower 48                                                                                 total natural gas production has continued to grow even as rigs
natural gas production increased from 48.2 Bcf/d in 2005 to 65.0
Bcf/d in 2012, or 35%, primarily as a result of the development of
natural gas from shale formations. Figure 7 shows the substantial
growth in annual shale gas production from less than 5 Bcf/d in early
2007 to nearly 30 Bcf/d more recently. Shale gas now accounts for
over 40% of total U.S. Lower 48 natural gas production. The largest
shale production is from the Marcellus (35%), Haynesville (12%),
Barnett (14%), and Eagle Ford (12%) shale formations (with all other
shales combining to total roughly 27%).

Figure 8 shows U.S. Lower 48 production of natural gas by source,
with shale gas accounting for a significantly increasing proportion
of total U.S. Lower 48 natural gas production. Shale gas production
is projected to account for over 50% of U.S. Lower 48 natural gas
production by 2040, and gas produced by hydraulic fracturing                                                                                          Processing Plant

                                                                                                                                                                                                                    6
                                                BREAKDOWN OF NATURAL GAS PRICE PAID BY RESIDENTIAL CONSUMERS DURING THE HEATING
                                                SEASON, 2007– 2012
                                        14.00

                                        12.00
 Average Heating Season Price ($/Mcf)

                                        10.00                   41%
                                                                                                         64%
                                         8.00                                                                                                      55%
                                                                                                                                                                                58%
                                                                                                                                                                                                        72%
                                         6.00

                                         4.00                  59%
                                                                                                        36%                                       45%                       42%
                                         2.00
                                                                                                                                                                                                       28%
                                           0
                                                          2007–2008                               2008–2009                                2009–2010                     2010–2011                  2011–2012
                                                Source: EIA. Heating season is defined as November - March. Transmission & Distribution Cost is
                                                calculated as the U.S.Price of Natural Gas Delivered to Residential Consumers minus the U.S.                 Natural Gas Cost         Transmission & Distribution Cost
                                                Natural Gas Wellhead Price.
9
7
MONTHLY DRY SHALE GAS PRODUCTION BY PLAY, JANUARY 2000–DECEMBER 2013 (Bcf/d)
35
30 Rest of U.S. 'shale'
Marcellus (PA & WV)
Haynesville (LA & TX)
25
Volume Produced (Bcf/d)
Eagle Ford (TX)
Fayetteville (AR)
20 Barnett (TX)
Woodford (OK)
Bakken (ND)
15 Antrim (MI, IN, & OH)
10
5
0
1/1/00 12/1/00 11/1/01 10/1/02 9/1/03 8/1/04 7/1/05 6/1/06 5/1/07 4/1/08 3/1/09 2/1/10 1/1/11 12/1/11 11/1/12 10/1/13
Source: EIA - Natural gas Weekly Update for week ending January 29, 2014.
8
LOWER 48 DRY NATURAL GAS PRODUCTION
2011
120
Historical Projections
Shale gas (Unconventional)
100
Tight gas (Unconventional)
Non-associated offshore (Conventional)
Coalbed methane (Unconventional)
80 Associated with oil (Conventional)
Non-associated onshore other (Conventional)
Volume (Bcf/d)
54%
60
35%
40
26%
23%
7%
20 8% 6%
9% 5%
7%
16% 4%
0
1990 1995 2000 2005 2010 2015 2020 2025 2030 2035 2040
Source: 1990-2011 data from EIA AEO 2013, 2012-2040 data from EIA AEO 2014 Early Release. The percentages above are calculated as the percent of total Lower 48 natural gas production.
Percentages may not equal 100% due to rounding.Understanding Natural Gas Markets 10
increasingly have been directed towards oil drilling and away from from overseas locations. With the growth in domestic shale gas
natural gas (see Figure 9). Moreover, an increasing number of supplies, imports have been declining and forecasts indicate that the
wells are producing both oil and natural gas.7 These changes are U.S. will become a net exporter of natural gas later this decade.
leading to new metrics for evaluating drilling and production activity,
including region-specific statistics regarding rig efficiency, new well These exports will likely include pipeline exports to Mexico, and
productivity, and decline rates of existing wells.8 exports in the form of LNG. Net imports from Canada are likely
to continue, but at substantially lower levels than in the past
An important factor that affects drilling activity in the U.S. is the price (see Figure 12).
of natural gas liquids (NGLs) that are produced in some areas as a
byproduct of natural gas production. NGLs include products such
as ethane, propane, butane, and isobutane, and natural gasoline
or condensate. These areas may be referred to as “liquids rich” or
“wet gas” plays. NGLs are removed from the natural gas stream at
natural gas processing and fractionation plants and sold separately.
High NGL prices (which typically have followed the trends in oil
rather than natural gas prices) make it profitable to separate NGLs
from natural gas and sell them as a separate product. Recent NGL
prices have been high relative to natural gas prices (see Figure 10),
which has provided a strong incentive for producers to shift their
focus from dry gas plays to liquids-rich gas plays. The additional
natural gas produced in highly-profitable liquids-rich plays has
helped keep the price of natural gas low.
Figure 11 shows the changing nature of the U.S. natural gas supply
mix. Historically, U.S. natural gas consumption exceeded production,
and the difference was made up by natural gas imports by pipeline Driling Rig
from Canada as well as a relatively small amount of LNG imports
9
U.S. NATURAL GAS PRODUCTION AND COUNT OF OPERATING NATURAL GAS RIGS
JANUARY 2006–OCTOBER 2013
70 3,000
65 2,500
60 2,000
Production (Bcf/d)
Rig Count
55 1,500
50 1,000
45 500
0 0
Jan-06 Sep-06 May-07 Jan-08 Sep-08 May-09 Jan-10 Sep-10 May-11 Jan-12 Sep-12 May-13
Source: EIA. Natural Gas Rig Count Crude Oil Rig Count Dry Production (bcf/d)11
HENRY HUB NATURAL GAS PRICE VS. NGL COMPOSITE PRICE, JANUARY 2009-OCTOBER 2013 10
18
16
14
12
NGL Composite Price
10
$/MMBtu
8
6
Henry Hub Natural Gas Price
4
2
0
Jan-09 Jun-09 Nov-09 Apr-10 Sep-10 Feb-11 Jul-11 Dec-11 May-12 Oct-12 Mar-13 Aug-13
Source: EIA. The composite price is calculated by EIA as daily Bloomberg spot price data for natural gas liquids at Mont Belvieu, Texas, weighted by gas processing plant production volumes of each product as
reported on Form EIA-816,"Monthly Natural Gas Liquids Report."
11
TOTAL U.S. GAS PRODUCTION, CONSUMPTION, AND NET IMPORTS
Historical 2011 Projections
120
Total Production
100
80
Total Consumption
Volume (Bcf/d)
60
40
20
0
-20
Net Imports
-40
1990 1993 1996 1999 2002 2005 2008 2011 2014 2017 2020 2023 2026 2029 2032 2035 2038
Source: 1990–2011 data from EIA AEO 2013, 2012–2040 data from EIA AEO 2014 Early Release.Understanding Natural Gas Markets 12
Natural Gas Demand competes to serve load in many regions of the country, and the
relative prices for coal and natural gas can affect the dispatch order
Recent declines in natural gas prices are also explained by the fact of electric generation facilities, and hence, electric sector demand
that the demand for natural gas has not grown as rapidly as the for natural gas.
growth in supplies.
More than 65 million U.S. households use natural gas for water
Figure 13 shows the consumption of natural gas by sector since heating, space heating, or cooking.9 In total, natural gas accounts
2000. As shown, overall consumption was flat or declining between for more than 50% of the fuel used to heat U.S. homes.10 Residential
2000 and 2006, with some demand growth occurring in the and commercial heating demand for natural gas is highly weather-
2007-2013 period. Residential and commercial use of natural sensitive, making weather the biggest driver of natural gas demand
gas has been relatively steady over the 2000-2013 period, with in the short term. As a result, natural gas demand is highly
growth in the number of customers being offset by declining natural “seasonal” in nature, with significant “peaks” in the winter heating
gas usage per customer. Industrial natural gas demand generally season, as illustrated in Figure 14. Natural gas pipelines and
declined during the 2000-2009 period in response to high and distribution companies must plan to meet customers’ needs during
volatile gas prices, while natural gas demand for power generation the peak demand periods. The seasonal nature of heating demand
increased during this period, offsetting the declines in industrial can cause the price of natural gas to vary widely at different times of
demand. Since 2009, gas demand has grown in both the industrial the year.
and electric sectors. In aggregate since 2000, demand growth has
been outpaced by the volume of new natural gas production that has As described below, the natural gas production and transmission
come on line. system is not designed to fully satisfy demand during peak periods.
In order to meet high seasonal winter demand for natural gas, a
In 2012, natural gas use for power generation surged as a result significant amount (ten percent or more of our annual consumption)
of low natural gas prices. Low prices caused natural gas-fired is put into storage during periods of warm weather and lower
electricity generating facilities to run more often and in some cases demand. Figure 14 shows the pattern of natural gas production
ahead of coal-fired plants. Coal and natural gas-fired generation and storage. The relatively flat light blue line shows natural gas
U.S. NET IMPORTS OF NATURAL GAS BY SOURCE 12
Historical 2011 Projections
12
10
8
6
4
Volume (Bcf/d)
Canada
2
0
-2
-4
-6 Mexico
-8
Liquefied Natural Gas
-10
1990 1995 2000 2005 2010 2015 2020 2025 2030 2035 2040
Source: 1990–2011 data from EIA AEO 2013, 2012–2040 data from EIA AEO 2014 Early Release.13
13
U.S. GAS DEMAND Residential Commercial Industrial Electric Power Other
80
2013 Projected Total Gas Demand = 71.2
70
6.0
60 4.9
22.3
50 14.3
Bcf/d
40
22.3 20.4
30
20
8.7 9.0
10
13.7 13.6
0
2000 2001 2002 2003 2004 2005 2006 2007 2008 2009 2010 2011 2012 2013
Source: EIA. 2013 data from EIA's January 2014 Short Term Energy Outlook.
14
U.S. NATURAL GAS STORAGE ACTIVITY, JANUARY 2008-DECEMBER 2013
100
90
80
70
60
Volume (Bcf/d)
50
40
30
Total Natural Gas Consumption Natural Gas Production Plus Net Imports
20
10
0
Jul-011
Jan-08
Jan-09
Jan-10
Jan-11
Jan-12
Jan-13
Oct-08
Oct-09
Oct-10
Oct-11
Oct-12
Oct-13
Apr-08
Apr-09
Apr-10
Apr-11
Apr-12
Apr-13
Jul-08
Jul-09
Jul-10
Jul-12
Jul-13
Source: EIA. November and December 2013 data from the EIA STEO January 2014 report.
Net imports is calculated as imports minus exports.Understanding Natural Gas Markets 14
production and imports into the United States. The figure shows The low natural gas prices are leading many analysts to believe that
production remains essentially flat throughout the year, but, as there will be substantial natural gas demand growth in the future,
the darker blue line shows, consumption rises dramatically in especially in the electric and industrial sectors (see Figure 15).
the winter and falls in the spring through the early fall. On the electric side, the combination of low natural gas prices and
emerging environmental regulations is leading to the retirement
Heating demand for natural gas puts upward pressure on natural of a significant amount of coal-fired generation capacity. Many
gas prices during winter which serves to compensate those who retirements have been announced and additional retirements are
place gas in storage during lower-price, off-peak periods. Regulated expected. Natural gas-fired generation is expected to replace a
local distribution companies, however, will place gas in storage for significant portion of the lost coal-fired generation, thus leading to
peak demand independent of prices because they are responsible expectations of increasing natural gas demand in the electric sector.
for providing reliable natural gas service to their customers. The natural gas demand growth could be particularly strong in the
Thus, natural gas inventory levels are driven, in part, by the Midwest and Southeast U.S., given the large amount of coal-fired
reliability obligation of local distribution companies in addition to generation capacity and the potential for significant retirements in
market factors. those regions. Of course, intermittent renewable energy sources
may also replace some of the lost coal-fired generation when those
Despite the storage of natural gas and the industry’s recognition renewable sources are available and operating, so the overall growth
that demand will rise in the winter months, winter natural gas prices in electric sector natural gas demand resulting from coal plant
can fluctuate quite dramatically with changes in weather and the retirements is uncertain and will ultimately depend on the future
amount of natural gas in storage. The reasons for this price volatility electricity generation mix. On the industrial side, the low natural
are straight- forward. For example, if storage levels appear to be low gas prices are also causing a resurgence in industrial activity that
in autumn, there will be concern that it will be difficult to meet peak may lead to increased natural gas demand. For example, methanol
demands throughout the winter, and traders may be willing to pay and fertilizer plants use substantial quantities of natural gas as a
more to secure natural gas volumes for winter month deliveries. feedstock, and low natural gas prices have resulted in proposals to
This results in upward pressure on market prices. In contrast, build many more of these facilities (particularly in the Gulf Coast).
warmer than expected weather can lead to high levels of storage
inventory throughout the winter, and natural gas prices may decline
in response to the ample supplies.
15
NATURAL GAS DEMAND FOR INDUSTRIAL AND ELECTRIC POWER SECTORS
Historical 2011 Projections
35
30
25
Volume (Bcf/d)
20
15
Industrial Electric Power
10
5
0
1997 2002 2007 2012 2017 2022 2027 2032 2037
Source: 1997–2011 data for industrial natural gas demand from EIA. 1997–2011 data for electric sector gas demand from EIA AEO 2013. 2012–2040 data from EIA AEO 2014 Early Release.15
Natural Gas Exports Coast, and West Coast of the United States, as well as in Alaska
and British Columbia. How many of these projects advance to the
construction phase is uncertain due to uncertainty in how much
Low natural gas prices in North LNG demand there will be from overseas countries, and competition
America are leading to proposals from other sources of LNG to serve the demand (such as Australia,
where several LNG terminals are already under construction). In
for the development of large LNG addition, these projects require substantial capital investment
export projects.
(running into the tens of billions of dollars), and so project sponsors
require long-term contracts before proceeding to construction to
ensure they recover their investment and a reasonable rate of return.
These projects would liquefy natural gas supplies produced in These projects also require approval from regulatory bodies, such
North America so that they could be transported overseas by ship as the Department of Energy and the Federal Energy Regulatory
and sold to countries that do not have sufficient supplies from Commission in the United States, and the National Energy Board in
local production or via pipeline imports to meet their natural gas Canada. In addition, some projects also face certain infrastructure
requirements. LNG is already imported by some Asian countries, challenges that may put them at a disadvantage, such as the British
such as Japan, South Korea, China, and India. The prices these Columbia, Alaska, and U.S. West Coast projects that are at some
countries pay for LNG has historically been linked to oil prices, and distance from natural gas supplies and therefore require large
therefore LNG supplies have been relatively expensive. Figure 16 pipelines to be constructed, in some cases over difficult terrain.
shows the relationship between U.S. natural gas prices at Henry Hub
and oil prices as measured by the Brent benchmark world oil price. Aside from these LNG projects, it is expected that the U.S. also will
Starting around 2009, U.S. natural gas prices began to disconnect export natural gas to Mexico and Canada. The U.S. already exports
substantially from oil prices as a result of the increase in shale gas natural gas to Mexico, and pipeline expansion projects will result in
production. This significant oil-gas price differential is ultimately an increasing amount of exports to Mexico in the coming years. The
what is driving many of the proposals for LNG export projects that U.S. has historically been an importer of natural gas from Canada,
have been announced in the past few years. especially into the western and Midwest U.S., but has also recently
started to export some supplies to Ontario, Canada as a result of
LNG export projects have been announced on the Gulf Coast, East growing supplies in the Marcellus.
16
NYMEX PROMPT MONTH PRICES, CRUDE OIL VS. NATURAL GAS, JANUARY 1994–DECEMBER 2013
30
25
Crude Oil
20
Prompt Month Prices
($/MMBtu)
15
10
Natural Gas
5
0
Jan-00 Jan-01 Jan-02 Jan-03 Jan-04 Jan-05 Jan-06 Jan-07 Jan-08 Jan-09 Jan-10 Jan-11 Jan-12 Jan-13
Source: NYMEX data downloaded from EIA and Bloomberg. The crude oil prices are for Brent Crude, 1-Month Forward Contracts.Understanding Natural Gas Markets 16
How Natural Gas is Traded There are many different types of buyers and sellers who are
motivated to buy and sell gas under different types of commercial
Figure 17 shows schematically some of the types of natural gas arrangements. As a result, gas is sold on a spot market basis, under
transactions that take place as gas makes its way from the fields longer-term contracts with fixed pricing or terms that track market
where it is produced to end users’ burner tips. The natural gas prices, and under contracts with other types of pricing provisions.
industry in the United States is highly competitive, with literally Marketers are able to meet customers’ differing needs by bringing
thousands of producers.11 Some producers have the ability to together a large number of buyers and sellers. In addition, marketers
market their natural gas and may sell it directly to local distribution and other buyers and sellers of natural gas are able to use financial
companies or to large industrial buyers of natural gas. instruments traded on exchanges to hedge the risks associated with
(Some of these large industrial buyers are “on-system” end users, price volatility.
meaning that they receive physical natural gas deliveries from a
local distribution company. Others are “off-system” end users, Note that pipeline companies do not buy and sell natural gas. Most
meaning they are directly connected to an interstate pipeline.) of the major natural gas pipelines are federally regulated interstate
Other producers sell their gas to marketers who have the ability to pipelines. These pipelines are limited to providing transportation
aggregate natural gas into quantities that fit the needs of different services, including storage.12 Thus, pipelines move gas at
types of buyers and to transport gas to their buyers. Marketers government-regulated rates on behalf of buyers and sellers,
may be large or small and sell to local distribution companies or to but do not participate in the buying and selling of natural gas.
commercial or industrial customers connected directly to pipelines or
served by local distribution companies. The domestic natural gas marketplace has a highly active spot
market where brokers and others buy and sell natural gas.
Most residential and commercial customers purchase natural gas Figure 18 shows some of the points where natural gas for
from a local distribution company. In contrast, many industrial physical delivery is actively traded in the continental United States
customers have the option to purchase natural gas from a marketer and Canada. Many of these locations are segments of individual
or producer instead of from the distribution company. pipelines or locations where pipelines interconnect with other
pipelines or local distribution companies. Brokers trade natural gas
at these locations and prices
COMMERCIAL AND FINANCIAL ARRANGMENTS
17
Local Distribution Companies
On-System Users
Producers
Marketers
Off-System End Users17
are established, although there are varying degrees of trading Market participants buy and sell natural gas on a “spot” basis every
activity at these different locations. day at the trading points shown in Figure 18, as well as at dozens
of other points. Spot market transactions are normally conducted
The benchmark price for North American natural gas is the Henry over the internet or by telephone, with the buyer agreeing to pay a
Hub, located in southern Louisiana. The Henry Hub is interconnected negotiated price for the natural gas to be delivered by the seller at a
with 13 different intra- and interstate pipelines. Because of its specified delivery point. Natural gas spot prices reflect daily supply
central location and its high degree of interconnectedness, the and demand balances and can be volatile.
Henry Hub is used as the delivery point for the New York Mercantile
Exchange’s (NYMEX) natural gas futures contract. While Henry Hub In addition to daily spot transactions, monthly spot transactions
has served as the pricing reference point for virtually the entire North are often entered during “bid week,” the last five business days
American natural gas market, other locations have also become of a month. During bid week, buyers and sellers arrange for
important market trading points, such as Alberta, Canada, Chicago the purchase and sale of physical natural gas to be delivered
Citygate, and Dawn, Ontario, with some of these locations having an throughout the coming month, including making delivery
even larger number of spot market transactions than Henry Hub. arrangements with pipelines.
Many customers purchase natural gas under longer-term contracts
that provide for delivery of gas for a specified period of time.
The length of time can vary. Frequently the prices in longer-term
contracts are not fixed, but are instead indexed to prices that
are regularly published in the trade press. A number of trade
publications publish index prices based on their surveys of natural
gas buyers and sellers to determine the prices they pay (or receive)
for natural gas (at market locations such as those shown in
Figure 18) in daily or monthly transactions.
THE TOP 25 NORTH AMERICAN GAS TRADING LOCATIONS
Alberta- AECO 18
Emerson Viking
PG&E Malin
Dawn
MichCon Citygate
Kern River Opal
PG&E Citygate Chicago Citygate
Dominion
South Transco, Z6NY
Point
Columbin Gas, App. Tx Eastern M3
NGPL Midcontinent
SoCal Gas EI Paso San Juan
Panhandle
TX-Okla
Columbia Gulf
SoCal Gas Citygate El Paso Permian
Mainline
Transco, Z4
Waha
NGPL Texok Zone
Transco, Z3
Katy
Henry Hub
NOTE: Transaction volume data from Platts Gas Daily used to identify the top 25 trading locations.Understanding Natural Gas Markets 18
Futures and Other Financial The futures market for natural gas has grown rapidly from its
inception in 1990. Figure 19 shows the number of natural gas
Contracts contracts traded on the NYMEX each year between 1990 and 2013.
This market is made up of a large number of buyers and sellers, as
In addition to the contracts for physical supply described previously, well as different types of buyers and sellers. Parties with commercial
natural gas derivatives are traded on the New York Mercantile interests frequently use futures contracts to reduce their exposure
Exchange. A NYMEX natural gas futures contract requires the to price risk by locking in the price they will pay (or receive) for
seller to deliver (and the buyer to take delivery of) natural gas at the natural gas to be delivered in some future month. For example, a
contractually agreed price, in a specified future month, at the Henry natural gas producer who expects to produce and sell natural gas
Hub.13 The price to be paid for delivery in the future month when each month for the next several years can use the NYMEX futures
the futures contract matures is determined at the time the contract contract to lock in the price that the producer will receive for that
is sold. As expectations about the value of natural gas at the time of gas. Likewise, a local distribution company buyer of natural gas may
delivery change, the value of the futures contract will change as well.14 buy NYMEX futures contracts to reduce price risk on behalf of its
residential and commercial customers.
Derivatives such as the NYMEX futures contract make it possible
for market participants to reduce the risk that results from highly In addition, the market includes parties who are not commercial
volatile natural gas prices in the physical market. For example, a entities seeking to hedge their exposure to price risk. These non-
manufacturing facility that uses natural gas may face highly volatile commercial traders may include investment banks, hedge funds and
cash flows as a result of dramatic fluctuations in natural gas prices other commodity investors who hold natural gas futures contracts
from month to month and day to day. To reduce these risks, the as part of a diversified investment portfolio, or who buy and sell
facility can purchase physical natural gas using contracts that futures contracts in response to contract prices, seeking to make
reference or are indexed to spot market prices and, in addition, a return for bearing risk. While the role of non-commercial traders
purchase financial derivatives that rise in value when gas prices rise in futures markets has been a controversial subject at times, it is
and fall in value when gas prices fall. The result is that when prices clear that these non-commercial participants play an important role
are high, the value of the derivatives will rise to offset the additional in helping commodity markets function efficiently. They serve as
cost of gas, and vice versa. counterparties to commercial hedgers in futures markets, providing
liquidity that assures the commercial parties will not incur excessive
NATURAL GAS FUTURES CONTRACTS TRADED BY YEAR, 1990–2013 19
100
90
80
70
Millions of Contracts Traded
60
50
40
30
20
10
0
1990 1992 1992 1993 1994 1995 1996 1997 1998 1999 2000 2001 2002 2003 2004 2005 2006 2007 2008 2009 2010 2011 2012 2013
Source: Bloomberg. Annual volumes for 1990 begin in April.19
costs to effectively manage their risks. The market benefits from the summer period. More recently, as larger quantities of shale
the activity of all types of traders because—by bringing different production have come on line, market participants expected lower
perspectives—they help ensure that market prices reflect all of the prices to prevail that have less of a winter peak than was the case
information available about current and future supply and demand historically.
conditions.
In addition to exchange-traded natural gas futures contracts, natural
Futures markets also provide valuable information about gas derivative contracts are also traded in over-the-counter (OTC)
expectations for supply and demand conditions in the physical markets. The bilateral trading that occurs in OTC markets includes
market that will determine the price for gas scheduled for delivery forward contracts and swaps, which are generally non-standardized
on a specified future date. For example, if in 2014 the price contracts that can be tailored to the specific needs of the
of a futures contract for the delivery of gas in April 2015 is $4 counterparties involved in the transaction. The OTC markets where
per MMBtu, this represents thousands of buyers’ and sellers’ such transactions occur were previously largely unregulated.
expectations of what the price of gas will be for physical delivery in
April 2015.15 This price discovery function is beneficial because it In response to the 2008 financial crisis, the Dodd-Frank Wall
provides market information to those who can best respond by, for Street Reform and Consumer Protection Act (“Dodd-Frank”) was
example, putting additional gas in storage or taking steps to switch enacted into law on July 21, 2010, making sweeping changes to
to a different fuel. the regulation of U.S. financial markets. Dodd-Frank was aimed at
reducing risk in the financial system, improving the transparency and
Figure 20 shows some of the recent movement in natural gas efficiency of financial markets, and increasing regulatory oversight.
futures prices at different points in time over the past few years. Dodd-Frank is heavily focused on financial institutions and systems,
Each line in the figure shows prices for natural gas to be delivered in but also affects non-financial institutions including participants
each of the next 36 months. As shown, there has been substantial in the natural gas industry that trade natural gas derivative
volatility in natural gas futures prices in the recent past as the contracts. While some of the specific regulatory rules are still under
market’s perception of natural gas market conditions changed development, Dodd-Frank will affect the natural gas industry with
over time. In June 2008, before shale supplies started coming on rules regarding swaps trading and associated clearing and margin
line in substantial quantities, the market was expecting relatively requirements, position limits, and reporting requirements.
high prices with significant peaks during the winter period versus
NYMEX HENRY HUB MONTHLY FUTURES PRICES (June 2008–December 2013) 20
14.00
14.00
12.00
12.00
10.00
10.00
June-2008
Price ($/MMBtu)
8.00
8.00
December-2009
6.00
6.00
December-2011
December-2013
4.00
4.00
2.00
2.00
00
Jun-08 Jun-10 Jun-12 Jun-14 Jun-16 Jun-18
Source: Bloomberg. Forward curves are based on the first trading day of the given month.Understanding Natural Gas Markets 20
Conclusion: A New Era For U.S. Bilateral Trading
Natural Gas Markets Bilateral or OTC transactions between two parties are not cleared
in exchanges. These transactions can occur through direct contact
The U.S. natural gas industry has and negotiation, through a voice broker or through an electronic
changed dramatically
brokerage platform, such as the Intercontinental Exchange (ICE).
The deals can range from standardized contract packages, such as
those traded on ICE, to customized, complex contracts known as
as a result of technological advancements that have resulted in structured transactions.
increasing domestic production, especially from shale resources.
These new supplies of natural gas have resulted in lower prices
and reduced price volatility, and expectations of increasing demand.
Natural gas use for electricity generation is expected to grow, in
British Thermal Unit (Btu)
part due to the expected retirement of some coal-fired generation A British Thermal Unit (Btu) is the amount of energy required to raise
capacity. Industrial consumption of natural gas is also expected to the temperature of one pound of water by one degree Fahrenheit.
increase due to a resurgence of petrochemical plants, especially This is the most common unit used for buying and selling natural
in the U.S. Gulf Coast. Low domestic prices relative to the prices gas. Average annual natural gas usage per customer in the U.S.
available in world markets are also leading to proposals to export is roughly 60 MMBtu.
natural gas as LNG. The emergence of shale gas in abundance has
profoundly changed the market for natural gas in the U.S. in recent
years, and perhaps for the foreseeable future. Broker
A broker is an intermediary that arranges transactions between a
buyer and a seller for a commission when the deal is executed.
Glossary
Associated Natural Gas Coalbed Methane
Natural gas that occurs in crude oil reservoirs either as free gas Coalbed methane is natural gas contained in coal deposits. Typical
(associated) or as gas in solution with crude oil (dissolved gas). recovery entails pumping water out of the coal to allow the gas to
Natural that is not in contact with significant quantities of crude oil escape.
in the reservoir is referred to as non-associated natural gas.
Cubic Foot (cf)
A cubic foot (cf) is a standard measure of natural gas, equal to
the amount of natural gas contained at standard temperature and
pressure (60 degrees Fahrenheit and 14.73 pounds standard per
square inch) in a cube whose edges are one foot long. There are
1,031 Btu in a cubic foot of natural gas. MMCF (million cubic feet),
BCF (billion cubic feet) and TCF (trillion cubic feet) are common
abbreviations used in the natural gas industry.
Deep Gas
Deep gas is natural gas found at depths greater than the average
Processing Plant
for a particular area; for FERC purposes, it is gas found at depths
of more than 15,000 feet.21
Drilling Rig Dry Gas
A machine which creates holes in the ground, used to drill oil and Dry gas is natural gas which remains after: 1) the liquefiable
gas wells. Usually, the drilling rig is moved off of the well once the hydrocarbon portion has been removed from the gas stream (i.e.,
well has been drilled so that it can be used to drill another well. gas after lease, field, and/or plant separation); and 2) any volumes
of non-hydrocarbon gases have been removed where they occur in
sufficient quantity to render the gas unmarketable. Note: Dry natural
gas is also known as consumer-grade natural gas. The parameters
for measurement are cubic feet at 60 degrees Fahrenheit and 14.73
pounds per square inch absolute.
Dry Wells
Dry wells are exploratory or development wells found to be incapable
of producing either oil or gas in sufficient quantities to justify
completion as an oil or gas well.
Driling Rig
Futures Contract
A futures contract is a binding, legal agreement between a buyer
and a seller for delivery of a particular quantity of a commodity at
a specified time, place, and price. These contracts are traded on
Deepwater regulated exchanges and are settled daily based on their current
value in the marketplace. Most natural gas futures contracts traded
on the New York Mercantile Exchange (NYMEX) end without actual
Deepwater natural gas is natural gas located in the Gulf of Mexico
physical delivery of the commodity. Futures contracts most often
in waters at least 200 meters (656 feet) deep.
are liquidated or cancelled out by purchasing a covering position
prior to the delivery date and are generally used as a financial risk
management and investment tool rather than for supply purposes.
Horizontal Drilling
Horizontal drilling is a drilling methodology where wells are turned
horizontally at certain depth. It is normally used to extract energy
from a source that runs horizontally, such as a layer of shale rock.
Deepwater Driling
Drilling Rig MachineryUnderstanding Natural Gas Markets 22
Hydraulic Fracturing market is more likely to develop at a location with numerous pipeline
interconnections, thus allowing for a large number of buyers and
Hydraulic Fracturing is the propagation of fractures in a rock layer, as sellers. The Henry Hub in southern Louisiana is the best-known
a result of the action utilizing a pressurized fluid, chemical additives, spot market for natural gas.
physical proppants, or a combination thereof, to release petroleum,
Swaps
natural gas, or other substances to be extracted. Hydraulic
fracturing along with horizontal drilling is utilized to produce
hydrocarbons from shales.
Swaps are financial or physical transactions in which two parties
agree to exchange different cash flow streams or physical gas
Liquefied Natural Gas (LNG) products. For example, in a fixed price swap, the swap buyer
agrees to pay the swap seller a fixed price (e.g., $4.00/MMBtu) and
Liquefied natural gas (LNG) is natural gas that has been liquefied by the swap seller agrees to pay the buyer an index price (e.g., the
reducing its temperature to -260 degrees Fahrenheit at atmospheric Southern California index price). In a basis swap, the swap buyer
pressure. This liquefaction process reduces the volume of the gas by agrees to pay the seller the NYMEX Henry Hub price plus or minus
approximately 600 times from its original size. a fixed amount (e.g., +$0.25/MMBtu) and the swap seller agrees to
pay the buyer an index price (e.g., the PG&E Citygate index price). In
a physical swap transaction, gas at one location is traded for gas at
Methanol another location.
Methanol is used in a wide range of products, including paints and
glue. Methanol plants use natural gas as a feedstock. Technically Recoverable
Technically recoverable resources are those that are producible
Natural Gas Liquids using current technology without reference to the economic viability
thereof.
Natural gas extracted out of a well may be comingled with other
hydrocarbons. These hydrocarbons that are in liquid form are
separated from natural gas and are referred to as natural gas liquids. Unconventional Gas
NGLs are used as inputs for petrochemical plants, burned for space
heat and cooking, and blended into vehicle fuel. Unconventional gas refers to natural gas extracted from coalbeds
(coalbed methane) and from low-permeability sandstone and shale
formations (respectively, tight sands and gas shales). Unconventional
Over-the-Counter (OTC) gas has become an increasingly important component of total U.S.
domestic production over the past decade.
Over-the-counter (OTC) transactions are transactions that are not
cleared on an organized exchange.
Shale Gas
Shale gas is natural gas that is trapped within fine-grained
sedimentary rock formations. Shale gas has recently become a
major source of domestic natural gas production.
Spot Market
The natural gas spot market is a market in which natural gas is
bought and sold for immediate or very near-term delivery, usually
for a period of 30 days or less. The transaction does not imply a
continuing arrangement between the buyer and the seller. A spot Natural GasReferences 23
1. Italicized words appear in the glossary. 11. As noted previously, federal and state agencies regulate the
2. See “Annual Energy Outlook-2014 Early Release Overview,” p. prices charged by most natural gas pipelines and local distribution
13. EIA notes that, in its reference case, the U.S. is predicted to companies for the transmission and distribution services they
become a net exporter of LNG in 2016 and an overall net exporter provide. The price of the natural gas commodity itself has not been
of natural gas in 2018. regulated since 1993.
3. Energy Information Administration, http://www.eia.gov/totalenergy/ 12. Prior to the federal restructuring of regulation of the interstate
data/annual/index.cfm#summary natural gas pipeline system, natural gas pipelines purchased gas
from producers and sold it to the customers connected to the
4. See API primer “Offshore Access to Oil and Natural Gas pipeline. This system was inefficient because it severely limited
Resources,” July 2014. the number of buyers for natural gas and kept the market from
5. See Energy Information Administration, Energy in Brief, “What is operating competitively. These regulations were part of the overall
shale gas and why is it important?,” http://www.eia.gov/energy_ regulation of the natural gas industry that was dramatically altered
in_brief/article/about_shale_gas.cfm beginning in the late 1970s through the mid-1980s.
6. EIA, “Technically Recoverable Shale Oil and Shale Gas Resources: 13. The NYMEX natural gas futures contract stipulates the purchase
An Assessment of 137 Shale Formations in 41 Countries Outside and sale of 10,000 MMBtu of natural gas at the Henry Hub
the United States,” June 2013. Also see EIA presentation “Annual trading point in Louisiana in the delivery month.
Energy Outlook 2012 Early Release Reference Case,” January 23, 14. Other NYMEX-traded natural gas derivatives include options
2012, slide 10. contracts, calendar spread options, and basis swap futures
7. “EIA Drilling Productivity Report,” presentation by EIA Administrator contracts. In addition to the derivatives available on NYMEX,
to Columbia University Center on Global Energy Policy, October 29, market participants trade other derivatives in over-the-counter
2013. (OTC) markets.
8. See “EIA to release new Drilling Productivity Report,” October 21, 15. The academic literature discusses whether there are risk
2013 at http://www.eia.gov/todayinenergy/detail.cfm?id=13451. premiums in futures prices that affect the relationship between
futures prices and expected future spot prices, a subject that is
9. See Facts about Natural Gas 2013, American Gas Association
beyond the scope of our discussion here.
(AGA) at http://www.aga.org/Newsroom/factsheets/Documents/
Facts%20About%20Natural%20Gas%202013.pdf
10. According to the U.S. Census Bureau’s 2011 American Housing
Survey, natural gas is used as the main heating fuel in 57 million
homes out of total of 114 million housing units using heating fuel,
or roughly 50% of households.Acknowledgement Conclusion A New Era For U.S. Natural Gas Market 24 This report was prepared for the American Petroleum Institute. All results and any errors are the responsibility of the authors and do not represent the opinion of The Brattle Group, Inc. or its clients. We acknowledge the research and analytical contributions of Evan Klein and Joy Nkosi. PRINCIPAL AUTHORS Steven Levine Paul Carpenter Anul Thapa PREPARED FOR American Petroleum Institute
Copyright 2014 – American Petroleum Institute, all rights reserved. Digital Media | 2014-095 | 06.14
You can also read