Usage-based Summaries of Learning Videos
←
→
Page content transcription
If your browser does not render page correctly, please read the page content below
Usage-based Summaries of Learning Videos?

                                             Hyowon Lee[0000−0003−4395−7702] , Mingming Liu[0000−0002−8988−2104] ,
                                         Michael Scriney[0000−0001−6813−2630] , and Alan F. Smeaton[0000−0003−1028−8389]

                                               Insight Centre for Data Analytics, Dublin City University, Dublin 9, Ireland
                                                                         Alan.Smeaton@dcu.ie
arXiv:2106.13504v1 [cs.MM] 25 Jun 2021

                                                 Abstract. Much of the delivery of University education is now by syn-
                                                 chronous or asynchronous video. For students, one of the challenges is
                                                 managing the sheer volume of such video material as video presentations
                                                 of taught material are difficult to abbreviate and summarise because
                                                 they do not have highlights which stand out. Apart from video book-
                                                 marks there are no tools available to determine which parts of video
                                                 content should be replayed at revision time or just before examinations.
                                                 We have developed and deployed a digital library for managing video
                                                 learning material which has many dozens of hours of short-form video
                                                 content from a range of taught courses for hundreds of students at un-
                                                 dergraduate level. Through a web browser we allow students to access
                                                 and play these videos and we log their anonymised playback usage. From
                                                 these logs we score to each segment of each video based on the amount
                                                 of playback it receives from across all students, whether the segment has
                                                 been re-wound and re-played in the same student session, whether the
                                                 on-screen window is the window in focus on the student’s desktop/laptop,
                                                 and speed of playback. We also incorporate negative scoring if a video
                                                 segment is skipped or fast-forward, and overarching all this we include
                                                 a decay function based on recency of playback, so the most recent days
                                                 of playback contribute more to the video segment scores. For each video
                                                 in the library we present a usage-based graph which allows students to
                                                 see which parts of each video attract the most playback from their peers,
                                                 which helps them select material at revision time. Usage of the system
                                                 is fully anonymised and GDPR-compliant.

                                                 Keywords: Video summaries · Video learning · Online learning.

                                         1     Pedagogical Background
                                         University classes virtually conducted on Zoom or other online platforms as
                                         the result of COVID-19 have had an immediate impact on how students study
                                         and review what was delivered during the semester in preparation for semester-
                                         ending exams. For classes delivered synchronously (e.g. an online, live lecture
                                         over Zoom), the recording of those sessions is useful and thus typically is made
                                         available on a learning management systems (LMS) for students to re-watch later
                                         ?
                                             The research was partly supported by Science Foundation Ireland under Grant Num-
                                             ber SFI/12/RC/2289 P2, co-funded by the European Regional Development Fund.
2 H. Lee et al.
on; for classes that use asynchronous video materials (e.g. a series of short video
screencasts in which a lecturer may explain concepts), typically many short or
long recorded videos become available for students to watch in their own time.
Many university courses have been employing a mixture of these synchronous
and asynchronous methods to compensate for the lack of the benefits of face-to-
face class setting. Students’ views on using such educational videos as the main
source of learning has recently been studied [1] showing a mixture of benefits
and fears.
Partly due to the inherent temporal nature of video medium that requires a
viewer to “playback” in order to understand the contents, and partly due to the
unedited and linear nature of lecture videos (unlike production videos featuring
content-induced structure such as camera shots and scenes, chapters, and tran-
sitions), one consequence in the consumption of the video materials generated
in this context is an increased burden to the students who face a large amount
of unstructured lecture videos and screencasts at the time of reviewing: simply
re-watching all video materials is not feasible, and yet there is no way to know
what parts of the videos they should focus on. There are recent studies on track-
ing students’ eye-gaze while watching a video lecture [4] or logging their level
of attention during online classes [3], the knowledge of which could be used in
suggesting the parts of videos that students should/could focus on in reviewing.
This requires the capturing of the data at the time of watching/lecturing, an
overhead on the front-end such as camera or other installed software to capture
the eye-tracking/attention data.
The system described in this demonstration paper is a web-based video li-
brary of recorded video materials (both synchronous and asynchronous) as a
result of running a remote online course at our university. By recording and
analysing the detailed playback usage of each video including fast-forward, jump-
ing forward while playing and re-playing over time by the student cohort, the
system visualises and highlights which portions within each video have been
found to be most important or most used by other students, thus offering clues
during the re-watching/ revision process without requiring any manual interven-
tion (e.g. lecturer indicating the parts of videos to watch).
2 Description of the Prototype
Our system generates a usage visualisation purely based on the playback-related
interaction logs incurred by anonymised students, after the videos are made
available for them for viewing on the course. The visualisation is a time-based
graph aligned with the playback timeline of video content, where the height
along the timeline indicates usage scores calculated using the strategy below.
The playback-related interactions captured and factored in by the system include
playing/pausing, seeking/skip forward (i.e. jumping from one point to another
within a video), video playback window moving in/out of focus, and playback
speed/rate.Usage-based Summaries of Learning Videos 3
Each video is divided into 1-second windows and each window starts with an
initial score of 0 which is incremented every time any student plays or skips it.
Every time any part of the video is played, that part will gain a score, thus over
time as the usage increases the score in each second-by-second window on the
timeline will increase. An important consideration is how much score gain each
1-second-window should receive from each of the playback-related interactions
above, in order to result in a meaningful and useful indication when accumulated
over time, in guiding students in their selective watching.
Our strategy and the rationale for calculating the score gain for each 1-
second-window is summarised below:
– Playback as part of “run through”: As the most basic scoring strategy, the
window gets +1 when that portion is played. However, if the video playback
window was not the window of focus on the student’s screen when the stu-
dent was playing it, then this increment is +0.25 only (the student may be
reading email or something else while half-listening to the video).
– Replay as part of rewind within the same session will gain +2 score for each
1-second-window so it gets a cumulative +3: +1 from the initial playback
and +2 from the replay). This assumes a replay is done with the playback
window as the window in focus, as it would not be possible to select and
replay if the window was not the focus.
– Playback at 2× (double speed) will gain +0.6 and if the window is not the
window of focus then it will be +0.2 only because when the student is
attending another window, the double-speed playback is too fast to properly
comprehend.
– Playback at 1.5× will gain +1.5, and +0.5 if the playback window is not the
window of focus. In fact, a moderate acceleration of the video playback may
potentially lead to increased students’ learning performance. For instance, a
recent study [2] shows that playing educational videos at 1.25× resulted in
better outcomes (e.g. getting higher grades) than normal speed, while also
testing for other speeds (0.75× and 1.75×).
– Skip forward : If a student skips forward from the current position at minute
S0 by a segment of video then windows within 1-, 2-, and 3-minute segments
directly following the segment S0 will get score adjustments as follows: S60:
-0.3, S120: -0.2, and S180: -0.1. The rationale for this deduction is that
the student must have had an idea what was coming up next, after S0, but
anticipated it as being not interesting or useful thus less likely for other
students to find it also interesting or useful.
– Adjusting the score over time: Overarching this scoring strategy is a decay
function based on recency of playback, with the most recent days of play-
back interaction being more meaningful or useful than prior to that. The
scores calculated by the above strategy are re-calculated from the interac-
tion log each midnight. In this way the score increments (both + and -) as
above are called our BaseIncrements = (+1.0, +0.25, +2, +0.6, +0.2, +1.5,
+0.5, -0.3, -0.2, -0.1) and the system makes those the actual increments on
day 0. Then on day 1 it makes those increments each multiplied by 1.1 be-
fore adding, on day 2 the base increments multiplied by 1.2, and so on. The4 H. Lee et al.
effect is that on day 10 we have a score for each 1-second window which has
a 10-day linear decay function so that something played on day 9 has twice
the value of something played on day 0 and by day 20 we have a score which
has a 20-day linear decay with the “half-life” being 10 days. This continues
indefinitely.
The scores for the 1-second windows are normalised within each video usage
graph at display time making the visualisation less susceptible over time to any
maligned attempt at artificially inflating scores by jumping to or repeatedly
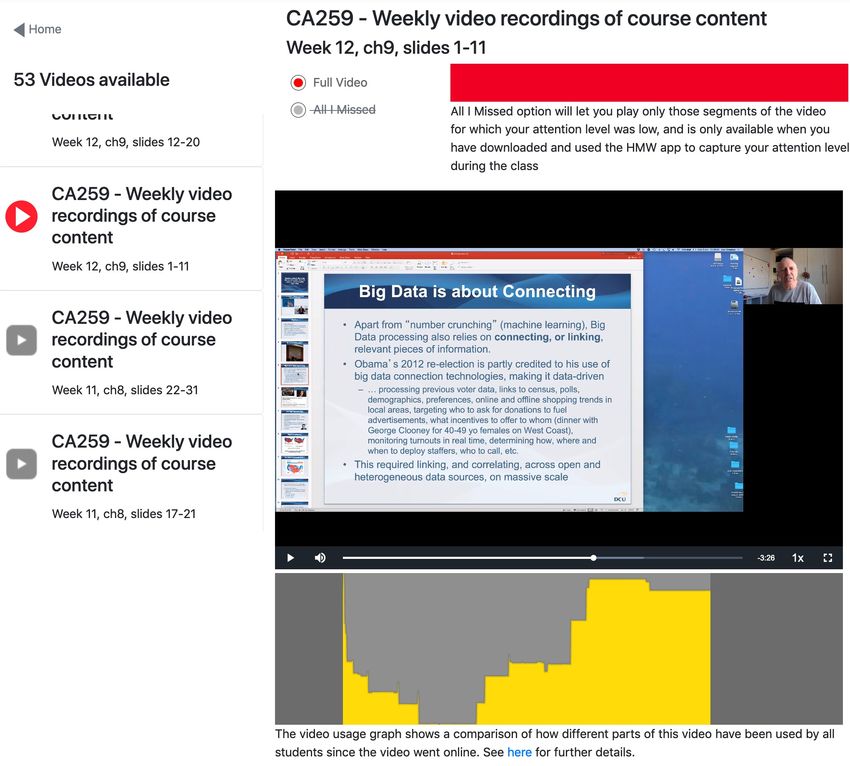
playing an obscure segment of video. Figure 1 shows a screenshot of the system.
Fig. 1. Screenshot of system interface showing the user has 3:26 left to play at 1x speed
of what appears as a 10-minute video from week 12, chapter 9, slides 1 to 11 of course
CA259. The yellow graph under the video playback window indicates the section the
user is about to play has had highest usage rating based on previous video playback
from the class whereas the part of the video at about the 1/3 mark has near zero usage.
3 Use Case and Results Achieved
The system has been deployed in our university and we use as an example, an
undergraduate-level course during the Spring semester 2021, with a class sizeUsage-based Summaries of Learning Videos 5
of 131 students. This has 11 synchronous class recordings of about 1 hour and
20 minutes each and 53 asynchronous short-form video screencasts of about
10 minutes each, amounting to approximately 23 and a half hours of playable
video content. Since the semester started, students have been using the system,
actively playing and re-playing the video contents as part of their studies thus
feeding into the playback usage analysis which, in turn, helps guide the portions
of each video for them to watch.
At the time of submission, the system is being used extensively by students
with 2,900 hours of video streamed across 434 distinct sessions. On average per-
session each student watched 1.5 videos and spent 6.7 minutes (404.8 seconds)
viewing materials. As a percentage of a video viewed per-session each student on
average viewed 35% with a standard deviation of 0.4. However as the semester is
incomplete at the time of submission, and we expect a large increase in usage as
we get closer to end-of-semester examinations, it is too early to draw any further
conclusions from this usage.
4 Future Work
Since this is the first time the system has operated for the full duration of
a semester, we are learning from the usage data and how to leverage it. We
plan to fine-tune the scoring strategy based on the gained insights as well as
diversifying to a greater range of interaction logs (e.g. playback volume). The
timeline visualisation will be further refined to more effectively convey the usage
data. More formal usability testing with students will also take place. Further
validation on the effectiveness of our system by using semantic feedback from
both students and lecturers on video content will also be part of our future work.
References
1. Krieter, P., Viertel, M., Breiter, A.: We know what you did last semester: Learners’
perspectives on screen recordings as a long-term data source for learning analytics.
In: Addressing Global Challenges and Quality Education. pp. 187–199. Springer
International Publishing, Cham (2020)
2. Lang, D., Chen, G., Mirzaei, K., Paepcke, A.: Is faster better? A study of video
playback speed. In: Proceedings of the Tenth International Conference on Learning
Analytics & Knowledge. p. 260–269. LAK20, Association for Computing Machinery
(2020). https://doi.org/10.1145/3375462.3375466
3. Lee, H., Liu, M., Riaz, H., Rajasekaren, N., Scriney, M., Smeaton, A.: Attention
based video summaries of live online Zoom classes. In: Proceedings of the 35th
AAAI Conference on Artificial Intelligence, Workshop on Imagining Post-COVID
Education with Artificial Intelligence, 9 February (2021)
4. Srivastava, N., Nawaz, S., Newn, J., Lodge, J., Velloso, E., M. Erfani, S., Gasevic,
D., Bailey, J.: Are you with me? Measurement of learners’ video-watching attention
with eye tracking. In: LAK21: 11th International Learning Analytics and Knowl-
edge Conference. p. 88–98. LAK21, Association for Computing Machinery (2021).
https://doi.org/10.1145/3448139.3448148You can also read