Using spatial-temporal ensembles of convolutional neural networks for lumen segmentation in ureteroscopy
←
→
Page content transcription
If your browser does not render page correctly, please read the page content below
Using spatial-temporal ensembles of
                                                  convolutional neural networks for lumen
                                                       segmentation in ureteroscopy ∗
arXiv:2104.01985v1 [eess.IV] 5 Apr 2021

                                            Jorge F. Lazo1,2 , Aldo Marzullo3 , Sara Moccia4,5 , Michele Catellani6 , Benoit
                                                        Rosa2 , Michel de Mathelin2 , and Elena De Momi1
                                                                        1
                                                                          DEIB, Politecnico di Milano, Milan, Italy
                                                        2
                                                         ICube, UMR 7357, CNRS-Université de Strasbourg, Strasbourg, France
                                                3
                                                  Department of Mathematics and Computer Science, University of Calabria, Rende, Italy
                                                           4
                                                             The BioRobotics Institute, Scuola Superiore Sant’Anna, Pisa, Italy
                                                    5
                                                      Department of Excellence in Robotics and AI, Scuola Superiore Sant’Anna, Pisa
                                                                  6
                                                                    Istituto Europeo di Oncologia (IRCCS), Milan, Italy

                                                                                         Abstract

                                                Purpose: Ureteroscopy is an efficient endoscopic minimally invasive technique for the
                                                diagnosis and treatment of upper tract urothelial carcinoma (UTUC). During ureteroscopy,
                                                the automatic segmentation of the hollow lumen is of primary importance, since it indicates
                                                the path that the endoscope should follow. In order to obtain an accurate segmentation
                                                of the hollow lumen, this paper presents an automatic method based on Convolutional
                                                Neural Networks (CNNs).
                                                Methods: The proposed method is based on an ensemble of 4 parallel CNNs to simulta-
                                                neously process single and multi-frame information. Of these, two architectures are taken
                                                as core-models, namely U-Net based in residual blocks(m1 ) and Mask-RCNN(m2 ), which
                                                are fed with single still-frames I(t). The other two models (M1 , M2 ) are modifications of
                                                the former ones consisting on the addition of a stage which makes use of 3D Convolutions
                                                to process temporal information. M1 , M2 are fed with triplets of frames (I(t − 1), I(t),
                                                I(t + 1)) to produce the segmentation for I(t).
                                                Results: The proposed method was evaluated using a custom dataset of 11 videos (2,673
                                                frames) which were collected and manually annotated from 6 patients. We obtain a Dice
                                                similarity coefficient of 0.80, outperforming previous state-of-the-art methods.
                                                Conclusion: The obtained results show that spatial-temporal information can be effec-
                                                tively exploited by the ensemble model to improve hollow lumen segmentation in uretero-
                                                scopic images. The method is effective also in presence of poor visibility, occasional bleed-
                                                ing, or specular reflections.
                                                Keywords:
                                                · Deep learning · ureteroscopy · convolutional neural networks · image segmen-
                                                tation · upper tract urothelial carcinoma (UTUC)
                                            ∗ This work was supported by the ATLAS project. This project has received funding from the European

                                          Union’s Horizon 2020 research and innovation programme under the Marie Sklodowska-Curie grant agreement
                                          No 813782.

                                                                                             1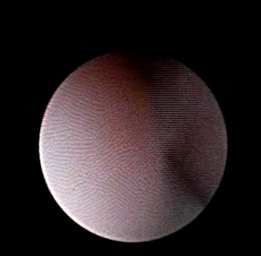
1    Introduction
Upper Tract Urothelial Cancer (UTUC) is a sub-type of urothelial cancer which arises in the
renal pelvis and the ureter. The disease, has an estimated number of 3,970 patients affected
in 2020 [1] in the United States. Flexible Ureteroscopy (URS) is nowadays the gold standard
for UTUC diagnosis and conservative treatment. URS is used to inspect the tissue in the
urinary system, determine the presence and size of tumour [2] as well as for biopsy of suspicious
lesions [3]. The procedure is carried out under the visual guidance of an endoscopic camera [4].
    Navigation and diagnosis through the urinary tract are highly dependent upon the operator
expertise [5]. For this reason, the current development of methods in Computer Assisted
Interventions (CAI) intends to support surgeons by providing them with relevant information
during the procedure [6]. Additionally, within the endeavours of developing new tools for robotic
ureteroscopy, a navigation system which relies on image information from the endoscopic camera
is also needed [7].
    In this study, we focus on the segmentation of the ureter’s lumen. In ureter-endoscopic
images, the lumen appears most likely as a tunnel or hole in the images with its center being
the region with the lowest illuminance inside the Field of View (FOV). Lumen segmentation
presents some particular challenges such as the difficulty of defining the concrete boundary of
it, the narrowing of the ureter around the ureteropelvic junction [4], and the appearance of
image artifacts such as blur, occlusions due to the appearance of floating debris or bleeding .
Some examples of these, present in our data, are shown in Fig. 1.
    In the CAI domain, Deep Learning (DL)-based methods, represent the state-of-the-art for
many image processing tasks, including segmentation. In [8] an 8-layer Fully Convolutional
Network (FCN) is presented for semantic segmentation of colonoscopy images for different
classes, including lumen in the colon, polyps and tools. In [9] a U-Net-like architecture based
on residual blocks for lumen segmentation in ureteroscopy images is proposed. However, these
DL-based approaches in the field of CAI only use single frames, which dismisses the chance of
obtaining extra information from temporal features.
    The exploitation of spatial-temporal information has shown to obtain better performances
than approaches that only process single frames. In [10] a model based on 3D convolutions is
proposed for the task of tool detection and articulation estimation, and in [11] a method for
infants limb-pose estimation in intensive care uses 3D Convolutions to encode the connectivity
in the temporal direction.
    Additionally, recent results in different biomedical image segmentation challenges have
shown the effectiveness of DL ensemble models, such as and in [12] where an ensemble consisting
of 4 UNet-like models and one Deeplabv3+ network was proposed obtaining the 2nd place in
the 2019 SIIM-ACR pneumo-thorax challenge, and in in [13] where an ensemble which analyzed
single-slices data 3D volumetric data separately was presented, obtaining top performance in
the HVSMR 3D Cardiovascular MRI in Congenital Heart Disease 2016 challenge dataset.
    Inspired by both paradigms our research hypothesis is that the use of ensembles which use
both, single-frame and consecutive-frames information could achieve a better generalization
in data than models which uses only one of them. For this purpose we propose an ensemble
model which uses in parallel 4 Convolutional Neural Networks which can exploit the information
contained in single-frame and continue-frames, of ureteroscopy videos.

2    Proposed Method
As introduced in [14, 12], we considered the use of ensembles to reach a better generalization
of the model when testing it on unseen data. The proposed ensemble of CNNs for ureter’s

                                               2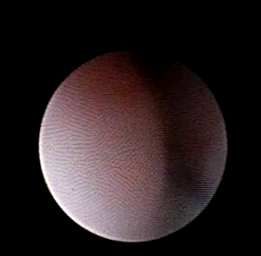
(a) Variations in the shape of the lumen, and the hues of the surrounding tissue.

                                (b) Noise                      (c) Blood occlusion

                          (d) Lumen narrowing                (e) Debris and bubbles

Figure 1:   Sample images in our dataset showing: (a) the hue variability of the surrounding tissue as well as
the shape and location of the lumen (the hollow lumen is highlighted in green to show clearly the variety of
shapes in which it could appear). (b)-(e) Samples of artifacts (the lumen was not highlighted to have a clear
view of the image artifacts).

lumen segmentation is depicted in Fig. 2. Our ensemble is fed with three consecutive frames
[I(t − 1), I(t), I(t + 1)] and produces the segmentation for the frame It . The ensemble is made
of two pairs of branches. One pair (the red one in Fig. 2) consists of U-Net with residual blocks
(m1 ) and Mask-RCNN (m2 ), which process the central frame It . The other pair (orange path
in Fig. 2) processes the three frames with M1 and M2 , which extend m1 and m2 as explained
in Sec. 2.1.
    It is important to notice that frames constituting the input for any M are expected to
have the minimal possible changes, but still significant to provide extra information which
could not be obtained by other means. Some specific examples in our case study include the
appearance of debris crossing rapidly the FOV, the sudden appearance or disappearance of some
image specularity, a slightly change in the illumination or the position of the element we are
interested to segment. For this reason, we consider only three consecutive frame It−1 , It , It+1
as input for the model.
    The core models m1 , m2 on which our method is based are two state of the art architectures
for instance segmentation:

   1. (m1 ): The U-Net implementation used in this work is based on residual units as used
      in [9], instead of using the classical convolutional blocks, this is meant to to address the
      degradation as proposed in [15].
   2. (m2 ): Is an implementation of Mask-RCNN [16] using ResNet50 as backbone. Mask-
      RCNN is composed of different stages. The fist stage is composed of two networks:
      a “backbone”, which performs the initial classification of the input given a pretrained
      network, and a region proposal network. The second stage of the model consists of
      different modules which include a network that predicts the bounding boxes, an object

                                                      3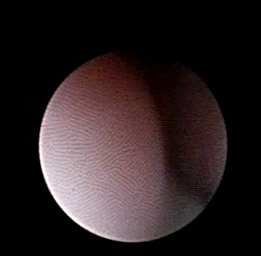
(a) The general workflow. Blocks of 3 consecutive frames I(t − 1), I(t), I(t + 1) of size p × q × nc
(where p and q refers to the spatial dimensions and nc to the number of channels of each individual
frame) are fed into the ensemble. Models M1 and M2 (orange line) take directly this blocks as input
whereas models m1 and m2 only take the central frame (red line). Each of the pi (t) predictions made
by each model are ensemble with the function F (pk ) defined in Eq. 1 to perform the final output.

     (b) m1 : U-Net based on residual blocks.                          (c) m2 : Mask-RCNN

Figure 2: Diagram of the proposed models and their constitutive parts. The two core models m1 and m2 are
U-Net based in residual blocks (Fig. 2(b)) and Mask-RCNN (Fig. 2(c)) respectively. In the case of U-Net based
with residual blocks the dashed square depicts the composition of the residual block used. The right branch is
composed of two consecutive sets of 2D Convolution layers, with its respective Batch Normalization layer and
ReLu as activation function. The output of the block is defined by the addition of the identity branch and the
former branch.

                                                      4
Figure 3: The initial stage of the models M. The blocks of consecutive frames I(t − 1), I(t), I(t + 1) of size
p × q × nc (where p and q refers to the spatial dimensions and nc to the number of channels (ch) of each
individual frame) pass through an initial 3D Convolution with nk number of kernels. The output of this step
has a shape of size (1, p − 2, q − 2, nk ) which is padding with zeros in the 2nd and 3rd dimensions to latter, and
then reshaped to fit as input for the m core-models
classification network and a FCN which generate the masks for each RoI.
Since our implementation is made of different sets of models, the final output is determined
using an ensemble function F (pi (t)) defined as:
1X
k
F (pi (t)) = pi (t) (1)
k i
where pi (t) corresponds to the prediction of each of the k = 4 models for a frame I(t).
2.1 Extending the core models for handling multi-frame information
For each core model m, an extension M is obtained by adapting the architecture for processing
multi-frame information.
Let I be an ordered set of n elements I ∈ Np,q,nc corresponding to frames of a video, where p
and q represent spatial dimensions and nc the number of color channels (Fig. 3). Starting from
any core model (m), which takes as input elements from I, we can define another segmentation
model (M ) which receives multi-frame information from I. Specifically, it receives inputs of
the form I ∈ Nr,p,q,nc , where r = 3 represent the temporal dimension (number of frames). To
this aim, the core model m is extended by prepending an additional 3D Convolution layer with
nk kernels of size (r × 3 × 3). The new layer produces an output H ∈ N1,p−2,q−2,nk , so that
feeding it into m is straightforward. The issue of having p − 2 and q − 2 instead of p and q after
the 3D Convolution is fixed by padding the output with zeros in the two spatial dimensions. A
graphical representation of the process is shown in Fig. 3.
5Table 1: Information about the dataset collected. The video marked in bold indicates the
patient-case that was used for testing.
Patient No. Video No. No. of Image
anno- Size
tated (pixels)
frames
1 Video 1 21 356x256
1 Video 2 240 256x266
2 Video 3 462 296x277
2 Video 4 234 296x277
3 Video 5 51 296x277
4 Video 6 201 296x277
5 Video 7 366 256x262
6 Video 8 387 256x262
6 Video 9 234 256x262
6 Video 10 117 256x262
6 Video 11 360 256x262
Total - 2,673 -
3 Evaluation
3.1 Dataset
For this study, 11 videos from 6 patients undergoing ureteroscopy procedures were collected.
Videos from five patients were used for training the model and tuning hyperparameters. Videos
from the remaining patient, randomly chosen, were kept aside and only used for evaluating the
performance. The videos were acquired from the European Institute of Oncology (IEO) at
Milan, Italy following the ethical protocol approved by the IEO and in accordance with the
Helsinky Declaration.
The number of frames extracted and manually segmented by video is shown in Table 1.
Data augmentation was implemented before starting the trainings. The operations used for
this purpose were rotations in intervals of 90◦ , horizontal and vertical flipping and zooming in
and out in a range of ± 2% the size of the original image.
3.2 Training Setting
All the models were trained, once at time, at minimizing the loss function based on the Dice
Similarity Coefficient (LDSC ) defined as:
2T P
LDSC = 1 − (2)
2T P + F N + F P
where T P (True Positives) is the number of pixels that belong to the lumen, which are correctly
segmented, F P (False Positives) is the number of pixels miss-classified as lumen, and F N (False
Negatives) is the number of pixels which are classified as part of lumen but actually they are
not.
For the case of (m1) the hyperparameters learning rate (lr) and mini batch size (bs) were
determined using a 5-fold cross validation strategy with the data from patients 1, 2, 3, 4 and 6
in a grid search. The ranges in which this search was performed were lr = {1e − 3, 1e − 4, 1e −
65, 1e − 6} and bs = {4, 8, 16}. The DSC was set as the evaluation metric to determine the
best model for each of the experiments. Concerning the extensions M , the same strategy was
used to determine the number of kernels of the input 3D convolutional layer. The remaining
hyperparameters were set the same as for m1 .
In case of m2 , the same 5-fold cross validation strategy was used. The hyperparameters
tuned were: the backbone (from the options ResNet50 and ResNet101 [15]) and the value of
minimal detection confidence in a range of 0.5 to 0.9 with differences of 0.1. To cover the range
of different sizes of masks in the training and validation dataset the anchor scales were set to the
values of 32, 64, 128 and 160. In this case the number of filters in the initial 3D convolutional
layer was set to a value of 3 which is the only one that could match the predefined input-size,
after reshaping, of ResNet backbone.
For each core models and their respective extensions, once the hyperparameters values were
chosen, an additional training process was carried out using these values in order to obtain
the final model. The training was performed using all the annotated frames obtained from
the previously mentioned 5 patients, 60% of the frames were used for training and 40% for
validation. The results obtained in this step were the ones used to calculate the ensemble
results the function defined in Eq. 1.
The Networks were implemented using Tensorflow and Keras frameworks in Python 3.6
trained on a NVIDIA GeForce RTX 280 GPU.
3.3 Performance Metrics
The performance metrics chosen were DSC, Precision (P rec) and Recall (Rec), defined as:
DSC = 1 − LDSC (3)
TP
P rec = (4)
TP + FP
TP
Rec = (5)
TP + FN
3.4 Ablation study and comparison with sate-of-the-art
First, the performance of the proposed method was compared with the one presented in [9],
where the same U-Net based on residual blocks architecture was used. Then, as ablation study,
four versions of the ensemble model were tested:
1. (m1 ,m2 ): only single-frame information was considered in the ensemble;
2. (M1 ,M2 ): only multi-frame information was considered in the ensemble;
3. (m1 ,M1 ), (m2 ,M2 ): each of the core models, and its respective extension, were considered
in the ensemble, separately.
In these cases, the ensemble function was computed using the values of the predictions of each
of the models. The Kruskal-Wallis test on the DSC was used to determine the statistical
significance between the different single models tested.
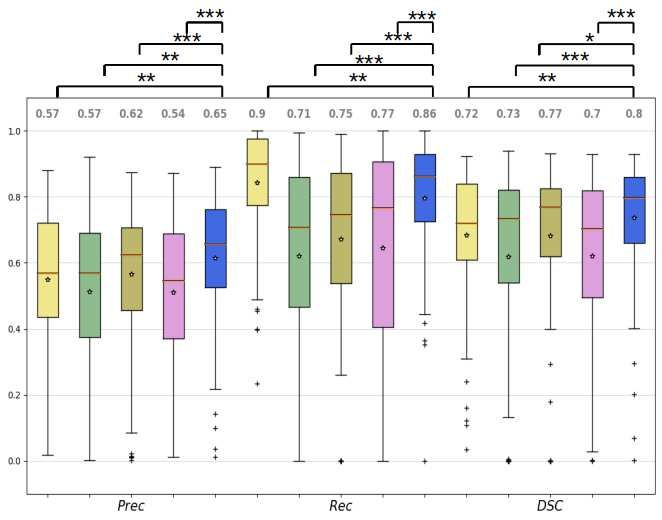
7Figure 4: Box plots of the precision (P rec), recall (Rec) and the Dice Similarity Coefficient (DSC) for the
models tested. m1 (yellow): ResUNet with single image frames, m2 (green): ResUNet using consecutive tem-
poral frames, M1 (brown): Mask-RCNN with single image frames, M2 (pink): Mask-RCNN using consecutive
temporal frames, and the proposed ensemble method (blue) formed by all the previous models. The asterisks
represent the significant difference between the different architectures in terms of the Kruskal-Wallis sign rank
test (* p < 0.05, ** p < 0.01, *** p < 0.001).
Table 2: Average Dice Similarity Coefficient (DSC), precision (P rec) and recall (Rec) in the cases in which
the ensemble were formed only by: 1. Spatial models (m1 , m2 ); 2. spatial-temporal (M1 , M2 ), 3. ResUnet with
both spatial and temporal inputs (M1 , m1 ) and 4. Mask-RCNN with the same setup (M2 , m2 ). F (∗) refers
to the ensemble function used Eq. 1, and the components used to form the ensemble are stated between the
parenthesis.
F(*) DSC P rec Rec
(m1 , m2 ) 0.78 0.65 0.71
(M1 , M2 ) 0.71 0.55 0.57
(M1 , m1 ) 0.72 0.56 0.66
(M2 , m2 ) 0.68 0.51 0.63
84 Results
The box plots of the P rec, Rec and the DSC are shown in Fig. 4. Results of the ablation
study are shown in Table 2. The proposed method achieved a DSC value of 0.80 which is
8% better than m1 using single frames (p < 0.01) and 3% than m2 trained as well with single
frames (p < 0.05). When using single-frame information, m2 performs 5% better than m1 .
However the results is the opposite using multi-frame information. The ensembles of single-
frame models (m1 , m2 ) performs 7% better with respect to ensembles of models exploiting
multi-frame information (M1 , M2 ). In the case of spatio-temporal-based models U-Net based
on residual blocks (M1 ) performs 3% better than the one based on Mask-RCNN (M2 ). This
might be due to the constraint of fitting the output of the 3D Convolution into the layers of
the backbone of Mask-RCNN. The same limitation might explain the similar behaviour when
it comes to the comparison of the ensembles composed only by U-Net based in residual blocks
models and Mask-RCNN-based models, where the former one performs 4% better than the
second one. The only model which achieves a better performance than the proposed one in
any metric is U-Net based on residual blocks with the Rec, obtaining a value 0.04 better than
the model we proposed. Visual examples of the achieved results are shown in Fig. 5 and in the
video attached to this paper. Here, the first 2 rows show frames in which the lumen appears
clearly and there is no presence of major image artifacts. As observable, each single model
underestimate the ground-truth mask. However, their ensemble gives a better approximation.
The next 2 rows show cases in which some kind of occlusions (such as blood or debris) is
covering most of the FOV. In those cases, single-frame models (m) give better results than its
counterparts handling temporal information (M ). Finally, the last 2 rows of the image contain
samples showing minor occlusions (such as small pieces of debris crossing the FOV) and images
where the lumen is not on focus.
The average inference time was also calculated. Results for m1 and M1 are 26.3±3.7 ms and
31.5±4.7 ms, respectively. In case of m2 and M2 , the average inference times are 29.7±2.1 ms
and 34.7±6.2 ms, respectively. In the case of the ensemble, the average inference time was
129.6±6.7 ms when running the models consecutively.
5 Discussion
The proposed method achieved satisfactory results, outperforming existing approaches for lu-
men segmentation [9]. Quantitative evaluation, together with a visual inspection of the obtained
segmentations, highlight the advantage of using ensembles, confirming our research hypotheses.
This is particularly appreciable in presence of occlusions such as blood or dust covering the
FOV (Fig. 5 rows 4-7). In those cases, single-frame-based models tended to include non-lumen
regions in the predicted segmentation. An opposite behavior was observed when using only
multi-frame-based models, which tended to predict smaller regions with respect to the ground-
truth and which is also noticeable in the general performances carried during the ablation
studies (Table 2). The ensemble of all of them resulted, instead, in a predicted mask closer to
the ground-truth and exemplifies why the use of it in general turns into better performances.
It was also observed that the proposed ensemble method was able to correctly manage unde-
sirable false positives appearing in single models. This is due the fact that those false positives
did not appear in all the models at the same regions, therefore, the use of ensembles eliminate
them from the final result. This is of great importance in the clinical practice, given that false
positive classifications during endoluminal inspection might results in a range of complications
of the surgical operation, including tools colliding with tissues [17], incorrect path planning [18],
among others.
9Figure 5: Samples of segmentation with the different models test. The colors in the Overlay images represent
the following for each pixel. True Positives (TP): Yellow, False Positives (FP): Pink, False Negatives (FN): Blue,
True Negatives (TN): Black. The first three rows depict images where the lumen is clear with the respective
segmentation from each model. Rows 4-7 show cases in which some kind of occlusion appears. Finally the rows
8-12 depict cases in which the lumen is contracted, and/or there is debris crossing the FOV.
10Despite the positive results achieved by the proposed approach, some limitations are worth
to be mentioned. Computational time required for inference is one of those. In terms of inference
time, the proposed model requires 4 times more than previous implementations. However, it
is important to state that when it comes to applications of minimal invasive surgery, accuracy
may be preferred over speed to avoid any complication, such as perforations of the ureter [5].
Furthermore, such time could be improved by taking advantage of distributed parallel set-ups.
A final issue is related to the scarcity of public available and annotated data, necessary to train
and benchmark, which is a well-known problem in literature. However, this can be overcome
in future as new public repositories containing spatial-temporal data are released.
6 Conclusion
In this paper, we introduced a novel ensemble method for ureter’s lumen segmentation. Two
core models based on U-Net and Mask-RCNN were exploited and extended, in order to cap-
ture both single-frame and multi-frame information. Experiments showed that the proposed
ensemble method outperforms previous approaches for the same tasks [9], by achieving an in-
crement of 7% in terms of DSC. In the future, evident extensions of the present work will
be investigated, including better methods to fit spatial-temporal data into models which were
pre-trained in single image datasets (such as Mask-RCNN). Furthermore, we will investigate
methods for decreasing the inference time, thus allowing real-time applications.
References
[1] R. L. Siegel, K. D. Miller, and A. Jemal, “Cancer statistics, 2020,” CA: A Cancer Journal
for Clinicians, vol. 70, no. 1, pp. 7–30, 2020.
[2] M. Cosentino, J. Palou, J. M. Gaya, A. Breda, O. Rodriguez-Faba, and H. Villavicencio-
Mavrich, “Upper urinary tract urothelial cell carcinoma: location as a predictive factor for
concomitant bladder carcinoma,” World Journal of Urology, vol. 31, no. 1, pp. 141–145,
2013.
[3] C. P. Rojas, S. M. Castle, C. A. Llanos, J. A. S. Cortes, V. Bird, S. Rodriguez, I. M. Reis,
W. Zhao, C. Gomez-Fernandez, R. J. L. Leveillee, and M. Jorda, “Low biopsy volume in
ureteroscopy does not affect tumor biopsy grading in upper tract urothelial carcinoma,” in
Urologic Oncology: Seminars and Original Investigations, vol. 31, pp. 1696–1700, Elsevier,
2013.
[4] S. E. Wason and S. W. Leslie, “Ureteroscopy,” StatPearls, 2020, (Accessed 29-11-2020).
[5] J. J. de la Rosette, T. Skrekas, and J. W. Segura, “Handling and prevention of complica-
tions in stone basketing,” European Urology, vol. 50, no. 5, pp. 991–999, 2006.
[6] B. Münzer, K. Schoeffmann, and L. Böszörmenyi, “Content-based processing and analysis
of endoscopic images and videos: A survey,” Multimedia Tools and Applications, vol. 77,
no. 1, pp. 1323–1362, 2018.
[7] G. Borghesan, F. Trauzettel, M. H. D. Ansar, B. F. Barata, D. Wu, Z. Li, J. F. Lazo,
M. Finocchiaro, T. Hà Xuan, C.-F. Lai, S. Ramesh, S. K. Sahu, L. Sestini, L. Guiqiu, and
A. Pore, “ATLAS: Autonomous intraluminal surgery: System specifications for targeted
intraluminal interventions,” 2020 (Accessed 10-12-2020).
11[8] D. Vázquez, J. Bernal, F. J. Sánchez, G. Fernández-Esparrach, A. M. López, A. Romero,
M. Drozdzal, and A. Courville, “A benchmark for endoluminal scene segmentation of
colonoscopy images,” Journal of Healthcare Engineering, vol. 2017, 2017.
[9] J. F. Lazo, A. Marzullo, S. Moccia, M. Cattellani, B. Rosa, F. Calimeri, M. de Mathelin,
and E. De Momi, “A lumen segmentation method in ureteroscopy images based on a deep
residual u-net architecture,” in International Conference on Pattern Recognition (ICPR),
2020.
[10] E. Colleoni, S. Moccia, X. Du, E. De Momi, and D. Stoyanov, “Deep learning based robotic
tool detection and articulation estimation with spatio-temporal layers,” IEEE Robotics and
Automation Letters, vol. 4, no. 3, pp. 2714–2721, 2019.
[11] S. Moccia, L. Migliorelli, V. Carnielli, and E. Frontoni, “Preterm infants’ pose estimation
with spatio-temporal features,” IEEE Transactions on Biomedical Engineering, 2019.
[12] X. Wang, S. Yang, J. Lan, Y. Fang, J. He, M. Wang, J. Zhang, and X. Han, “Automatic
segmentation of pneumothorax in chest radiographs based on a two-stage deep learning
method,” IEEE Transactions on Cognitive and Developmental Systems, 2020.
[13] H. Zheng, Y. Zhang, L. Yang, P. Liang, Z. Zhao, C. Wang, and D. Z. Chen, “A new
ensemble learning framework for 3d biomedical image segmentation,” in Proceedings of the
AAAI Conference on Artificial Intelligence, vol. 33, pp. 5909–5916, 2019.
[14] A. O. Vuola, S. U. Akram, and J. Kannala, “Mask-RCNN and U-net ensembled for nuclei
segmentation,” in 2019 IEEE 16th International Symposium on Biomedical Imaging (ISBI
2019), pp. 208–212, IEEE, 2019.
[15] K. He, X. Zhang, S. Ren, and J. Sun, “Deep residual learning for image recognition,”
in Proceedings of the IEEE Conference on Computer Vision and Pattern Recognition,
pp. 770–778, 2016.
[16] K. He, G. Gkioxari, P. Dollár, and R. Girshick, “Mask R-CNN,” in Proceedings of the
IEEE International Conference on Computer Vision, pp. 2980–2988, 2017.
[17] Y. He, P. Zhang, X. Qi, B. Zhao, S. Li, and Y. Hu, “Endoscopic path planning in robot-
assisted endoscopic nasal surgery,” IEEE Access, vol. 8, pp. 17039–17048, 2020.
[18] F. N. Alsunaydih, M. S. Arefin, J.-M. Redoute, and M. R. Yuce, “A navigation and
pressure monitoring system toward autonomous wireless capsule endoscopy,” IEEE Sensors
Journal, vol. 20, no. 14, pp. 8098–8107, 2020.
12You can also read