Vaccination strategies and transmission of COVID-19: evidence across leading countries - arXiv
←
→
Page content transcription
If your browser does not render page correctly, please read the page content below
Vaccination strategies and transmission of COVID-19: evidence
                                                                             across leading countries
                                                                  Dongwoo Kim∗                          Young Jun Lee†
arXiv:2109.06453v1 [econ.GN] 14 Sep 2021

                                                              Simon Fraser University              University of Copenhagen

                                                                                    September 15, 2021

                                                                                           Abstract

                                                     Vaccination has been perceived as a key to reaching “herd immunity” in the current
                                                 COVID-19 pandemic. This paper examines effectiveness of different vaccination strategies.
                                                 We investigate the effects of two key elements in mass vaccination, which are allocations
                                                 and timing of first and second doses and types of vaccines, on the spread of COVID-19.
                                                 Amid limited supply of approved vaccines and constrained medical resources, the choice of a
                                                 vaccination strategy is fundamentally an economic problem. We employ standard time-series
                                                 and panel data models commonly used in economic research with real world data to estimate
                                                 the effects of progress in vaccination and types of vaccines on health outcomes. Potential
                                                 confounders such as government responses and people’s behavioral changes are also taken into
                                                 account. Our findings suggest that the share of people vaccinated with at least one dose is
                                                 significantly negatively associated with new infections and deaths. Conditioning on first dose
                                                 progress, full vaccination offers no further reductions in new cases and deaths. For vaccines
                                                 from China, however, we find weaker effects of vaccination progress on health outcomes.
                                                 Our results support the extending interval between first and second dose policy adopted by
                                                 Canada and the UK among others for mRNA-based vaccines. As vaccination progressed,
                                                 people’s mobility increased and it offset the direct effects of vaccination. Therefore, public
                                                 health measures are still important to contain the transmission by refraining people from
                                                 being more mobile after vaccinated.

                                             ∗
                                                Department of Economics, Simon Fraser University, 8888 University Drive, Burnaby, BC, V5A 1S6, Canada.
                                           Email: dongwook@sfu.ca
                                              †
                                                Department of Economics, University of Copenhagen, Øster Farimagsgade 5, Building 26, DK-1353 Copen-
                                           hagen K, Denmark. Email: yjl@econ.ku.dk.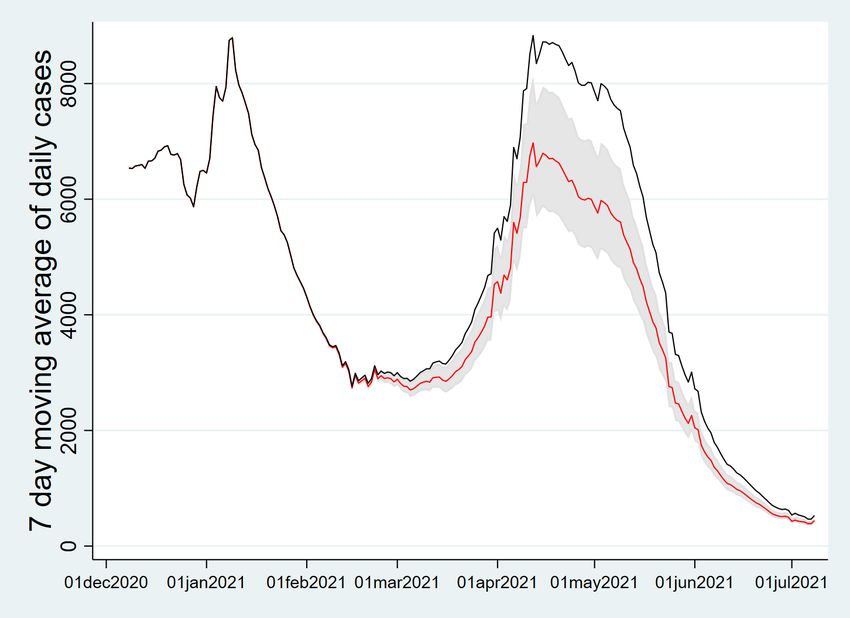
1    Introduction
In the current COVID-19 pandemic, vaccination has been perceived as a key to reaching “herd
immunity”. This paper investigate the effects of two key elements in mass vaccination which are
allocations and timing of first and second doses and types of vaccines. Mass vaccination programs
have launched in leading countries since the UK first approved the use of the Pfizer–BioNTech
vaccine in December 2020. Due to the very limited supply of approved vaccines in the early
stage, however, even the wealthiest countries in the world had difficulties to quickly roll out the
vaccine doses. COVID-19 vaccines require two doses to be administered per person within a
recommended time window by manufacturers. Three or four weeks are recommended for the
Pfizer–BioNTech and Moderna vaccines and 8-12 weeks for the AstraZeneca-Oxford vaccine.
Under the supply constraints, leading countries adopted different vaccine roll-out strategies.
UK and Canada extended the interval between first and second doses of COVID-19 vaccines up
to 12-16 weeks in order to maximize the share of (at least partially) vaccinated people, whereas
Israel and the US followed the recommended dosing interval. Some developing countries such
as Bahrain, Chile, Turkey, UAE and Uruguay relied on less widely approved vaccines developed
by Chinese firms.
    Implementing a longer interval between doses has sparked a heated debate among medical
experts and policy makers. In the UK, the British Medical Association (BMA) strongly stood
against the idea of delaying the second dose (Mahase (2020)) as there is no clinical evidence
that this strategy works. A similar criticism arose in Canada (CBC (2021)). Nonetheless, both
governments implemented longer intervals to vaccinate as many people as possible. There have
been handful of papers in the medical literature that suggest extending the interval between
two doses might be beneficial. Moghadas et al. (2021) use an agent-based modeling to compare
the vaccination strategies. They found that delaying the second dose can avert more infections,
hospitalizations and deaths than the standard dosing if the efficacy of the first dose does not
wane before the delayed second dose. Similar results using simulations-based methods are found
by Romero-Brufau et al. (2021) and Tuite et al. (2021). As the vaccination programs have
progressed longer than half a year, it is important to evaluate different vaccination strategies
using real world data. To our best knowledge, however, there is no research on real world
outcomes across different leading countries. This paper aims to provide observational cross
country evidence on the effectiveness of vaccination strategies.
    When it comes to types of vaccines used in mass vaccination programs, there have been rising
concerns over the efficacy of some less widely approved products. After inoculating more than a
half of the population, a few countries such as Chile, UAE, and Seychelles still experienced high
rates of infection. These countries heavily rely on Chinese vaccines (Sinopharm, Sinovac Biotech,
and CanSino) in their national inoculation programs. Vaccines from China can be a useful tool
to fight the pandemic for low and middle income countries as the supply of vaccines developed
in the US and Europe is limited and they cannot compete with the wealthiest countries to
secure enough stocks of those vaccines. We include countries having relied on Chinese vaccines

                                                2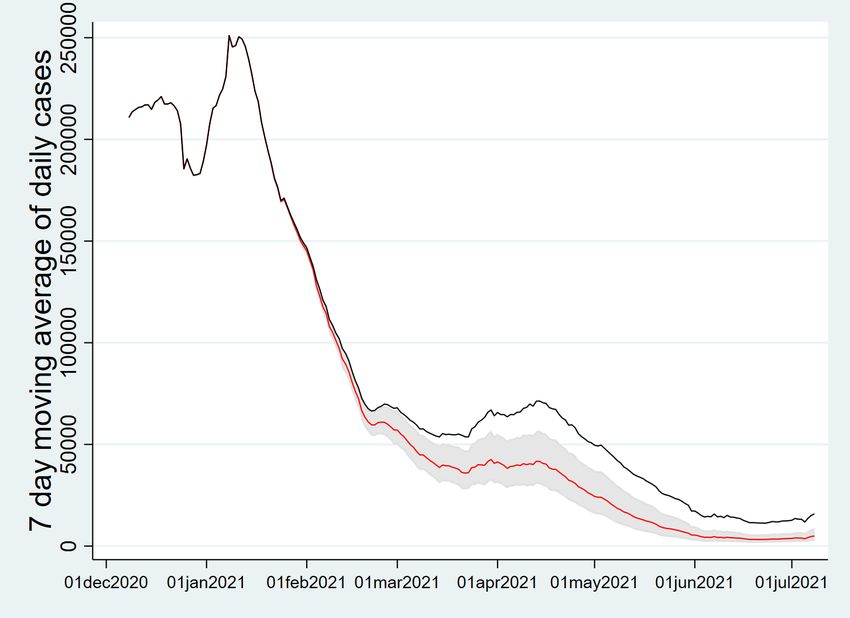
in our analysis to see whether those vaccines have contributed to mitigating transmission of the
infectious disease.
    The choice of a vaccination strategy is essentially an economic problem in the sense that
the resources for mass vaccination are constrained. Not only the supply of vaccines is limited
but also medical facilities and healthcare workers that administer the vaccine doses are capacity
constrained. Therefore, policy makers should devise an optimal strategy to allocate these limited
resources for the best possible social outcomes. In this paper, we investigate whether the interval
between first and second doses matters to contain the transmission of COVID-19. We also
take the types of vaccines used in mass vaccination into account. As Kitagawa and Wang
(2021) mentioned, optimal allocations and timing between the doses is a relevant and important
problem. We rely on standard econometric approaches with real world data to answer this
question. And thereby, we contribute to the literature by providing a large scale observational
study on this important issue.
    We employ standard time-series and panel data econometric frameworks with cross-country
data to estimate the effects of the first and second dose vaccination on the COVID-19 trans-
mission conditional on potential confounders. There are recent research papers that examine
the impacts of public policies on health outcomes such as lockdown (see Acemoglu et al. (2020),
Bjørnskov (2020), Born et al. (2021) and Cho (2020). Allen (2021) and Herby (2021) provide
extensive literature review), and mandatory mask wearing (see Chernozhukov et al. (2021) and
Karaivanov et al. (2021)). We first estimate time-series models of new infections for 8 selected
leading countries (Canada, Israel, the US, the UK, Chile, Uruguay, UAE and Bahrain). Then
we closely follow the approaches employed by Chernozhukov et al. (2021) and Karaivanov et al.
(2021) for cross-country panel data analysis, in which we investigate the impact of vaccination
on new cases and deaths, and people’s behavior. Member countries in OECD and European
Union that publicly release daily epidemiological data are considered. Bahrain and Uruguay are
added to the country panel to evaluate the differentiating effects of vaccines from China along
with Chile and Turkey that are already included in OECD.1
    The main findings from our empirical analysis are as follows. Firstly, progress in vaccination
with at least one dose is significantly negatively associated with the growth of new infections and
deaths. Larger reductions in both health outcomes are found for countries delaying the second
dose (Canada and the UK). Conditional on the first dose progress, full vaccination progress
does not give further reductions in new cases and deaths. These findings are consistent in
both time-series and panel data analyses. For the countries heavily relying on vaccines from
China, no reductions in health outcomes are found for first dose progress. Full vaccination
progress offers significant but weaker negative effects on new cases. Secondly, we find that
progress in vaccination induces people to be more mobile. As higher mobility leads to more
new infections and deaths, this indirect effect of vaccination offsets its direct effect. Lastly, our
counterfactual experiments for selected countries suggest that extending the interval between
  1
    Other countries that heavily rely on Chinese vaccines such as UAE and Seychelles are omitted in the panel
data analysis as they do not provide daily vaccination statistics.

                                                     3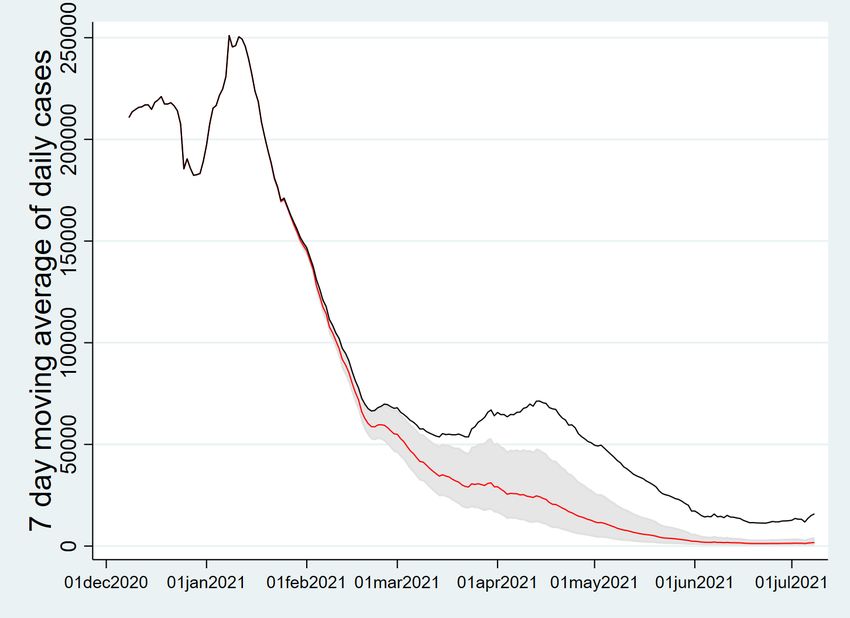
two doses substantially reduces weekly new cases and deaths.
    Our findings can be useful to draw policy implications for low and middle income countries
that fall behind in mass vaccination. According to McKensay and Company (2021), only 1% of
inhabitants in low income countries had been given at least one dose of vaccines as of July 14,
2021. Since the supply of mRNA-based vaccines and alternative less widely used vaccines will
continue to be limited, it is important to vaccinate as many people as possible with one dose
using secured vaccine stocks. Our analysis along side with the evidence found in the medical
literature suggests that extending the dosing interval is an effective strategy to mitigate the
transmission of COVID-19. Especially in low income countries, not only the supply of vaccines
is constrained but also the medical capacity to administer the vaccine doses, this strategy can
further help maximize the level of protection among the population more quickly. As observed in
many leading countries, the progress in single dose vaccination starts bending at a certain point.
Thus, countries can begin to vaccinate with the second doses as resources become available.
Public health measures are still very important amid vaccination progress as it can further
contain the spread of the virus by reducing mobility and potential interactions among people.
There is some caveat for the use of vaccines from China in our findings. It is shown that the single
dose vaccination is not enough to alleviate the spread of the virus. Therefore, the importance of
the second dose vaccination should be acknowledged if those vaccines are used in a significant
part of mass vaccination.
    The reminder of this paper is structured as follows. Section 2 describes the rationale behind
delaying the second dose idea. Section 3 provides empirical analysis using time series and panel
data models. Section 4 discusses the robustness of our findings. Section 5 presents counterfactual
experiments for selected countries using hypothetical vaccine allocations. Section 6 concludes.
Additional empirical results using alternative data frequency/model specifications and additional
counterfactual experiments are provided in the Appendix.

2    Rationale Behind Delaying the Second Dose
The UK government decided to extend the interval between the first and second doses of the
Pfizer-BioNTech vaccine up to 12 weeks at the end of December, 2020. Two letters sent to
health professionals (NHS (2020) and Department for Health and Social Care (2020)) lay out
the rationale for delaying the second dose. The main reason is that the great majority protection
comes after the first dose. The second does is important for duration of protection but in the
short run the additional protection afforded by the second dose is likely to be marginal. Later in
Canada, National Advisory Committee on Immunization (2021) recommended that the mRNA-
based vaccines and the AstraZeneca-Oxford vaccine should be given to as many people as possible
by extending the dosing interval up to 4 months.
    These decisions are based on three assumptions; 1. the first dose provides good enough
protection; 2. the protection after the first dose does not wane too quickly; 3. the delayed
second dose does not lower the efficacy of full vaccination. Under these assumptions, we conduct

                                                 4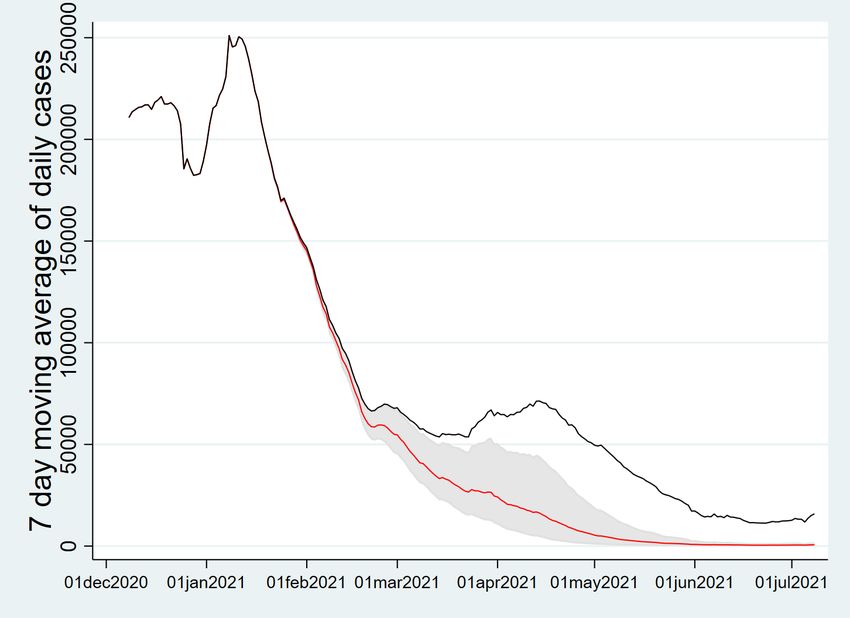
a very simple thought experiment without a complicated epidemiological model. Suppose that
a country secures an amount of mRNA-based vaccines that can inoculate 70% of the population
with one dose. There will be a second batch of vaccines delivered to this country in 12-16 weeks.
The country has to allocate its vaccine stocks to the first and second doses before the delivery
of the second batch. We consider two cases in which the level of protection from the first dose
substantially varies. In Case 1, the first dose provides 90% of vaccine efficacy (VE) which does
not wane in 12-16 weeks, whereas the first dose VE is only 50% in Case 2. In both cases, the
second dose offers 95% efficacy. Case 1 resembles the vaccine efficacy results for the mRNA-
based vaccines from the clinical trials.2 Case 2 supposes a situation where variants of the virus
substantially lower the efficacy of the first dose.

                                    Table 1: Vaccine allocations and

                           Case 1                                           Case 2
          (1st dose VE: 90%, 2nd dose VE: 95%)             (1st dose VE: 50%, 2nd dose VE: 95%)
          first dose    second dose      protection        first dose   second dose      protection
             70%             0%            63.0%              70%            0%            35.0%
             60%            10%            54.5%              60%           10%            34.5%
             50%            20%            46.0%              50%           20%            34.0%
             40%            30%            37.5%              40%           30%            33.5%
             35%            35%            33.3%              35%           35%           33.25%

     We compute the average protection levels among the population given different allocations
of the first and second doses in Table 1. In both cases, allocating all the vaccine stocks to the
first dose is the dominant strategy. Delaying the second dose is obviously much more effective
when the first dose gives stronger protection as shown in Case 1. The allocation strategy does
not matter if the one dose efficacy is as low as 42.5%. This simple calculation illustrates why
the longer interval between doses can be beneficial under supply constraints if the underlying
assumptions hold. Of course, there might be many other possibilities. For instance, the efficacy
of one dose before the second could wane in a short period of time. It is also possible that
the interval between the first and second doses also affects the overall efficacy level after the
final dose. Voysey et al. (2021) showed that the longer interval (≥ 12 weeks) between doses of
the AstraZeneca vaccine provided a greater efficacy than the shorter interval (< 6 weeks). A
recent study in the UK (Payne et al. (2021)) found that longer dosing intervals (6-14 weeks)
resulted in stronger immune responses than the standard regimen (3-4 weeks) for the Pfizer-
BioNTech vaccine. They also reported that robust protection maintained 3 weeks after the first
   2
    Polack et al. (2020) reported that the vaccine efficacy of the Pfizer-BioNTech vaccine between the first and
second doses is 52.4%. However, they used data collected during the first two weeks after the first dose in
their calculation. Skowronski and De Serres (2021) reanalyzed it using data submitted to the Food and Drug
Administration (FDA) and found that the first dose efficacy is 92.6% from two weeks after the first dose and
before the second dose. This is similar to the one dose efficacy of the Moderna vaccine (92.1%).

                                                       5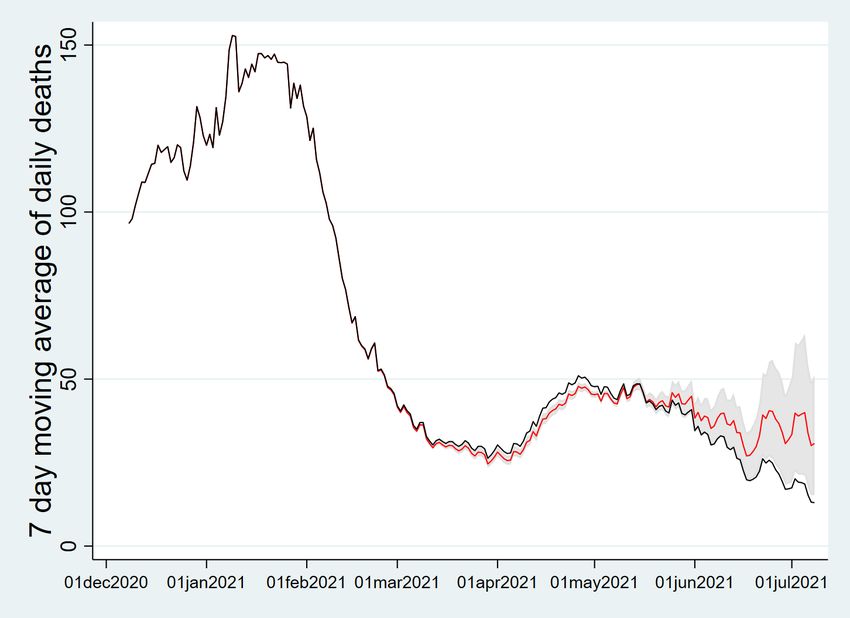
Figure 1: Vaccination strategies and overall protection over time - Case 1

                                        Strategy 1                                                              Strategy 2

                                      first dose                                                             first dose
              20 40 60 80

                                                                                      20 40 60 80
                                      second dose                                                            second dose
vaccination

                                                                        vaccination
              0

                                                                                      0
                            0    20     40    60    80   100 120                                    0   20     40     60    80   100 120

                                             date                                                                    date

                                        Strategy 3                                                       overall protection

                                                                                      80
                                      first dose                                                             Strategy 1
              20 40 60 80

                                      second dose                                                            Strategy 2
vaccination

                                                                                                             Strategy 3
                                                                        protection

                                                                                      60
                                                                                      40
                                                                                      20
              0

                                                                                      0

                            0    20     40    60    80   100 120                                    0   20     40     60    80   100 120

                                             date                                                                    date

dose. Another possibility is that one dose vaccine could provide stronger protection for people
previously infected. Angyal et al. (2021) reported that previously infected healthcare workers
in the UK showed strong immune responses after only one dose that are equivalent to responses
of people receiving two doses with no past history. Similar findings are shown in two recent
studies, Stamatatos et al. (2021) and Samanovic et al. (2021). In the latter study, the authors
find that the second dose did not offer any additional antibody responses for individuals with
prior exposure. This means that single dose vaccination can give full protection to a significant
part of the population for countries with a large number of cumulative cases.
    We also consider another thought experiment in which a country secures 100 doses per
hundred and will be inoculating the vaccine stocks over 120 days. On top of the limited supply
of vaccines, health care capacity is another constraint that limits the number of daily doses
administered. We assume that the country’s daily medical capacity allows to deliver 100/120
doses per hundred into its people’s arms. Three vaccination strategies on the dosing interval are
considered. In Strategy 1, the dosing interval is standard 3 weeks so the country delivers first
doses from day 1 and starts to inoculate the second doses on day 21. From this time, the stocks

                                                                    6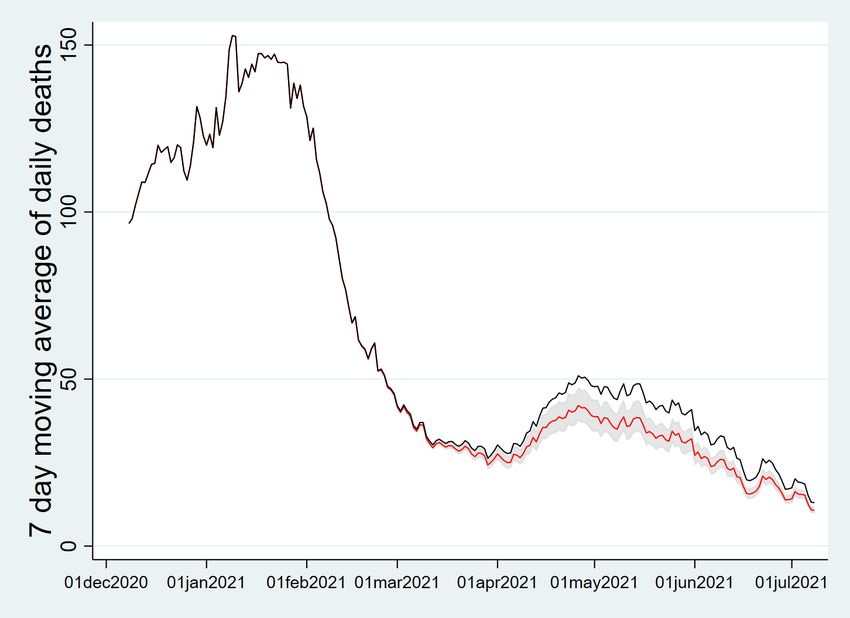
Figure 2: Vaccination strategies and overall protection over time - Case 2

                                        Strategy 1                                                              Strategy 2

                                      first dose                                                             first dose
              20 40 60 80

                                                                                      20 40 60 80
                                      second dose                                                            second dose
vaccination

                                                                        vaccination
              0

                                                                                      0
                            0    20     40    60    80   100 120                                    0   20     40     60    80   100 120

                                             date                                                                    date

                                        Strategy 3                                                       overall protection

                                                                                      80
                                      first dose                                                             Strategy 1
              20 40 60 80

                                      second dose                                                            Strategy 2
vaccination

                                                                                                             Strategy 3
                                                                        protection

                                                                                      60
                                                                                      40
                                                                                      20
              0

                                                                                      0

                            0    20     40    60    80   100 120                                    0   20     40     60    80   100 120

                                             date                                                                    date

are equally allocated to the first and second doses. In strategy 2 and 3, the dosing intervals are
3 months (90 days) and 4 months (120 days) respectively. We compute the overall protection
levels under these strategies for Case 1 and Case 2 described in Table 1. As shown in Figures
1-2, longer dosing intervals help achieve higher protection levels in the given time period. It is
obvious that Strategy 3 gives the best results in both cases followed by Strategy 2. The gaps
between strategies shrink as the difference between the first and second dose vaccine efficacy
increases.
     In sum, there is scientific evidence in the medical literature from which one can expect the
extending the dosing interval idea may work in practice. Allocating the available vaccine stocks
to the first doses could help maximize the level of protection in the population given the limited
supply. Furthermore, there might be healthcare capacity constraints. Focusing on the first doses
by extending the interval between doses could also help reach a higher level of protection more
quickly. Extending the dosing interval is particularly more effective when the first dose vaccine
efficacy is not too much lower than the second dose efficacy. This could be the case in low
income countries where a significant part of the population is previously infected. However, it

                                                                    7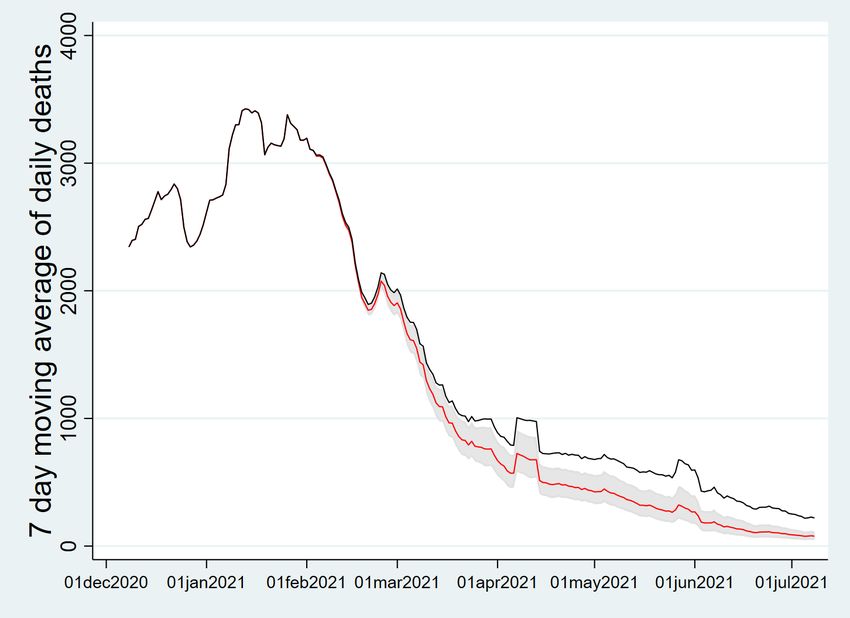
is still uncertain whether this strategy actually works in the real world setting. The previous
studies rely on small scale experiments or simulations. Therefore, it is important to investigate
the performances of different vaccination strategies using observable population level data across
countries employing different vaccination strategies.

3       Empirical Analysis
3.1     Data
Our empirical analysis mainly relies on the country level epidemiological data from Our World in
Data which is a collaborative project between the University of Oxford and Global Change Data
Lab. The world-wide country level database on many aspects of the COVID-19 pandemic is in its
GitHub repository (https://github.com/owid/covid-19-data/tree/master/public/data).
We use the daily counts of new cases, total cumulative cases, new tests, total cumulative tests,
vaccinated people with at least one dose per hundred, fully vaccinated people per hundred, total
vaccine doses administered per hundred. For government policy responses, we employ Con-
tainment and Health Index developed by the Oxford COVID-19 Government Response Tracker
(OxCGRT).3 There are some missing values in this data set. We impute the missing values using
linear interpolation for week days. If values in the weekends are missing, we take the previous
value to impute the missing values. We also use the country level data from Google COVID-19
Community Mobility Reports to take people’s behavioral responses into account. This data
shows movement trends over time in each country across different categories of places compared
to the baseline period (Jan 3 – Feb 6, 2020) before the pandemic. Following Karaivanov et al.
(2021), we construct a mobility index by calculating the arithmetic average of three mobility
(‘retail’, ‘grocery and pharmacy’, and ‘workplace’).
     We use the period from June 1, 2020 to July 8, 2021 for our analysis. The first wave of
the pandemic was almost over across most leading vaccination countries around the start date
chosen. At the beginning of the pandemic, many countries did not have enough testing-tracing
infrastructures so data would have missed a significant amount of infection cases. After the
first wave, most countries well equipped with testing-tracing facilities as one can see from the
substantially increased number of daily new tests. This period includes the up-to-date evolution
of the pandemic and the wide spread of the Delta variant first identified in India is captured in
some countries such as the UK and Israel.
     We estimate time-series and panel data models to investigate the effects of vaccination on
health outcomes controlling for policy and behavioral factors. In our time-series analysis, we
    3
     This index is built upon OxCGRT’s Stringency Index which is a composite measure based on nine policy
response indicators including school closures, workplace closures, public event bans, restrictions on gatherings,
public transit closure, public information campaigns, stay at home order, domestic and international travel bans
rescaled to a value from 0 to 100 (100 = strictest). Containment and Health Index further in includes testing
policy, contact tracing, face coverings, and vaccine availability. If policies vary at the sub-national level, the index
is shown as the response level of the strictest sub-region.

                                                           8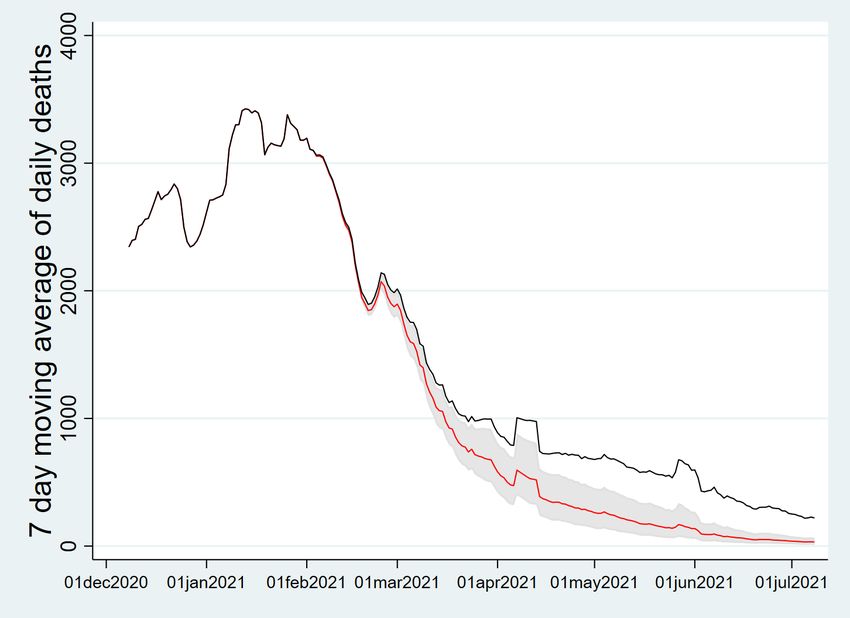
use a sample of leading vaccination countries. We select eight nations, four of which (Canada,
Israel, the US, and the UK) have used vaccine developed in the US and Europe and the others
(Chile, Uruguay, UAE, and Bahrain) have heavily been reliant on vaccines produced by China.4
These countries achieved highest vaccination rates in the world and relevant data are well kept
in a daily frequency. Then we employ a larger panel of high income countries which includes
OECD and EU members, Bahrain and Uruguay to further investigate the impact of vaccination
exploiting both time-series and cross country variations.
    We draw the trends in variables of primary interest (new confirmed cases per million, vacci-
nation progress, Containment and Health Index, and the mobility index) in Figure 3 for eight
selected leading countries we use in our time-series analysis. Among those countries mainly
using mRNA-based vaccines, only Canada and the UK extended the dosing interval up to 12-16
weeks. The other two countries recommended the standard regimen (3-4 weeks, the US allowed
up to a 6 week interval in an exceptional circumstance). As these countries adopted different
vaccination strategies, the effectiveness of mass vaccination could vary across countries. As dis-
played in the upper four panels (Canada, Israel, the US, and the UK), the daily new cases per
million (smoothed by a 7-day moving average) decreased as the vaccination program progressed.
The government policy index responded to the spike of new cases. All the four countries eased
restrictions as vaccination progressed and the case number declined. The mobility index showed
the opposite trend to the case number as it dropped in line with the surge in new cases and
recovered up as the case number decreased. It is not clear whether people’s behavior responded
to government restrictions or case numbers. Mass vaccination obviously leads to lower new
infections but at the same time government restrictions are eased and people’s mobility and
interactions increase. Therefore, the estimated effects of vaccination on new infections are likely
to be attenuated if policy and behavioral factors are not taken into account.
    Different trends were observed in the lower four panels (Chile, Uruguay, UAE, and Bahrain).
These countries have heavily relied on vaccines from China. These countries experienced the
surge of new cases while mass vaccination continued through the period at a steady pace in both
doses. Declines in the growth of new cases were seen only after very high vaccination rates were
achieved as well as stronger restrictions were implemented. These trends cast doubts on the
effectiveness of Chinese vaccines. Mobility and policy indexes responded to new cases similarly
to the way in the other countries in upper four panels. It may suggest that countries relying on
vaccines from China have to employ a different dosing strategy.
   4
    Canada, Israel and the US rely on mRNA-based vaccines (Pfizer-BioNTech and Moderna) to inoculate most
of the population (all for Israel). The UK has used both mRNA-based vaccines and the Astrazeneca-Oxford
vaccine. Chile, Uruguay, UAE and Bahrain have vaccinated a significant part of the population with vaccines
from China. According to Our World in Data, As of July 8, 2021, Chile administered 76.3% of its total doses with
Chinese vaccines (17.72 million doses of Sinovac and 0.47 million doses of CanSino out of total 23.93 million doses)
and Uruguay’s share of Sinovac is 73.6% (3.12 million doses of Sinovac out of total 4.24 million doses). UAE and
Bahrain also inoculated a majority of the population using the Sinopharm vaccine, yet the exact numbers are not
publicly available.

                                                         9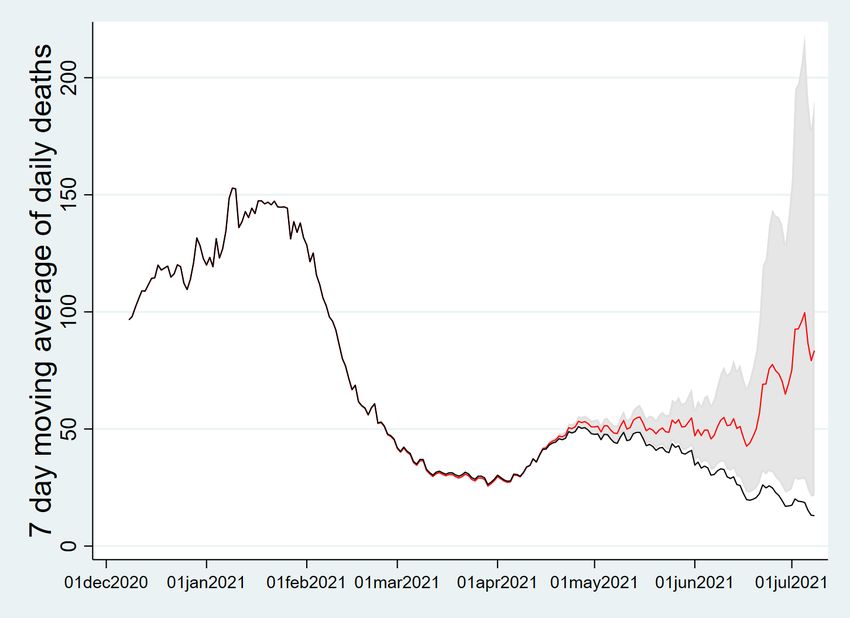
Figure 3: Trends in new cases, vaccination, policy and mobility indexes

Note: UAE does not publicly report daily numbers of first and second doses administered until early July, 2021.
                                                      10
3.2 Time series analysis
We select eight leading countries in mass vaccination (Canada, Israel, the US, the UK, Chile,
Uruguay, UAE, and Bahrain) and analyze the evolution of COVID-19 transmission using a stan-
dard time-series econometric framework. We estimate ARIMA models with exogenous variables
(ARIMAX) to estimate the effect of first and second doses on new infections. The outcome
variable is log of daily new cases. The number of people vaccinated per hundred (at least one
dose given) and the number of people fully vaccinated per hundred are included exogenous vari-
ables that are of primary interest. To control for test intensity and the weekend effect, log of
the number of new tests and a weekend dummy are also included.5 Government policies and
people’s behavioral changes in line with policies and the evolution of the pandemic are also taken
into account by including OxCGRT Containment and Health Index and the mobility index from
Google Community Mobility Reports.
As vaccination and other policy and behavioral responses do not immediately affect the
infections, it is important to choose appropriate lags for exogenous variables in the ARIMAX
models. For first and second vaccine doses, we choose 21-day and 7-day lags respectively. These
lags are chosen based on scientific evidence from clinical trials and real world outcomes. The
first dose of approved vaccines begins to provide substantial protection against infection after
2-3 weeks and at least 14 days are required to see protection starts (see National Advisory
Committee on Immunization (2021) for a detailed survey and Hunter and Brainard (2021) for
evidence from Israel on the Pfizer-BioNTech vaccine where the estimated vaccine effectiveness
reached its peak at day 21 after the first dose). 7 days after the second dose, the vaccine efficacy
further enhances as shown in Polack et al. (2020) and clinical trials. Medical studies such as
Hall et al. (2021) also used 21-day and 7-day thresholds for the first and second dose respectively
to evaluate the vaccine effectiveness. 14-day lags are chosen for the government policy index
and the mobility index as the same lags are used in Chernozhukov et al. (2021) and Karaivanov
et al. (2021) after careful investigations.
The order (p, d, q) of the ARIMAX model is selected by R’s forecast package (Hyndman
et al. (2020)) in which the command auto.arima chooses the optimal order based on various
criteria while ensuring that the chosen model numerically well-behaves. The outcome variable
for each country becomes stationary after the first difference so the order d is set at 1. Note
that all the exogenous variables are also first differenced in the estimation procedure. The
econometric model we estimate is
∆ log Yt =c + β1 ∆V 1t−21 + β2 ∆V 2t−7 + β3 ∆ log Tt + wkdt + ∆Pt−14 + ∆Mt−14 + nt , (1)
p
X q
X
nt = φi nt−i + εt − θi εt−i , (2)
i=1 i=1
where Yt is daily new cases, V 1t is population vaccinated with at least one dose per hundred, V 2t
is population fully vaccinated per hundred, Tt is log daily new tests, wkdt is a weekend dummy,
5
For Israel, UAE and Bahrain, the weekend dummy takes 1 if the days are either Friday or Saturday. For the
other countries, the dummy variable equals 1 when the days are either Saturday or Sunday.
11Figure 4: Daily new cases and fitted values
Canada Israel US UK
10
12
9
8
8
8
11
6
new_cases
new_cases
new_cases
new_cases
7
6
4
10
6
4
2
9
5
2
0
2021 2021 2021 2021
date date date date
Chile Uruguay UAE Bahrain
8.0
9.0
8.0
8
7.5
7.5
8.5
7.0
6
new_cases
new_cases
new_cases
new_cases
7.0
8.0
6.5
6.5
4
6.0
7.5
6.0
5.5
2
5.5
7.0
5.0
0
5.0
2021 2021 2021 2021
date date date date
Note: The dots are logs of the numbers of daily new cases. The red solid lines are fitted values by selected
ARIMAX models.
Pt is OxCGRT Containment and Health Index, and Mt is the mobility index. There certainly is
day-to-day noise in the data but the selected ARIMAX models fit this daily fluctuation very well
as shown in Figure 4. Note that Israel, the US, Chile and Uruguay exhibit very strong correlation
between V 1t and V 2t . The correlation coefficients are over 0.99 which means the estimates are
likely suffer from the multicollinearity problem. To avoid this issue, we also estimate models
with the number of total dose administered per hundred instead of first and second dose roll-outs
for these countries. UAE does not provide daily vaccination progress so the same treatment is
applied as well. The resulting regression residuals are all mean-zero stationary processes.
The estimation results are displayed in Table 2-3. For the countries that mainly vaccinate
their populations with widely approved vaccines developed in the US and Europe, the progress in
vaccination is negatively associated with the growth of new cases. It is noticeable that the share
of people vaccinated with at least one dose has particularly large negative effects on the spread of
COVID-19 for Canada and the UK. A 1% increase of the share of vaccinated people with at least
one dose leads to around 6.2% and 8.6% reductions in the daily growth of new cases respectively.
The two countries adopted longer dosing intervals between two doses. In both countries, the
12Table 2: ARIMA(p, d, q) model estimation results
Canada Israel US UK
(p, d, q) (2, 1, 3) (5, 1, 3) (3, 1, 3) (2, 1, 1)
weekend −0.104∗∗∗ −0.135∗∗∗ 0.007 −0.101∗∗∗
(0.031) (0.044) (0.009) (0.037)
new tests 0.060 0.557∗∗∗ 0.826∗∗∗ 0.0004
(0.048) (0.057) (0.057) (0.061)
first dose −0.062∗∗∗ −0.041 −0.018 −0.086∗∗∗
(0.018) (0.043) (0.041) (0.032)
second dose −0.011 −0.006 −0.020 0.040
(0.020) (0.045) (0.046) (0.033)
policy −0.031∗∗ −0.006 0.014∗ 0.004
(0.014) (0.005) (0.007) (0.013)
mobility 0.004 0.005 0.008 0.018
(0.007) (0.008) (0.007) (0.011)
Note: Standard errors are in parentheses. ∗ pTable 3: ARIMA(p, d, q) model estimation results
Chile Uruguay UAE Bahrain
(p, d, q) (2, 1, 4) (2, 1, 2) (0, 1, 3) (1, 1, 2)
weekend −0.074∗∗∗ −0.242∗∗∗ −0.014 −0.032∗∗
(0.010) (0.040) (0.017) (0.014)
new tests 0.686∗∗∗ 0.004 0.189∗∗∗ 0.001
(0.017) (0.005) (0.039) (0.003)
first dose 0.011 −0.020 −0.020
(0.010) (0.035) (0.023)
second dose −0.008 −0.041 −0.012
(0.010) (0.040) (0.010)
total dose −0.013∗∗
(0.006)
policy −0.007 0.012 0.011 0.009
(0.004) (0.010) (0.007) (0.007)
mobility 0.004∗ −0.003 −0.006 −0.011
(0.002) (0.011) (0.013) (0.012)
Note: Standard errors are in parentheses. ∗ pcounterparts and the AstraZeneca-Oxford vaccine.6
Our results from time-series analysis suggest that extending the interval between first and
second doses can be an effective strategy for the vaccines developed in the US and Europe.
Larger negative effects of vaccination progress are found in the countries adopting this strategy.
It is not clear whether this strategy works for vaccines from China. As shown in the clinical
trials, these vaccines have a lower vaccine efficacy even with two doses than a single dose of
mRNA-based vaccines. Therefore, it is likely not a more effective strategy so countries relying
on these vaccines should be focusing on fully vaccinating the population.
We so far only exploit variations in vaccination progress over time. The purpose of estimating
time-series models is to obtain some descriptive evidence how the choice of the dosing interval
and types of vaccines matter to contain the spread of COVID-19. To investigate causal relation-
ships between vaccination and new infections, we will further exploit cross-country variations in
vaccination, policies and mobility using a large country panel.
3.3 Panel Data Analysis
We use OECD and EU member countries to construct our country panel, adding Bahrain and
Uruguay in order to examine the effect of vaccines from China. Countries that do not publish
daily COVID-19 related statistics are excluded. In total, there are 37 countries in our data set.7
We closely follow the estimation strategies used in Chernozhukov et al. (2021) and Karaivanov
et al. (2021). Let Cit denote the cumulative number of confirmed cases in country i at time t.
We define ∆Cit as the 7-day new COVID-19 cases reported at time t:
∆Cit := Cit − Ci,t−7 , (3)
where ∆ denotes the difference operator over a week between t and t−7. Our dependent variable
YitC = ∆ log (∆Cit ) = log (∆Cit ) − log (∆Ci,t−7 ) (4)
approximates the weekly growth rates in new cases in country i from t − 7 to t. Similarly, we
denote ∆ log (∆Tit ) as the 7-day growth rates in new tests with the cumulative number of tests,
Tit .
To analyze the impact of first and second dose vaccination, government policy responses,
and people’s behavioral changes on YitC , we estimate
YitC = α0i + αV 1 V 1i,t−21 + αV 2 V 2i,t−7 + αP Pi,t−14 + αM Mi,t−14
+αC1 ∆ log (∆Ci,t−14 ) + αC2 log (∆Ci,t−14 ) + αT ∆ log (∆Tit ) + εC
it , (5)
6
World Health Organization (WHO) approved the Sinovac vaccine for emergency use and stated that the
vaccine efficacy of this vaccine is 51% for symptomatic infection.
7
Included countries are Australia, Austria, Belgium, Bulgaria, Bahrain, Canada, Switzerland, Chile, Colombia,
Germany, Denmark, Spain, Estonia, Finland, France, the UK, Greece, Croatia, Hungary, Israel, Italy, Japan,
South Korea, Lithuania, Luxembourg, Latvia, Mexico, Malta, Norway, New Zealand, Poland, Portugal, Romania,
Slovenia, Turkey Uruguay, and the US.
15where V 1it is the number of people vaccinated with at least one dose per hundred, V 2it is the
number of fully vaccinated people per hundred, Pit and Mit are policy and behavioral variables.
We use the same lag specifications for the exogenous variables as in our time series analysis. For
deaths growth as the outcome, YitD = ∆ log (∆Dit ), we use the lags 14 days behind those in the
case equation:
YitD = β0i + βV 1 V 1i,t−35 + βV 2 V 2i,t−21 + βP Pi,t−28 + βM Mi,t−28
+βD1 ∆ log (∆Di,t−28 ) + βD2 log (∆Di,t−28 ) + εD
it , (6)
following Karaivanov et al. (2021).
Our regression equations are motivated by a variant of the SIRD model introduced in Cher-
nozhukov et al. (2021) where new infections are only partially detected via testing. Let S, I, R
and D denote the numbers of susceptible, infected, recovered, and deceased individuals in a given
state. Each of these variables is a function of time. We modify the model by adding vaccination
factors, V 1 and V 2. We assume that vaccinated individuals obtain immunity against infection
at the rates δ1 and δ2 from the first and second doses, with which they exit the susceptible class
and enter the recovered class. The laws of motion for these variables are specified as
S (t)
Ṡ (t) = − δ1 V˙1 (t − 21) + (δ2 − δ1 ) V˙2 (t − 7) − β (t) I (t)
N
S (t)
I˙ (t) = β (t) I (t) − γI (t) ,
N
Ṙ (t) = (1 − κ) γI (t) + δ1 V˙1 (t − 21) + (δ2 − δ1 ) V˙2 (t − 7) ,
Ḋ (t) = κγI (t) ,
where N is the population, β (t) is the rate of infection spread between St−` and It−` , γ is the
rate of recovery or death, and κ is the probability of death conditional on infection. The total
number of confirmed cases, Ct , evolves as
τ (t)
Ċ (t) = τ (t) I (t) = Ḋ (t) ,
κγ
where τj (t) is the rate that infections are detected. Note that we only observed C (t) and D (t),
but not I (t). The unobserved I (t) can be eliminated in two ways:
C̈ (t) S (t) τ̇ (t) D̈ (t) S (t)
= β (t) − γ + , = β (t) − γ.
Ċ (t) N τ (t) Ḋ (t) N
We note that the rate of infection, β (t), can be affected by individual behavior and observed
policies through social distancing and lockdown. We specify S(t) N β (t) as a linear function of
vaccinations, policy, behavioral, information, and confounders other than testing.
We estimate our regression equations with country fixed effects to account for country-specific
heterogeneity. We do not include week or month fixed effects as each country experienced
heterogeneous evolution of the pandemic. Including country-specific time fixed effects results in
16Table 4: The direct effect of behavior, policy, and vaccinations on confirmed cases
Dependent variable: ∆ log ∆Ct
(1) (2) (3) (4)
∆ log ∆Ct−14 0.1102∗∗∗ 0.1056∗∗ 0.0901∗∗ 0.0908∗∗
(0.0395) (0.0394) (0.0350) (0.0343)
log ∆Ct−14 -0.0374∗∗∗ -0.0403∗∗∗ -0.1496∗∗∗ -0.1509∗∗∗
(0.0077) (0.0077) (0.0214) (0.0214)
V1,t−21 -0.0074∗∗∗ -0.0077∗∗∗ -0.0173∗∗∗ -0.0185∗∗∗
(0.0021) (0.0022) (0.0043) (0.0041)
V2,t−7 0.0029 0.0024 0.0038 0.0066
(0.0025) (0.0029) (0.0057) (0.0064)
CHN
V1,t−21 0.0149∗∗∗ 0.0108
(0.0033) (0.0087)
CHN
V2,t−7 -0.0138∗∗∗ -0.0180∗∗
(0.0042) (0.0074)
Pt−14 -0.0020 -0.0019 -0.0027∗ -0.0027∗
(0.0012) (0.0013) (0.0015) (0.0015)
Mt−14 0.0052∗∗∗ 0.0053∗∗∗ 0.0101∗∗∗ 0.0098∗∗∗
(0.0012) (0.0012) (0.0014) (0.0013)
∆ log ∆Tt 0.5094∗∗∗ 0.5064∗∗∗ 0.4090∗∗∗ 0.4079∗∗∗
(0.1775) (0.1767) (0.1499) (0.1496)
Country fixed effects yes yes yes yes
Country specific trend in days no no quadratic quadratic
R2 0.2838 0.2868 0.3987 0.3999
Adjusted R2 0.2834 0.2864 0.3953 0.3964
Number of countries 37 37 37 37
Obs. per country 382 382 382 382
Note: Standard errors in parentheses are clustered at the country level.
∗ ∗∗ ∗∗∗
p < 0.1, p < 0.05, p < 0.01
17Table 5: The direct effect of behavior, policy, and vaccinations on deaths
Dependent variable: ∆ log ∆Dt
(1) (2) (3) (4)
∆ log ∆Dt−28 0.0584∗∗ 0.0560∗ 0.0574∗∗ 0.0567∗∗
(0.0281) (0.0280) (0.0258) (0.0259)
log ∆Dt−28 -0.0429∗∗∗ -0.0479∗∗∗ -0.1308∗∗∗ -0.1308∗∗∗
(0.0096) (0.0085) (0.0112) (0.0112)
V1,t−35 -0.0096∗∗∗ -0.0093∗∗∗ -0.0125∗∗∗ -0.0132∗∗∗
(0.0021) (0.0023) (0.0040) (0.0041)
V2,t−21 0.0036 0.0014 0.0040 0.0061
(0.0029) (0.0033) (0.0043) (0.0046)
CHN
V1,t−35 0.0169∗∗∗ 0.0045
(0.0034) (0.0076)
CHN
V2,t−21 -0.0116∗∗ -0.0097
(0.0050) (0.0059)
Pt−28 -0.0008 -0.0005 -0.0013 -0.0013
(0.0014) (0.0015) (0.0013) (0.0013)
Mt−28 0.0057∗∗∗ 0.0057∗∗∗ 0.0077∗∗∗ 0.0075∗∗∗
(0.0016) (0.0015) (0.0016) (0.0015)
Country fixed effects yes yes yes yes
Country specific trend in days no no quadratic quadratic
R2 0.0966 0.1016 0.1747 0.1749
Adjusted R2 0.0962 0.1010 0.1698 0.1699
Number of countries 37 37 37 37
Obs. per country 368 368 368 368
Note: Standard errors in parentheses are clustered at the country level.
∗ ∗∗ ∗∗∗
p < 0.1, p < 0.05, p < 0.01
18too many parameters to estimate, which lead to imprecise estimates. Instead, country-specific
time trends are included to control for heterogeneous trends across countries. We consider
quadratic time trends as a baseline specification. Alternative specifications (linear and cubic
time trends) are also considered and our main findings hold under those specifications as shown
in Appendix A. To examine the potentially distinct effects of vaccines from China, we add a
Chinese vaccine dummy for Chile, Uruguay, Turkey and Bahrain.8 The results are displayed in
Tables 4-5 for new infections and deaths respectively. It is notable that first dose vaccination
progress is significantly negatively associated with the weekly growth rates of new infections and
deaths at the 99% confidence level across all the specifications considered. With no time trends,
the estimates suggest that a 1% increase in the share of vaccinated people with at least one dose
leads to around 0.77% reduction in the weekly case growth rate and around 0.93% reduction in
the weekly death growth rate. When quadratic time trends are included, the magnitudes of first
does vaccination estimates expand to 1.85% and 1.32% for new cases and deaths respectively
and still highly significant. Second dose vaccination progress is not significantly different from
0 for both health outcomes. On the contrary, first dose progress in countries relying on Chinese
vaccines is not effective for reducing both case and death counts. Only full vaccination progress
leads to significant but smaller reductions in new cases and deaths but this effect disappears
for deaths when quadratic time trends are controlled for. These findings are in line with those
found in our time-series analysis.
The signs and magnitudes of the other coefficient estimates are in general very consistent
across the specifications. It is obvious to see that the weekly growth rate of new tests is positively
related to the growth of new cases. Government policies are negatively associated with weekly
case growth rate, whereas the mobility index is positively associated with both cases and deaths.
Note that government policy and mobility indexes are insignificant in our time series analysis for
each country. These factors are now significant when time trends are taken into account because
we further exploit the cross-country variations in government policies and people’s behavioral
changes. Our results mean that less stringent policy measures and more mobile people can be
translated into a higher β(t) in the SIRD model, which results in more cases and deaths.
We also examine how the evolution of pandemic, policies and vaccination affect people’s
mobility which is related to social distancing behaviors by estimating the following equation:
Mit = γ0i + γM Mi,t−7 + γdC ∆ log ∆Cit + γC log ∆Cit + γd1 ∆V 1it + γd2 ∆V 2it
+γ1 V 1i,t−7 + γ2 V 2i,t−7 + γdP ∆Pit + γP P i,t−7 + εM ob
it . (7)
This regression equation includes the weekly case growth rate and the number of weekly new
infections as information variables. We estimate the regression coefficients using many different
specifications, all of which include country fixed effects. Time trends are omitted as they are in
8
Turkey stared its mass vaccination program using the Sinovac vaccine from China. According to Bridge
Beijing (https://bridgebeijing.com/), Turkey has received 31.4 million doses of the Sinovac vaccine as of Sep 6,
2021. Turkey shifted to the Pfizer-BioNTech vaccine as the delivery of the Sinovac doses kept delayed but until
Jul 8, 2021, the Sinovac vaccine accounted for more than a half of total inoculated vaccine doses.
19Table 6: The direct effect of behavior, policy, and vaccinations on mobility
Dependent variable: Mt
(1) (2) (3) (4)
Mt−7 0.7635∗∗∗ 0.7637∗∗∗ 0.7469∗∗∗ 0.7472∗∗∗
(0.0220) (0.0219) (0.0239) (0.0239)
∆ log ∆Ct 0.4354∗ 0.4702∗
(0.2520) (0.2560)
log ∆Ct -0.7026∗∗∗ -0.6950∗∗∗
(0.0849) (0.0924)
∆ log ∆Dt -0.0742 -0.0624
(0.1715) (0.1717)
log ∆Dt -0.8039∗∗∗ -0.7976∗∗∗
(0.1150) (0.1211)
∆V1t 0.5839∗∗∗ 0.6642∗∗∗ 0.5260∗∗∗ 0.5937∗∗∗
(0.1260) (0.1623) (0.1266) (0.1636)
∆V2t 0.2641∗ 0.3941∗∗ 0.3033∗∗ 0.4396∗∗
(0.1316) (0.1636) (0.1439) (0.1865)
V1,t−7 0.0494 0.0314 0.0377 0.0204
(0.0324) (0.0372) (0.0318) (0.0373)
V2,t−7 -0.0084 0.0032 0.0120 0.0220
(0.0349) (0.0379) (0.0315) (0.0346)
∆V1tCHN -0.3956∗ -0.3474
(0.2144) (0.2233)
∆V2tCHN -0.4834∗ -0.5110∗
(0.2568) (0.2762)
CHN
V1,t−7 0.0693 0.0736
(0.0676) (0.0641)
CHN
V2,t−7 -0.0380 -0.0414
(0.0742) (0.0652)
∆Pt -0.3450∗∗∗ -0.3464∗∗∗ -0.3583∗∗∗ -0.3590∗∗∗
(0.0449) (0.0448) (0.0428) (0.0428)
Pt−7 -0.1120∗∗∗ -0.1141∗∗∗ -0.1028∗∗∗ -0.1049∗∗∗
(0.0173) (0.0175) (0.0174) (0.0175)
Country fixed effects yes yes yes yes
Time effects no no no no
R2 0.8363 0.8367 0.8366 0.8369
Adjusted R2 0.8362 0.8366 0.8365 0.8368
Number of countries 37 37 37 37
Obs. per country 396 396 396 396
Note: Standard errors in parentheses are clustered at the country level.
∗ ∗∗ ∗∗∗
p < 0.1, p < 0.05, p < 0.01
20general insignificant (Results with country specific linear time trends are provided in Appendix
A). In an alternative specification, we replace the weekly case number and growth rate with
the weekly death counts and growth rates. Table 6 displays the estimation results. Most
explanatory variables are highly significant across all the specifications. The values of R-squared
are close to 0.84 for all the specifications. Our results imply that vaccination and government
policies have large effects on people’s behaviors. Weekly progresses in first dose and second
dose vaccination lead to large observed increase in people’s mobility. When the weekly case
counts, weekly case growth rates, and the Chinese vaccine dummy are included, a 1% weekly
growths in first dose and second dose vaccination increase the mobility index by 0.66 and 0.39
respectively. These results are consistent with findings in Andersson et al. (forthcoming). Using
Swedish survey data collected before vaccination launched (Dec 10-13, 2020), they show that
providing vaccine information, such as the safety, effectiveness, and availability, reduces peoples’
voluntary social distancing. On the other hand, more stringent government responses lead to
a substantial reduction in people’s mobility. Information also matters as people’s mobility is
negatively associated with both weekly growths and counts of new infections and deaths. The
magnitudes of estimates for the weekly growth and counts of deaths are larger than those for new
cases. This indicates that people responded more sensitively to new death counts than new case
numbers, which conforms to Chernozhukov et al. (2021). Interestingly, no significant increases
in mobility due to vaccination are observed in countries relying on vaccines from China. This
may be related to the perceived credibility of the effectiveness of those vaccines.
The magnitudes of vaccination and policy effects are not very sensitive whether or not
we include cases or deaths as information variables and across different specifications. As we
show in Tables 4-5, people’s mobility in the past is significantly positively associated with new
infections and deaths. Therefore, there is an indirect effect of vaccination, which offsets the direct
effect of vaccination on the transmission of COVID-19 by inducing people to be more mobile.
Many leading countries have loosened public health measures amid high vaccination rates. Our
findings imply that this could be a risky move as loosened restrictions and vaccination progress
collectively pushes mobility up. Public health measures are still a key to containing the spread
of the virus by restraining people’s mobility and social interactions.
4 Robustness checks
4.1 Variants of Concerns
Each country suffers from different variants of concerns some of which are known to be more
easily transmitted and more fatal. We try to control for this by using country fixed effects
and country specific time trends. With or without time trends, our estimates remain with the
same signs across different model specifications. In the period of our analysis, a number of
countries such as the UK and Israel experienced another wave due to the Delta variant. When
we exclude the period the new wave, the estimates still remain very similar. As the Delta variant
21is becoming the most dominant variant in many countries, there may be a structural break in the
evolution of the pandemic. The period after the rise of the Delta variant is an avenue of future
research. As far as a single dose of approved vaccines is still highly effective against the variant
(although somewhat weaker than against the original strain), the policy implications drawn from
our findings can be valid. The evidence on single dose effectiveness of approve vaccines against
symptomatic infection is mixed in the recent literature. Lopez Bernal et al. (2021) report that
one dose effectiveness against the Delta variant is much lower for Pfizer-BioNtech (35.6%) and
AstraZeneca-Oxford vaccines (30%) than the effectiveness with two doses (Pfizer-BioNtech: 88%,
AstraZeneca-Oxford: 67%) using data from England. On the contrary, Nasreen et al. (2021)
find much higher vaccine effectiveness with one dose against the Delta variant (Pfizer-BioNtech:
56%, Moderna: 72%, AstraZeneca-Oxford: 67%) using Canadian data.
One reason why the single dose effectiveness differs in the two countries would be the numbers
of cumulative cases. The total case number in the UK is much higher than that in Canada.
As researchers of US CDC suggest in Reese et al. (2021), there is a significant of proportion
of actual infections that was undetected.9 Therefore, a much larger portion of unvaccinated
population in the UK is likely to have prior exposure than Canada. People who have been
infected developed natural protection against the virus so comparing the vaccinated to a more
immune control group may have resulted in the lower single dose vaccine effectiveness in the
UK. For unvaccinated individuals with no previous infection, it may be still the case that one
dose vaccination provides substantial protection against the Delta variant. Furthermore, vaccine
effectiveness against severe illness (hospitalization or death) caused by the Delta variant is shown
to be much higher than for symptomatic infection after partial vaccination. Nasreen et al. (2021)
estimate that vaccine effectiveness against severe outcomes after single dose inoculation of Pfizer-
BioNTech, Moderna, and AstraZeneca-Oxford vaccines was 78%, 96%, and 88% respectively. A
technical report by Public Health England (Stowe et al. (2021)) also strongly agrees with the
Canadian results on vaccine effectiveness against hospitalization, which was 94% for the Pfizer-
BioNTech vaccine and 71% for the AstraZeneca-Oxford vaccine only after dose 1. This implies
that maximizing the number of at least partially vaccinated people is an effective strategy to
prevent worse health outcomes, which are of primary policy interest.
4.2 Alternative lags
We conduct sensitivity analysis with different lag specifications for vaccination centered around
the baseline lags of 21 and 7 days for first dose and second dose progress respectively. In the
alternative specifications, we use the baseline lags ± d (d = 1, 2, 3), for both vaccination variables.
The results are provided in Figures 5-6. All the estimates across the alternative lag specifications
are consistent with our baseline findings. The magnitudes of estimates slightly vary with lags
and the coefficient estimates of first dose progress always remain highly significant. The effect
of the share of vaccinated people with at least one dose becomes slightly larger when the lag
9
Reese et al. (2021) estimate that only 1 of every 7.1 non-hospitalized illness might have been detected.
22employed is longer. Full vaccination progress is insignificant with all the alternative lags. The
effects of vaccines from China are not sensitive to the lag specifications.
4.3 Alternative periods
We also estimate our regression coefficients for alternative initial and end dates. Firstly, we
change the initial date from June 1 to July 1, 2020 so that the first month in the full period is
omitted. During the omitted period, the cases numbers were stable in many countries. Secondly,
we exclude the data after May 31, 2021 from the full period. In the omitted period, some
countries experienced a surge in new cases due to the spread of the Delta variant. The results
are reported in Table 7. In the first sub-period (July 1, 2020 - July 8, 2021), the coefficients
estimates remain very similar to Table 4. The magnitude of the effect of first dose progress
shrinks in the second sub-period (June 1, 2020 - May 31, 2021) but it is still negative and
significant. It would be naturally the case because most countries in our sample did not achieve
high vaccination rates to effectively contain the transmission until May 31, 2021.
4.4 Data frequency
A few countries (Costa Rica, Cyprus, Iceland, and the Netherlands) release key epidemiological
variables in a weekly frequency. We re-estimate our regression coefficients by aggregating the
daily level data to the weekly level to include these countries. In total 41 countries are included
in our weekly country panel where Turkey is also considered as a country relying on Chinese
vaccines. The results are almost identical to our findings in the daily frequency estimation in
terms of the magnitudes and significance of coefficient estimates. We provide the results in
Appendix B.
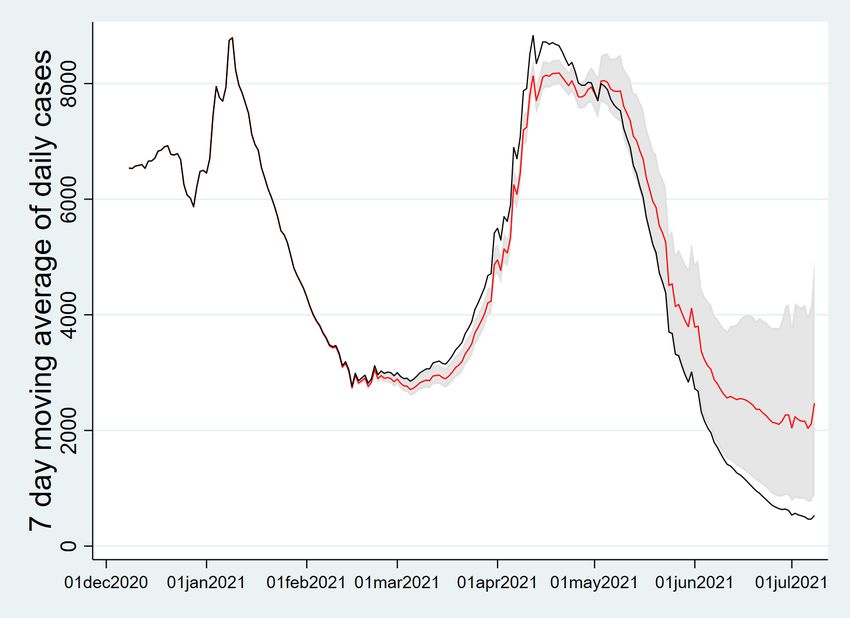
5 Counterfactual vaccine allocations
We use our estimates in Tables 4-5 to evaluate counterfactuals where the actual vaccine al-
locations between first and second doses are replaced by alternative hypothetical allocations.
Saad-Roy et al. (2021) consider an immuno-epidemiological model with a continuous spectrum
for interdose period between two vaccines, and find that delaying second vaccine doses is benefi-
cial in the short term. In line with them, to investigate the effect of the spacing between doses,
we assume that the total amount of available vaccines does not change:
V 1it + V 2it = V 1∗it + V 2∗it ,
where V 1∗it and V 2∗it are sequences of counterfactual first and second dose vaccination for country
i. As the interdose period increases, spreading of first doses is faster.
We focus on Canada and the US for our counterfactual experiments as both countries have
mainly relied on the mRNA-based vaccines but have used very different dosing intervals. When
it comes to the US, we extend the dosing interval to 8 weeks resulting faster growth of first dose
23You can also read