Vanadium extraction from petroleum coke
←
→
Page content transcription
If your browser does not render page correctly, please read the page content below
E3S Web of Conferences 266, 08002 (2021) https://doi.org/10.1051/e3sconf/202126608002
TOPICAL ISSUES 2021

 Influence of leaching parameters on the
 vanadium extraction from petroleum coke
 A.A. Kudinova, N.K. Kondrasheva, and V.A. Rudko
 Department of Chemical Technology and Energy Processing, Faculty of Mineral Raw Materials
 Processing, Saint Petersburg Mining University, Saint Petersburg, Russia

 Abstract: More than 60 trace elements, including rare metals, can be
 found in heavy oils. The most valuable component of oils and petroleum
 products is vanadium. It is used as an alloying agent to create extra strong
 steel, as a cathode for lithium-ion batteries, and also as a catalyst in the
 chemical industry. Nowadays studies of various methods for extracting
 vanadium from heavy oils and petroleum products are actively carried out.
 This work presents the method of alkaline and acid leaching of vanadium
 from petroleum coke and also results of the examination of influence of
 factors such as the duration of the process (0.5, 1.5 and 2.5 h) and the ratio
 of solid and liquid phases (1:2, 1:3 and 1:4). The highest yield of vanadium
 80% is observed using sulfuric acid with the process duration is 1.5 hours
 and the ratio S/L = 1:4

 1 Introduction
 In connection with the depletion of light oil reserves, the question of processing of heavy
 metal oils arose [1]. However, the metals contained in oils adversely affect the quality of
 the obtained products, deactivate catalysts for oil refining processes, and cause corrosion of
 the equipment[2-4]. At the same time, trace elements are contained in oils are valuable
 incidental components, of which vanadium is an important strategic metal, due to it use as
 an alloying additive to high-strength steel, a cathode for lithium-ion batteries, catalysts,
 etc.[5].
 Vanadium is the single element that is currently extracted from heavy oils, but only
 abroad. This is due to the fact that the content of vanadium in heavy oils is comparable or
 higher than its content in the ores from which it is extracted. Therefore, the process of
 extracting vanadium from oil can become more cost effective, and it can also provide
 products for metallurgical production because its demand for vanadium is constantly
 growing[4]. In addition, extraction of vanadium in the form of porphyrin complexes by
 extractive methods is also important for the petrochemical industry [6-8].
 About 95% of all vanadium amount gets concentrated in petroleum coke during the
 coking process [9,10], so it a promising raw material for the recovery of vanadium. Spent
 catalysts and ash from boilers of thermoelectric power plants using fuel oil and petroleum
 coke can also serve as raw materials for vanadium recovery. A large number of studies
 have been carried outon the extraction of vanadium using ash from thermal power plants as
 a raw material [11-16] and few research is devoted the study of coke as a raw material for
 the recovery of vanadium [17,18].

© The Authors, published by EDP Sciences. This is an open access article distributed under the terms of the Creative Commons
Attribution License 4.0 (http://creativecommons.org/licenses/by/4.0/).
E3S Web of Conferences 266, 08002 (2021) https://doi.org/10.1051/e3sconf/202126608002
TOPICAL ISSUES 2021

 V.A. Rudko [17] studied the influence of the ratio of the solid (coke) to the liquid (acid)
 phase, as well as the time of the process on the yield of vanadium in the process of acid
 leaching. To carry out the process, petroleum coke was ground to a particle size of 100 μm.
 Concentrated and diluted sulfuric acid and a mixture of concentrated nitric and sulfuric
 acids in a 1:1 mass ratio were used as leaching agents. It was shown that with a decrease in
 the ratio of the solid and liquid phases from 1:3 to 3:1, the degree of extraction of vanadium
 also decreases.
 M.R. Tavakoli [18] studied the leaching process using vanadium pent oxide as the raw
 material. Sulfuric acid and sodium hydroxide were used as leaching agents. It was shown
 that a decrease in the pH and temperature of the process for acid leaching leads to an
 increase in the solubility of vanadium. The opposite data was obtained for alkaline
 leaching. Moreover, the solubility of vanadium in sulfuric acid solution was found to be
 higher than in solutions of nitric and hydrochloric acids. This is due to the formation of a
 complex of the vanadylion with sulfate.
 Y.L. Zhang [19] studied the effect of sodium sulfate on the leaching process. Prior to
 the experiment, the coke was ground and sieved to the particle size range of 74 μm. It was
 shown that a small amount of sodium sulfate (about 0.7 g) increases the leaching rate.
 Thermodynamic calculations show that it is most advantageous to carry out the leaching
 process with a dilute sodium hydroxide solution as a reagent in order to extract vanadium.
 However, according to experimental data, the highest yield of vanadium is obtained when
 using concentrated sulfuric acid. This discrepancy between calculations and experimental
 data can be explained by the influence of factors that thermodynamics does not take into
 account, for example, the difference in the passage of the reagent into the pores of the coke.
 Thereby, in this work, we compared the effect of acid and alkali agents on the extraction
 of vanadium from petroleum coke by the leaching method. We used different parameters of
 the process, such as the ratio of liquid and solid phases and the duration of the process, to
 the compare the vanadium recovery from petroleum coke.

 2 Experimental

 2.1 Materials
 An industrially obtained sample of petroleum coke from a mixture of West Siberian oils
 was taken from a delayed coking unit.
 The main technological parameters of the delayed coking process were:
 • Coking temperature at the reactor’s inlet: 505 °C
 • Coking pressure in the reactor: 0.35 MPa (excessive)
 • The load factor for raw materials: 1.2.
 The materials balance of the delayed coking process is presented in Table 1:
 Table 1. The materials balance of the delayed coking process.
 Input Output
 Atmospheric residue 85.0 Gas 5.4
 HGOCC * 15.0 Petrol 9.8
 Lightgasoil 28.5
 Heavy gasoil 29.9
 Coke 27.3
 Total: 100.0 Total: 100.0
 *HGOCC – stands for heavy gasoil catalytic cracking
 Quality indicators of petroleum coke are indicated below.
 • The yield of volatile substances: 7.8%

 2
E3S Web of Conferences 266, 08002 (2021) https://doi.org/10.1051/e3sconf/202126608002
TOPICAL ISSUES 2021

 • Ash content: 0.11%
 • Content, %, of other components: S - 1.6911, V - 0.0198, Si - 0.0010, Fe - 0.0009.

 2.2 Leaching of vanadium from petroleum coke
 Experiments on the leaching of vanadium from petroleum coke were carried out in stainless
 steel reactors 60 mm high and of 40×30 mm in diameter. Each reactor was charged with 1 g
 of petroleum coke (particle size of about 0.1 mm) and the necessary amount of leaching
 agent (acids or alkali) were placed in each reactor. Then the reactors were placed in a
 drying oven and kept at the temperature of 100 ℃ from 0.5 to 2.5 hours.
 NaOH 10% and H2SO4 12% were used as leaching agents. Acid or alkali was added to
 the coke so that the ratio of solid and liquid (S/L) phases was 1:2, 1:3 and 1:4.
 After the leaching process petroleum coke was filtered using a “white tape” filter paper
 and washed with 30-40 ml of water. Then it was dried in a drying oven at the temperature
 of 110 ℃ to constant weight.

 2.3 Photometric analysis of the solutions after leaching
 Analysis of the solutions after leaching was carried out using a PE-5400 UV
 spectrophotometer (LLC “ECROSCHIM”). The degree of vanadium extraction from
 petroleum coke was determined according to GOST 10364 "Oil and petroleum products.
 Vanadium determination method."
 40 ml of the solution after leaching, 2 ml of diluted sulfuric acid 1:1, 5 ml of diluted
 phosphoric acid, and 2.5 ml of sodium tungstate solution were placed in a 100 ml beaker.
 After adding each reagent, the contents of the beaker were mixed by shaking. The resulting
 solution was heated to 40–70 ℃ and then cooled down to room temperature. Then the
 solution was quantitatively transferred into a 50 ml volumetric flask and adjusted to the
 mark with distilled water. The solution was left for 60 minutes.
 A control solution was prepared for photometric analysis. 2 ml of sulfuric acid 1:1, 5 ml
 of diluted phosphoric acid, and 2.5 ml of sodium tungstate solution were placed in a 50 ml
 flask. The resulting solution was adjusted to the mark with distilled water. The optical
 density of the solution after leaching was determined relative to the control solution. The
 mass of vanadium in mg contained in 50 ml of the solution was determined according to the
 calibration plot (Figure 1).

 1,4

 1,2
 mg in 50 ml of solution

 1,0
 concentration of V,

 0,8

 0,6

 0,4

 0,2

 0,2 0,4 0,6 0,8 1,0 1,2 1,4
 optical density

 Fig. 1. Calibration plot for determining the content of vanadium in the solution.

 3
E3S Web of Conferences 266, 08002 (2021) https://doi.org/10.1051/e3sconf/202126608002
TOPICAL ISSUES 2021

 The concentration of vanadium in mg per kg of raw material is calculated by Equation
 (1):

 1 ∙1000∙50
 С= , (1)
 ∙

 where m1 – is the mass of vanadium in the solution, determined according to the
 calibration plot, mg; m – is the sample weight, g; 50 – is the volume of solution made for
 photometric analysis, ml; V – is the aliquot of the solution taken for photometry analysis,
 ml.
 The degree of extraction of vanadium from petroleum coke in the leaching process is
 determined by Equation (2):

 = ∙ 100%, (2)

 where C –is the concentration of vanadium in solution, mg/kg; Ccoke–is the
 concentration of vanadium in petroleum coke, mg/kg.

 2.4 X-ray fluorescence analysis
 The content of sulfur and trace elements in the obtained samples of petroleum coke was
 determined using X-ray fluorescence spectrometry without preliminary ashing of the
 samples using the addition method on a sequential wave dispersive X-ray fluorescence
 spectrometer XRF-1800 Shimadzu[20,21]. The device is equipped with an x-ray tube with
 an anode of Rh with a power of 2.7 kW. A detailed method for the determination of sulfur
 and trace elements is described in [22].

 2.5 Derivatographic analysis

 Thermogravimetric analysis and differential scanning calorimetry were performed on a
 SDT Q600 thermal analyzer. This device allows to conduct these analyzes simultaneously,
 which significantly reduces the time spent on examining samples. The sample weight for
 analysis was taken with an accuracy of 10-3 mg. The mass of carbon material was taken in
 the range from 15.494 mg to 5.406 mg. Heating was carried out from 50 to 1000 °C at a
 rate of 20 °C/min. The oxidizing environment was the air.

 2.6 X-ray diffraction analysis
 X-ray diffraction analysis of samples of carbon materials was carried out using aXRD-7000
 Shimadzu X-ray diffractometer(CuKα radiation, 2.7 kW) at room temperature using the
 polycrystal method. Radiographs were taken at large accumulation times (2 s) and a
 scanning step of 0.02°.
 The asymmetric reflections of petroleum cokes were decomposed into peaks. Their
 profile is described by a Gaussian with a maximum at angles of 2θ characterizing certain
 structural components of the samples.
 In this work, we used the inter-planar distance of the (002) and (110) diffraction
 maxima, as well as the sizes of the coherent scattering region in the directions of the axes
 “c” (average crystallite height Lc) and “a” (average diameter of hexagonal layers La) for a
 detailed assessment of the fine structure of carbon materials by the X-ray diffraction
 method. The inter-planar distance (d002 and d110) in Å of the obtained samples of petroleum
 coke was calculated according to the Wulf-Bragg equation [23,24]:

 4
E3S Web of Conferences 266, 08002 (2021) https://doi.org/10.1051/e3sconf/202126608002
TOPICAL ISSUES 2021

 = , (3)
 2∙

 where λ = 1.5406 – is the X-ray wavelength for CuKα, Å; θ – is the Bragg diffraction
 angle, rad.
 The average linear size of crystallites Lc and La was determined in Å according to the
 Scherrer Equation [25]:

 0.89∙ 0.89∙
 = and = , (4)
 002 ∙ 002 110 ∙ 110

 where 0.89 – is the Scherer constant, which for cokes was conditionally set the same for
 the uniformity in the published results [26]; β – is the width of the diffraction line at half
 the maximum height (in rad) minus the hardware peak width b = 0.2°.

 3 Results and discussion

 3.1 Leaching and analysis of product solutions

 The degree of vanadium extraction was determined according to paragraph 2.3. The optical
 density of the solution was recalculated to the degree of extraction using Equations 1 and 2.
 The received data are presented in Table 2.
 Table 2. The degree of vanadium extraction.
 Mass Concentration
 Degree of
 Time, Optical of of V, mg in Concentration
 Leaching agent S/L extraction,
 h density coke, 50 ml of of V, mg/kg
 %
 g solution
 1:2 0.091 1.0035 0.092 115 55
 H2SO4 1:3 0.107 1.0082 0.108 134 64
 1:4 0.101 1.0089 0.102 127 60
 0.5
 1:2 0.068 1.0018 0.068 85 40
 NaOH 1:3 0.074 1.0066 0.075 93 44
 1:4 0.096 1.0007 0.097 121 58
 1:2 0.065 1.0013 0.065 81 39
 H2SO4 1:3 0.082 1.0060 0.083 103 49
 1:4 0.134 1.0016 0.135 169 80
 1.5
 1:2 0.090 1.0078 0.091 113 54
 NaOH 1:3 0.088 1.0094 0.089 110 52
 1:4 0.119 1.0018 0.121 151 72
 1:2 0.079 1.0033 0.079 99 47
 H2SO4 1:3 0.087 1.0043 0.088 110 52
 1:4 0.092 1.0064 0.093 116 55
 2.5
 1:2 0.065 1.0040 0.065 81 39
 NaOH 1:3 0.112 1.0027 0.113 141 67
 1:4 0.063 1.0016 0.063 79 38
 Earlier in our laboratory it was shown that from the point of view of thermodynamics,
 sodium hydroxide is the best leaching agent. However, as can be seen from Table 1, the
 recovery of vanadium is higher when sulfuric acid is used. This is due to the fact that, in
 addition to thermodynamic factors, other parameters influence the leaching process, such as
 pore size, reagent diffusion, etc.

 5
E3S Web of Conferences 266, 08002 (2021) https://doi.org/10.1051/e3sconf/202126608002
TOPICAL ISSUES 2021

 The recovery of vanadium increases with an increase in the S/L ratio and the duration of
 the process, if sodium hydroxide or dilute sulfuric acid are used as a leaching agent.
 However, if the process is carried out for 2.5 hours, the degree of extraction decreases; that
 is also described in the works [11,14]. This may be due to the predominance of adverse and
 substitution reactions, whereby solubility of vanadium decreases.
 The highest recovery of vanadium (80%) is observed in the leaching process in the
 presence of sulfuric acid for 1.5 hours with a phase ratio of 1:4. The maximum of vanadium
 recovery for sodium hydroxide (72%) is observed under the same conditions. Thus, the
 maximum of vanadium recovery can be obtained by carrying out the process for 1.5 hours
 at a phase ratio of 1:4.
 The spent solution after the alkylation of isobutene with olefins can be used like sulfuric
 acid as leaching agent in production [27].

 3.2 Analysis of the composition and structure of the carbon residue after
 leaching

 3.2.1 X-ray fluorescence analysis

 The composition of the solid residue after leaching was studied by X-ray fluorescence
 analysis. The obtained data are presented in Table 3.
 Table 3.The composition of the solid residue after leaching.
 Leaching Content of element, %
 Time,h S/L
 agent V Ni S Fe Al Ca
 1:2 0.0095 0.0100 1.9119 0.0259 0.0046 0.0041
 H2SO4 1:3 0.0076 0.0171 1.3976 0.0189 0.0049 0.0033
 1:4 0.0083 0.0114 1.8702 0.0360 0.0056 0.0260
 0.5
 1:2 0.0125 0.0155 1.8826 0.0484 0.0131 0.0096
 NaOH 1:3 0.0117 0.0130 1.8980 0.0286 0.0180 0.0107
 1:4 0.0089 0.0094 1.6805 0.0270 0.0857 0.0246
 1:2 0.0129 0.0144 2.8792 0.0408 0.0074 0.0183
 H2SO4 1:3 0.0107 0.0126 1.9173 0.0198 0.0061 0.0040
 1:4 0.0041 0.0150 0.9374 0.0366 0.0028 0.0046
 1.5
 1:2 0.0097 0.0113 1.8730 0.0222 0.0041 0.0139
 NaOH 1:3 0.0100 0.0134 1.8198 0.0167 0.0043 0.0122
 1:4 0.0059 0.0185 1.1460 0.0269 0.0026 0.0083
 1:2 0.0111 0.0118 1.9178 0.0174 0.0051 0.0048
 H2SO4 1:3 0.0100 0.0117 1.8670 0.0404 0.0059 0.0129
 1:4 0.0094 0.0097 1.8843 0.0308 0.0044 0.0068
 2.5
 1:2 0.0129 0.0138 1.8251 0.0220 0.0051 0.0084
 NaOH 1:3 0.0069 0.0090 1.3881 0.0530 0.0050 0.0141
 1:4 0.0131 0.0145 1.8110 0.0190 0.0046 0.0079
 As can be seen from the table, the sulfur content is higher in the samples obtained by
 leaching in the presence of sulfuric acid. Sulfur is a more harmful impurity than vanadium,
 therefore the sodium hydroxide is better to use for improving the quality of coke obtained
 after leaching.
 The content of aluminum and calcium is higher in the samples obtained using sodium
 hydroxide, so alkali has a higher selectivity for the extraction of vanadium compared to
 acid.

 6
E3S Web of Conferences 266, 08002 (2021) https://doi.org/10.1051/e3sconf/202126608002
TOPICAL ISSUES 2021

 3.2.2 Derivatographic analysis
 The chemical reactions taking place in the solid residue after the leaching process with
 increasing temperature were studied by the method of thermogravimetry (Figure 2). Two
 processes are noticeable on the obtained curves: decomposition of the carbon part (600 ℃)
 and oxidation (400℃).
 The mass of the samples for the study was not constant, therefore, to compare the
 oxidation state, the increase in the mass of the sample in percent was calculated using
 Equation 5:

 о
 = ∙ 100% , (5)

 where М – is the sample weight increase, %; mоx – is the maximum mass of the sample
 after oxidation, mg; msam – is the sample weight taken for research, mg.
 Table 4 presents the data calculated according to Equation 5.

 NaOH 1:4
 12 16
 NaOH 1:2 NaOH 1:3
 0.5 hour
 14 1.5 hour
 10 H2SO4 1:3 1.73%
 12 NaOH 1:4 1.72%
 mass of coke, mg
 mass of coke, mg

 NaOH 1:2
 8
 H2SO4 1:2 10 H2SO4 1:4
 H2SO4 1:4 8
 6
 H2SO4 1:3
 NaOH 1:3 6
 4 H2SO4 1:2
 4

 2 2

 0
 0
 0 200 400 600 800 1000
 b)
 0 200 400
 о
 Т, С
 600 800 1000
 a) Т, оС

 16 NaOH 1:2
 H2SO4 1:2
 14 2.5 hour
 H2SO4 1:4 1.70%
 12
 H2SO4 1:3
 mass of coke, mg

 10
 NaOH 1:3
 8
 NaOH 1:4
 6

 4

 2

 0

 -2
 0 200 400 600 800 1000
 Т, оС c)
 Fig. 2. Thermo gravimetric analysis: the duration of the process is a) 0.5 hours, b) 1.5 hours, c) 2.5
 hours.

 7
E3S Web of Conferences 266, 08002 (2021) https://doi.org/10.1051/e3sconf/202126608002
TOPICAL ISSUES 2021

 Table 4. The results of thermogravimetric analysis.

 Maximum mass
 Leaching Mass of samples, Increase massof
 Time, h S/L after oxidation,
 agent mg samples, %
 mg
 1:2 7.252 0.10 1.38
 H2SO4 1:3 9.833 0.17 1.73
 1:4 6.074 0.10 1.65
 0.5
 1:2 11.960 0.17 1.42
 NaOH 1:3 5.406 0.10 1.85
 1:4 12.165 0.14 1.15
 1:2 5.615 0.07 1.25
 H2SO4 1:3 6.293 0.07 1.11
 1:4 10.316 0.22 2.13
 1.5
 1:2 10.683 0.18 1.68
 NaOH 1:3 14.698 0.22 1.50
 1:4 11.639 0.20 1.72
 1:2 14.343 0.14 0.98
 H2SO4 1:3 12.329 0.21 1.70
 1:4 13.281 0.24 1.81
 2.5
 1:2 15.494 0.27 1.74
 NaOH 1:3 8.199 0.14 1.71
 1:4 7.326 0.14 1.91

 The mass of the samples obtained using sodium hydroxide increases more than for the
 samples obtained using sulfuric acid. This fact confirms the previous conclusion about the
 higher selectivity of sodium hydroxide for the vanadium extraction as compared to sulfuric
 acid. This is due to the fact that sulfur and metals, remaining in the samples after leaching,
 are subjected to oxidation[28,29]. The more metals and sulfur are left in the sample, the
 more its mass will increase during the oxidation process.
 More oxidation is observed in the samples in the presence of sulfuric acid, when the
 ratio of solid and liquid phases is 1:4. This may be due to an increase of the sulfur content
 in these samples. The fact that the sulfur content in these samples is higher than in the
 samples obtained using alkali was shown in section 3.2.1.
 The curves that were obtained by the method of differential scanning calorimetry (DSC)
 show one peak corresponding to the decomposition of the sample. There are no peaks
 corresponding to oxidation, because the oxidation process only affects 2% of the total mass
 and has little effect on the overall heat balance of the system (Figure 3).

 8
E3S Web of Conferences 266, 08002 (2021) https://doi.org/10.1051/e3sconf/202126608002
TOPICAL ISSUES 2021

 700 1,5 h 1:3
 0,5 h 1:2
 600 H2SO4 10% 0,5 h 1:3
 0,5 h 1:4
 500 1,5 h 1:2
 1,5 h 1:4
 Heat flow, mW

 400 2,5 h 1:4
 2,5 h 1:3
 300 2,5 h 1:2

 200

 100

 0

 -100
 0 200 400 600 800 1000
 Т, оС
 0,5 h 1:2
 700 0,5 h 1:3
 0,5 h 1:4
 600
 NaOH 12% 1,5 h 1:2
 1,5 h 1:3
 500
 1,5 h 1:4
 2,5 h 1:2
 Heat flow, mW

 400
 2,5 h 1:3
 2,5 h 1:4
 300

 200

 100

 0

 -100
 0 200 400 600 800 1000
 о
 Т, С

 Fig. 3. DSC curves for samples were obtained using NaOH (a) and H2SO4 (b).
 The average decomposition temperature of the sample was calculated according to the
 DSC curves. Table 5 presents the obtained data.
 The decomposition temperature of the sample is 640 ℃.
 Table 5. Decomposition temperatures of samples.
 Time, h Leaching agent S/L Decomposition
 temperature, ℃
 1:2 609
 H2SO4
 0.5 1:3 622
 1:4 584
 NaOH 1:2 671

 9
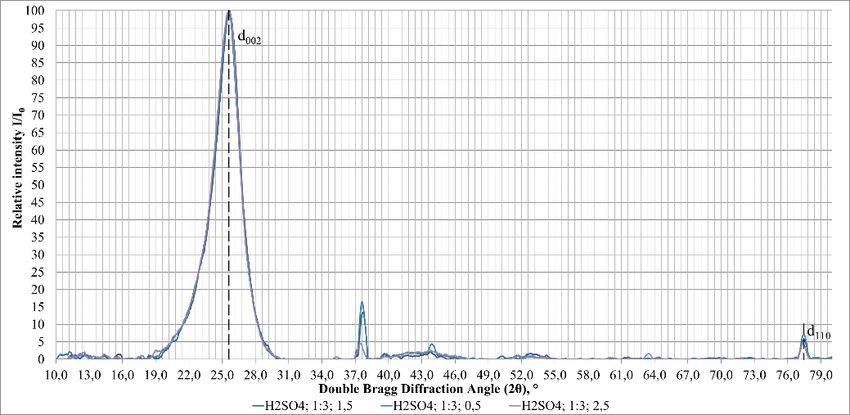
E3S Web of Conferences 266, 08002 (2021) https://doi.org/10.1051/e3sconf/202126608002
TOPICAL ISSUES 2021

 1:3 615
 1:4 662
 1:2 585
 H2SO4
 1:3 585
 1.5 1:4 652
 1:2 653
 NaOH
 1:3 685
 1:4 643
 1:2 659
 H2SO4
 1:3 649
 2.5 1:4 665
 1:2 673
 NaOH
 1:3 626
 1:4 615
 The average 636

 3.2.3 X-ray diffraction analysis
 Petroleum coke is amorphous carbon with a low degree of crystallinity. Amorphous carbon
 transforms into graphite during high-temperature processing. Crystallites formed in the
 amorphous matrix of petroleum coke during the thermolysis have a turbostract structure
 that differs from the graphite one [30]. The main structural parameters of such crystals are
 the inter-planar distances d002, d110 and the sizes of the coherent scattering regions in the
 direction of the crystallographic axes “c” and “a”, Lc and La, respectively. For graphite, d002
 and d110 are 3.354 and 1.232 Å, respectively, and for a turbostratic structure, d 002 varies
 from 3.37 to 3.60 Å, and d110from 1.215 to 1.230 Å [31].
 а)

 b)

 10
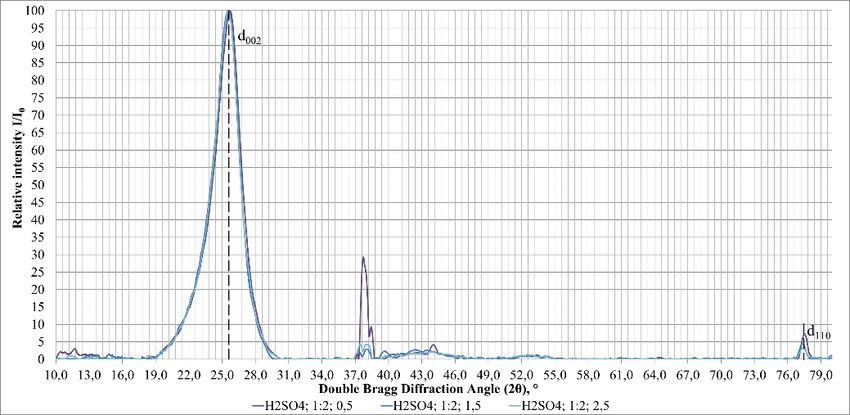
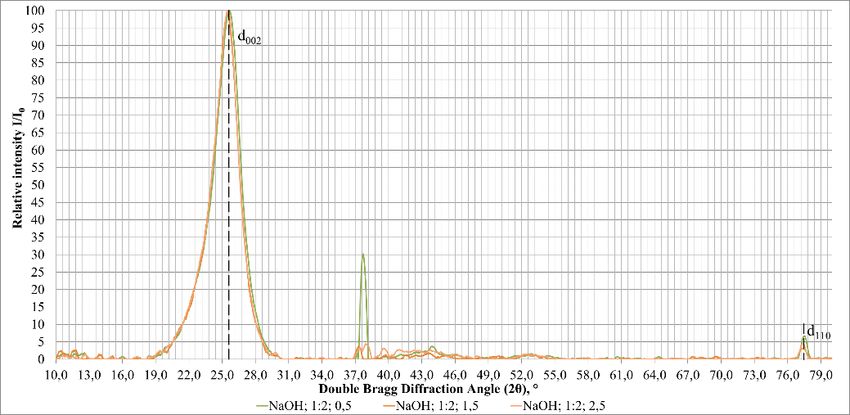
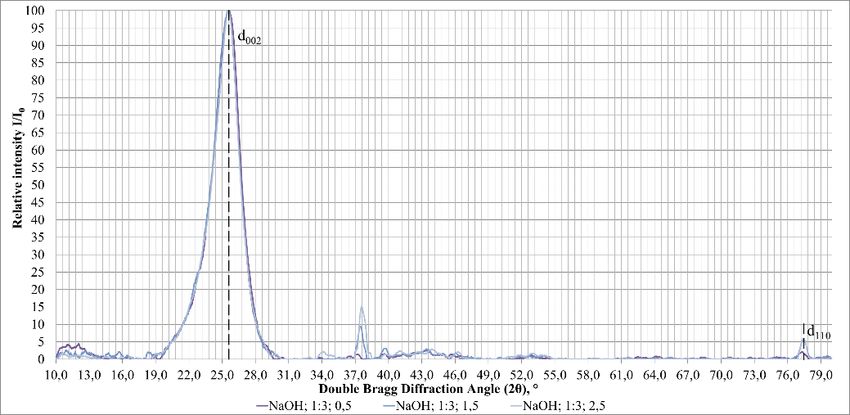
E3S Web of Conferences 266, 08002 (2021) https://doi.org/10.1051/e3sconf/202126608002
TOPICAL ISSUES 2021

 c)

 Fig. 4. Comparison of the diffraction patterns of the carbon material after vanadium recovery in
 presence of H2SO4 at 0.5, 1.5 and 2.5 h: a) S:L = 1:4; b) S:L = 1:3; c) S:L = 1:2.
 Figures 4 and 5 show a comparison of the diffractograms of the carbon material after
 the leaching process in the presence of H2SO4 and NaOH, respectively.
 а)

 b)

 11
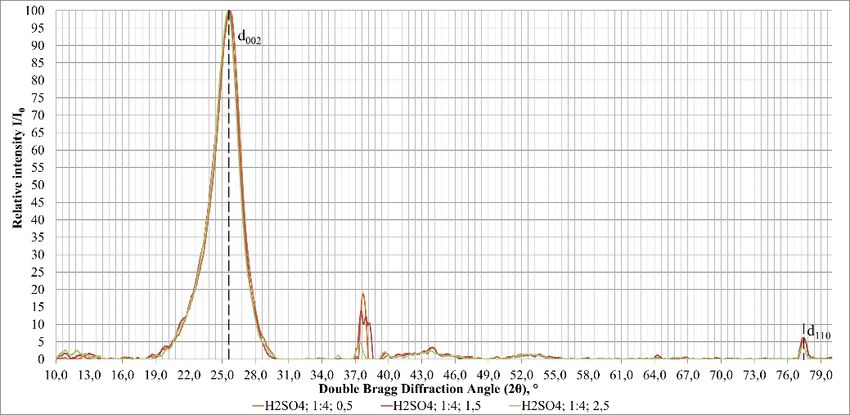
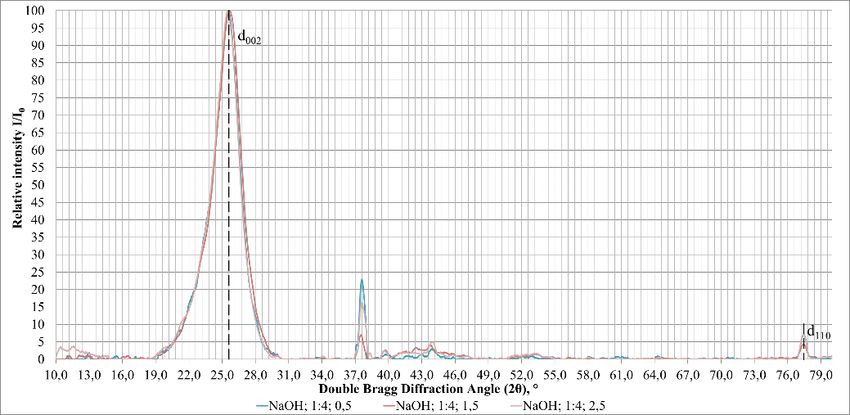
E3S Web of Conferences 266, 08002 (2021) https://doi.org/10.1051/e3sconf/202126608002
TOPICAL ISSUES 2021

 c)

 Fig. 5. Comparison of the diffraction patterns of the carbon material after vanadium recovery in
 presence of NaOH at 0.5, 1.5 and 2.5 h: a) S:L = 1:4; b) S:L = 1:3; c) S:L = 1:2.
 Peaks with a maximum of 2θ angles in X-ray diffractograms are about 25° and 77°,
 respectively responsible for reflections 2θ002 and 2θ110, are clearly expressed characteristic
 of petroleum coke. The angular position of the reflexes (2θ002 and 2θ110) in the X-ray
 diffraction pattern is determined by the corresponding inter-planar distance (d002 and d110)
 [32,33]. The diffractometric analysis results and values calculated from (002) and (110)
 reflections for the carbon material after vanadium recovery are shown in Table 6.
 Table 6. Results of diffractometric analysis of carbon material.
 Reflex (002) Reflex (110)
 Characteristic
 Halfwidth d002, Halfwidth d110,
 s 2θ, ° Lc, Å 2θ, ° La, Å
 ,° Å ,° Å
 H2SO4; 1:3; 25.60 3.476 29.467 77.44 1.231 173.997
 2.6800 0.6000
 1.5 0 9 2 0 5 9
 H2SO4; 1:2; 25.66 3.468 28.611 77.50 1.230 167.791
 2.7600 0.6200
 0.5 0 9 9 0 7 5
 H2SO4; 1:3; 25.62 3.474 29.248 77.46 1.231 180.817
 2.7000 0.5800
 0.5 0 2 9 0 2 6
 H2SO4; 1:4; 25.72 3.460 28.825 77.48 1.230 174.046
 2.7400 0.6000
 0.5 0 9 3 0 9 7
 H2SO4; 1:2; 25.60 3.476 28.608 77.30 1.233 156.338
 2.7600 0.6600
 1.5 0 9 5 0 3 6
 H2SO4; 1:4; 25.60 3.476 28.197 77.44 1.231 161.902
 2.8000 0.6400
 1.5 0 9 7 0 5 3
 NaOH; 1:2; 25.66 3.468 29.251 77.52 1.230 167.815
 2.7000 0.6200
 0.5 0 9 2 0 4 0
 NaOH; 1:3; 25.52 3.487 28.604 77.30 1.233 146.584
 2.7600 0.7000
 0.5 0 6 0 0 3 5
 NaOH; 1:4; 25.56 3.482 29.245 77.46 1.231 174.022
 2.7000 0.6000
 0.5 0 2 4 0 2 3
 NaOH; 1:2; 25.48 3.493 29.682 77.32 1.233 134.129
 2.6600 0.7600
 1.5 0 0 9 0 1 8
 NaOH; 1:3; 25.48 3.493 29.024 77.44 1.231 151.445
 2.7200 0.6800
 1.5 0 0 6 0 5 8
 NaOH; 1:4; 25.70 2.8000 3.463 28.203 77.46 0.6600 1.231 156.513

 12
E3S Web of Conferences 266, 08002 (2021) https://doi.org/10.1051/e3sconf/202126608002
TOPICAL ISSUES 2021

 Reflex (002) Reflex (110)
 Characteristic
 Halfwidth d002, Halfwidth d110,
 s 2θ, ° Lc, Å 2θ, ° La, Å
 ,° Å ,° Å
 1.5 0 6 3 0 2 5
 H2SO4; 1:4; 25.54 3.484 29.912 77.36 1.232 167.627
 2.6400 0.6200
 2.5 0 9 7 0 5 2
 H2SO4; 1:3; 25.58 3.479 28.817 77.38 1.232 173.925
 2.7400 0.6000
 2.5 0 6 3 0 3 0
 H2SO4; 1:2; 25.54 3.484 29.028 77.42 1.231 146.707
 2.7200 0.7000
 2.5 0 9 0 0 7 4
 NaOH; 1:2; 25.58 3.479 29.466 77.40 1.232 173.949
 2.6800 0.6000
 2.5 0 6 0 0 0 3
 NaOH; 1:3; 25.60 3.476 29.916 77.44 1.231 173.997
 2.6400 0.6000
 2.5 0 9 2 0 5 9
 NaOH; 1:4; 25.50 3.490 29.910 77.46 1.231 174.022
 2.6400 0.6000
 2.5 0 3 3 0 2 3
 The inter-planar distance d002 for samples of the carbon material after vanadium
 recovery varies from 3.4636 to 3.4930 Å, and d 110 from 1.2304 to 1.2333 Å. The character
 of the microstructure of petroleum coke can be judged according to the results of X-ray
 phase analysis by the ratio of the average height Lc and the average diameter La of
 crystallites [34,35]. In this case, the ratio of Lc/La varies from 0.16 to 0.22, so petroleum
 coke has a flattened structure of crystallites because of thermo baric conditions during the
 formation of petroleum coke.
 In the X-ray diffraction patterns of most samples of carbon materials, in addition to the
 peaks (002) and (110), there is also a peak with the maximum value of the doubled Bragg
 diffraction angle 2θ of about 37°, which is not typical for of the crystal lattice of petroleum
 coke and reflects the content of impurities.
 The results of the analysis show that the relative intensity of this peak, which
 characterizes the content impurities, has a general tendency to decrease with an increase of
 the duration of the leaching process from 0.5 to 2.5 hours, but with a minimum at 1.5 hours
 at a ratio of S:L = 1:4 and using sulfuric acid or sodium hydroxide as a leaching reagent.
 The trend to decrease remains at L:S = 1:3 and others parameters equal, however withno
 minimum at 1.5 hours. The relative intensity of the peak at S:L = 1:2 passes through a
 maximum at 1.5 hours and returns to the original range of values.
 The relative intensity of the peak of 37° at a leaching time of 0.5 h and a decrease in the
 content of the leaching reagent H2SO4 or NaOH (the S:L ratio varies from 1:4 to 1:3 and
 1:2) increases. However, the relative intensity of this peak decreases at 1.5 and 2.5 hours
 and others parameters the same.

 4 Conclusion
 It was shown that the extraction of vanadium after the leaching process increases with an
 increase in the ratio of the S/L phases and the duration of the process. It was also shown
 that sulfuric acid is the best leaching agent, although it increases the sulfur content in coke.
 Alkali is a more selective solvent compared with sulfuric acid.
 The highest recovery of vanadium (80%) was observed when the process was carried
 out in the presence of sulfuric acid for 1.5 hours with a phase ratio of 1:4. The maximum of
 vanadium recovery using sodium hydroxide was observed under the same conditions and
 amounted to 72%.
 The obtained crystals of petroleum coke have a turbostract flattened crystal structure,
 because of the thermobaric conditions for the formation of petroleum coke.

 13
E3S Web of Conferences 266, 08002 (2021) https://doi.org/10.1051/e3sconf/202126608002
TOPICAL ISSUES 2021

 This work has also shown that petroleum coke is a promising raw material for the
 production of vanadium at an industrial scale.

 This work was carried out as part of the State Assignment “Development of scientific foundations of
 innovative technologies for processing heavy hydrocarbon raw materials into environmentally
 friendly motor fuels and new carbon materials with controlled macro- and microstructural
 organization of mesophase”. The study was conducted with the involvement of the laboratory base of
 the Center for Collective Use of Saint Petersburg Mining University.

 Reference
 1. J. Ancheta, HYDRO-MPC technology for heavy oil refining. Journal of Mining
 Institute 224: 229-234. (2017).
 2. A.A. Sukhanov, Yu.E. Petrova, The possibility of recycling valuable associated
 components of heavy oils while increasing the overall efficiency of their development.
 Oil and gas geology. Theory and Practice 4: 1-13 (2009).
 3. E.A. Mustafina, O.Y. Poletaeva, E.M. Movsumzade, Heavy metal oils and their
 demetallization. Oil and Gas Chemistry 4: 15-18. (2014).
 4. B. Issa, et al. Assessment of possibility of obtaining alloying components in the
 process of desalting of heavy hydrocarbon raw materials. Part 1. CIS Iron and Steel
 Review 19: 8-12 (2020).
 5. A. F. Akhmetov, et al. The state of vanadium (V) in crude oil and petroleum residues.
 International Journal of Applied Engineering Research 10(21):42553-42555 (2015).
 6. N. A. Mironov, [et al.]. Comparative Study of Resins and Asphaltenes of Heavy Oils
 as Sources for Obtaining Pure Vanadyl Porphyrins by the Sulfocationite-Based
 Chromatographic Method. Energy & Fuels. 32(12): 12435-12446. (2018).
 7. N. A. Mironov, et al. Methods for Studying Petroleum Porphyrins. Petroleum
 Chemistry: 59(10), 1077-1091. (2019).
 8. S. G. Yakubova, et al. Distribution of vanadium and vanadyl porphyrins during
 fractionation of resins of heavy sulfurous oils. Petroleum Science and Technology,
 36(16):1319-1324 (2018).
 9. D.N. Nukenov, S.A Punanova, Z.G. Agafonova, Metals in oils, their concentration and
 extraction methods. (Moscow: GEOS, 2001).
 10. V.M. Kapustin, V.F. Glagoleva, Physicochemical aspects of petroleum coke formation.
 Petroleum Chemistry 56(1):1-9 (2016).
 11. E. Nazari, et al. Simultaneous recovery of vanadium and nickel from power plant
 flyash: Optimization of parameters using response surface methodology. Waste
 Management 34: 2687-2696. (2014).
 12. M. V. Tsygankova, et al. The recovery of vanadium from ash obtained during the
 combustion of fuel oil at thermal power stations. Russian Journal of Non-Ferrous
 Metals 52(1): 19–23 (2011).
 13. H. Tokuyama, et al. Process development for recovery of vanadium and nickel from
 heavy oil fly ash by leaching and ion exchange. Separation science and technology
 38(6): 1329-1344 (2003).
 14. R. Navarro, et al. Vanadium recovery from oil fly ash by leaching, precipitation and
 solvent extraction processes. Waste Management 27: 425–438 (2007).

 14
E3S Web of Conferences 266, 08002 (2021) https://doi.org/10.1051/e3sconf/202126608002
TOPICAL ISSUES 2021

 15. E. Guibal, et al. Vanadium extraction from fly ash-preliminary study of leaching,
 solvent extraction, and sorption on chitosan. Separation science and technology
 journal 38(12): 2881–2899. (2003).
 16. R. Parvizi, et al. Hydrometallurgical extraction of vanadium from mechanically milled
 oil-fired fly ash: analytical process optimization by using Taguchi design method.
 Metallurgical and materials transactions 43B: 1269-1276 (2012).
 17. V.A. Rudko, N.K. Kondrasheva, R.E. Lukonin, The effect of acid leaching parameters
 on the extraction of vanadium from petroleum coke. Proceedings of SPbGTI(TU) 42:
 43-48 (2018).
 18. M.R. Tavakoli, S. Dornian, D.B. Dreisinger, The leaching of vanadium pentoxide
 using sulfuric acid and sulfite as a reducing agent. Hydrometallurgy 141: 59-66.
 (2014).
 19. Y.L. Zhang, L.Q. Yang, X.G. Tian, The effect of sodium sulfate on vanadium leaching
 From Petroleum coke and surface physical–chemical properties of leaching solution.
 Petroleum science and technology 33(15): 1492-1498. (2015).
 20. S. A. Savchenkov, The research of obtaining master alloys magnesium-gadolinium
 process by the method of metallothermic recovery. Tsvetnye Metally 5: 33-39 (2019).
 21. S.A. Savchenkov, V.Y. Bazhin, V.G. Povarov, Research on the process of gadolinium
 recovery from the melt of salts on formation of Mg – Zn – Gd master alloys for
 manufacturing of magnesium and aluminium special-purpose alloys. Non-ferrous
 Metals 48(1): 35-40. (2020).
 22. N.K. Kondrasheva, V.A. Rudko, V.G. Povarov, Determination of sulfur and trace
 elements in petroleum coke by X-ray fluorescent spectrometry. Coke and Chemistry
 60(6): 247–253. (2017).
 23. W.L. Bragg, The Structure of Some Crystals as Indicated by Their Diffraction of X-
 rays. Proceedings of the Royal Society A: Mathematical, Physical and Engineering
 Sciences 89(610): 248–277. (1913).
 24. G. Wulff, Über die Kristallröntgenogramme. PhysikalischeZeitschrift 14: 217–220.
 (1913).
 25. P. Scherrer. Bestimmung der innerenStruktur und der Größe von
 KolloidteilchenmittelsRöntgenstrahlen. (Berlin, Heidelberg: Springer Berlin
 Heidelberg. 1912).
 26. F.R. Feret, Determination of the crystallinity of calcined and graphitic cokes by X-ray
 diffraction. The Analyst 123(4): 595–600. (1998).
 27. A.D. Badikova, et al. Complex technological solution for recycling of spent sulfuric
 acid from alkylation of isobutane by olefins. Chemistry and Technology of Fuels and
 Oils 53(1): 29-37 (2017).
 28. X. Fan, The Fates of Vanadium and Sulfur Introduced with Petcoke to Lime Kilns.
 (Toronto. 2010).
 29. C. Song, K. Liu, Z. Gong, Y. Liu, Thermogravimetric analysis of combustion
 characteristics of coal gangue and petroleum coke mixture. Journal of Physics:
 Conference Series 1324: 12-77 (2019).
 30. P.N. Kuznetsov, et al. Comparison of supramolecular organization of brown coal from
 different deposits. Chemistry for sustainable development 9: 255–261 (2001).
 31. E.A. Belenkov, E.A. Karnaukhov, Influence of crystal dimensions on interatomic
 distances in dispersed carbon. Physics of the Solid State 41(4): 672–675. (1999).

 15
E3S Web of Conferences 266, 08002 (2021) https://doi.org/10.1051/e3sconf/202126608002
TOPICAL ISSUES 2021

 32. Y. Zhu, et al. Preparation and Characterization of Coal Pitch-Based Needle Coke (Part
 I): The Effects of Aromatic Index (fa) in Refined Coal Pitch. Energy & Fuels 33(4):
 3456–3464. (2019).
 33. Y. Zhu, et al. Preparation and Characterization of Coal Pitch-Based Needle Coke (Part
 II): The Effects of β Resin in Refined Coal Pitch. Energy & Fuels 34(2): 2126–2134
 (2020).
 34. A.N. Popova. Crystallographic analysis of graphite by X-Ray diffraction. Coke and
 Chemistry 60(9): 361–365 (2017).
 35. Z.R. Ismagilov, et al. Structural Analysis of Needle Coke. Coke and Chemistry 62(4):
 135–142. (2019).

 16
You can also read