Vermeer's maps: a new digital look in an old master's mirror
←
→
Page content transcription
If your browser does not render page correctly, please read the page content below
e-Perimetron, Vol.1, No. 2, Spring 2006 [138-154]                                        www.e-perimetron.org | ISSN 1790-3769

                                      Evangelos Livieratos ∗, Alexandra Koussoulakou**

              Vermeer’s maps: a new digital look in an old master’s mirror 1

Keywords: Cartography and Art; Johannes Vermeer; image processing; map comparison; cartographic deformations; carto-
graphic animation; cartographic heritage.

          Summary
          The links of Cartography to Art and culture are as old as the field itself. The art of painting has al-
          ways been present within maps, which, in turn have always been regarded as a combination of
          scientific and artistic skills. One of the most prominent examples of the harmonic duality of maps
          as scientific tools and objects of culture is witnessed in the Netherlands during the 17th century,
          when the Dutch were world leaders in the field of cartographic production. This period is also
          known as the golden century of the country: state power and world dominion were combined with
          progress in science and in arts. Dutch mapmakers of the time were usually combining more skills:
          they were surveyors, cartographers, painters of landscapes and even more. On the other hand,
          many seventeenth-century Dutch painters such as Hals, Vermeer, Ter Borch, De Hooch, Steen,
          Ochtervelt, Maes and others, introduced depictions of real maps into their works and decorated
          their interiors with maps for symbolic or allegorical reasons. A typical example is Johannes
          Vermeer; in his painting ‘Officer and laughing girl’ (~1660) an officer and a young girl are placed
          in an interior, sitting at a table in front of a window. On the wall behind the girl a large map is
          hanging, occupying a large part of the painting and being equally important as the rest of the scene.
          The map on the painting depicts part of the Netherlands; its remarkable similarity with the original
          topographic map of its time (~1620) makes comparison processes a real challenge. Such a
          comparison is nowadays made much easier than in the past with the tools offered by the new
          technologies. Issues of interest for the history of Cartography reveal new dimensions through the
          use of these tools. A typical example concerning the study of old maps is the deformation analysis
          of those maps. Such a deformation analysis was attempted, for the two maps mentioned before (i.e.
          the map on the painting and its original -old- topographic counterpart). In this paper the
          comparative method of analysis is applied on the ‘painted’ map and its actual counterpart, by
          transforming optimally one onto the other. Apart from the analytical and digital component of the
          process, an interesting result is the visual representation of the transformation (dynamic morphing)
          from one map to the other. This revealed some remarkable indications about the method followed
          by the artist (use of the camera obscura) in his painting.

                                                        Introduction

Cartography is one of the oldest human occupations; nevertheless one of its most typical charac-
teristics manifested through time is the ability to adapt very fast to developments and to follow the
‘new technologies’ of every historical era. Through this adaptation Cartography manages to rede-
fine its role and re-establish itself in novel environments (Koussoulakou and Livieratos 2000:
345). Perhaps this ability can be attributed to Cartography’s multidisciplinary nature, which spans
both science and art: Maps are used both in practical and cultural or artistic context (i.e. for
strictly scientific tasks and needs, but also in arts and literature). And like art, Cartography reveals
fragments of reality through a tissue of lies (Barber and Board 1993).

∗
     Professor, Aristotle University of Thessaloniki [livier@auth.gr]
**
     Associate Professor, Aristotle University of Thessaloniki [kusulaku@auth.gr]
1
 The first version of this study, in Greek, presented at the 8th Hellenic Cartographic Conference, under the title
‘Maps in grand painting’, Thessaloniki, November 2004, was dedicated to Ferjan Ormeling.
                                                             [138]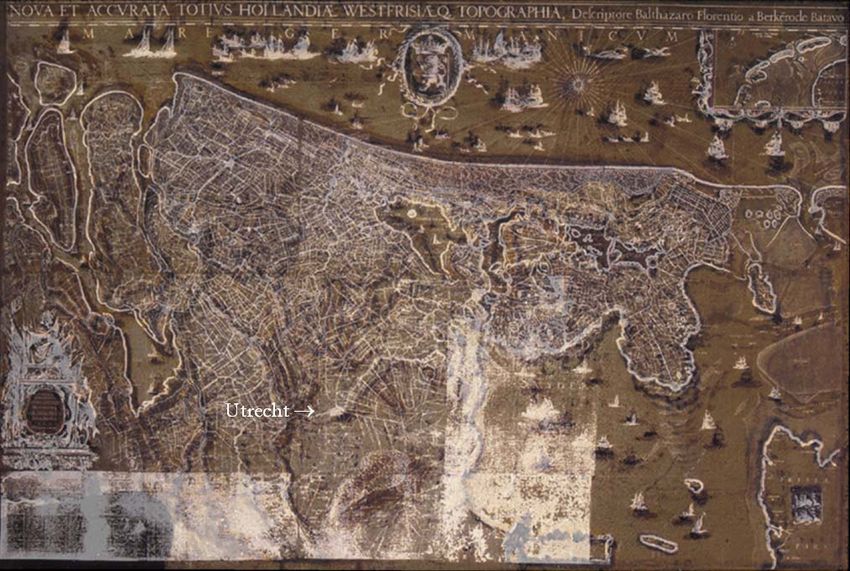
Cartography has evolved to a high standard of a science, a technology and an art, especially from
the Renaissance and onwards; its peak was witnessed during the New Era of the 17th and 18th cen-
turies, when almost ‘two out of five’ scientists were dealing with Cartography, as the historian
R.S. Westfall has demonstrated (URL1; see also Woodward 1999). The impressive developments
of this era in science and, in parallel in arts and culture are reflected in maps, which are used not
only scientifically but also decoratively or symbolically / allegorically (think, for instance, of
maps in paintings).
Later Cartography subsumed to the large technological stream that emerged from the World Wars
of the first half of the 20th century and from space technology that developed in the second half of
the same century. After an intermission of a quest in the fields of semiotics but also of a new theo-
retical foundation for certain issues during the third quarter of the 20th century, Cartography is
nowadays positioned within the main stream of the digital transition. Within this scope, however,
Cartography demonstrates strong trends of re-establishing and facing a broad spectrum of classic
cartographic problems, by using the so-called new technologies (Livieratos 2001). These New
Information and Communication Technologies (NICT) are an example of the fusion of new tools
and old cartographic tradition: they can help appreciate and investigate the various facets of Car-
tography from its early days till now. One such issue of particular interest that emerges recently is
the study of the history of Cartography and of maps using the tools of the new technologies.
The links of Cartography to art and culture are as old as the field itself. Maps played an important
role in culture from Antiquity to the Renaissance (Livieratos, 2001). Globes were used in art as
early as the Classical Antiquity; in fact the globe is the oldest of the cartographic motifs used in
artistic context (Welu 1977). In Greek and Roman art it signified a deity (e.g. Zeus) or a ruler
such as the emperor (Sittl 1885), connotating power and victory2. The use of the wall map as a
motif in art seems to appear for the first time around 1620, in the Netherlands (Welu op.cit.).
From the Renaissance and onwards maps become cultural signs of the new era (power, world
domination), but also carriers of symbolism and allegories, when regarded in the cultural or artis-
tic context.
It seems that the impact of culture and history has nowadays become strong enough to be appreci-
ated even by the most technical cartographic or geographic circles. It is for instance surprising to
see that a technical publication, such as a users-manual of a geographic software package is illus-
trated with antique maps; even in such a way, the added value of culture and art is a positive sign
within the field!

                          Maps and painting in the Netherlands of 17th century

One of the most prominent examples of the harmonic duality of maps as scientific tools and ob-
jects of culture is witnessed in the Netherlands during the 17th century. The Dutch were then
world leaders in the field of cartographic production: globes, maps, charts and atlases were issued
in unprecedented quantities during the seventeenth century in the Netherlands. This period is also
known as the golden century of the country: state power and world dominion were combined with
progress in science and in arts.

2
  During the 17th century the globe was popularised -especially in the Netherlands- as a vanitas motif in art; both terrestrial
and celestial globes were used in this sense. A well known ‘vanitas’ theme of this particular time in the Netherlands was
Vrouw Wereld (the Lady World): an allegorical figure dating back to medieval times and personifying worldly pleasures; in
paintings she appears as holding a bubble and wearing on her head an orb or globe –the bubble and the globe symbolize tran-
sience (Welu 1977; Stammler 1959).
                                                            [139]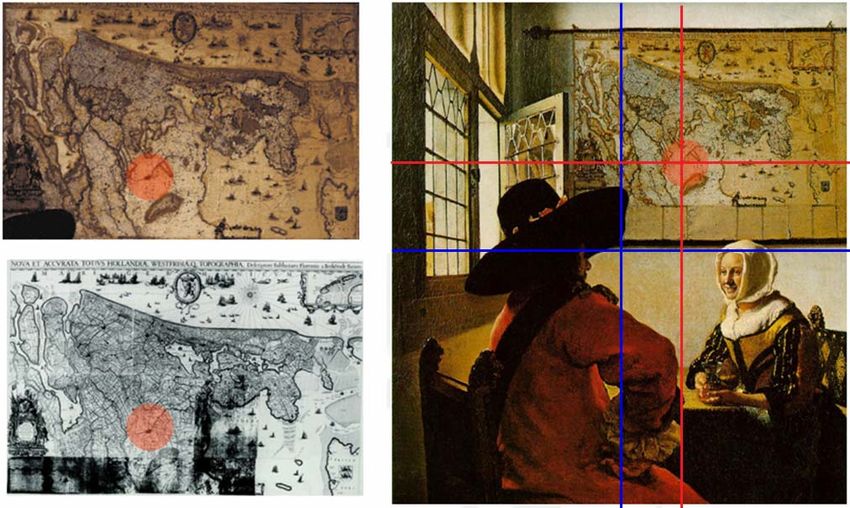
Dutch mapmakers of the time were even combining more skills: they were surveyors, cartogra-
phers, painters of landscapes and even more (see, for instance references to the Dutch cartogra-
phers of the van Berckenrode family3 in URL2 to URL11, for some examples of their global skills;
see also Zandvliet 1998, about the so-called mapmaking artist). Artists of the time were employed
in executing maps and plans of all kinds; the transformation from map to landscape- or city-view
and vice versa made the distinction between the scientific and the artistic, as we experience it to-
day, almost non-existing (see e.g. Alpers 1987). Perhaps we cannot grasp the lack of this distinc-
tion, because nowadays we are not aware of the pre-industrial way of the world, when craftsman-
ship was the natural link between the scientific and the artistic.

                                           The case of Johannes Vermeer

On the other hand, many seventeenth-century Dutch painters4 such as Hals, Vermeer, Ter Borch,
De Hooch, Steen, Ochtervelt, Maes etc. introduced depictions of real maps into their works and
decorated their interiors with maps for symbolic or allegorical reasons (Barber and Board 1993).
It is perhaps worth mentioning that it was not uncommon for painters of that time to receive
mathematical training, in order to use it for e.g. applying the rules of perspective in their work;
such training was given by surveyors and cartographers (Zandvliet op.cit.).
At the time maps were popular among prosperous citizens: they were good to look at as well as
educational and useful for showing off their owners’ interest in geography and politics and even
their patriotism (Bailey 2001). This trend is very eloquently demonstrated in the most accurate
witnesses of everyday-life scenes of the time: the famous interior paintings of the 17th century
Dutch masters, Vermeer being the most remarkable amongst them5.

3
  The van Berckenrode family (father and two sons) are related to the map that constitutes the subject of the present paper;
nevertheless they are a typical example of Dutch cartographic activities during the 17th century. They were, among others,
surveyors, map-makers (i.e. drew the maps), ‘painters’ (large scale city- and garden-plans and battle plans) and publishers.
The father was Floris Balthasar van Berckenrode from Delft -he was also trained as an engraver and goldsmith; his two sons
were Balthasar Florisz.(oon) van Berckenrode and Frans Florisz. van Berckenrode. The latter was mostly engaged in over-
seas mapping, for the Dutch East India Company (Verenigde Oostindische Compagnie, VOC). (Zandvliet 1998).
4
  Dutch 17th century art was influenced by the division of the Netherlands in a catholic and a protestant camp. The Northern
provinces had risen against their catholic overlords (the Spaniards) and followed the protestant faith; this had a direct conse-
quence to the style and preferences they adopted for their architectural and artistic creations (Gombrich 1984). For painting in
particular, the effect of the victory of Protestantism in countries like Germany, Holland and England was dramatic, starting
from the 16th century: objecting to pictures and statues in churches and even (among strict Calvinists) to house decorations,
left only few alternatives such as book decoration or portrait painting. Actually the only protestant country in Europe where
art fully survived the crisis of the Reformation was the Netherlands. Artists there, instead of concentrating on portrait paint-
ing only, managed to specialize in subjects to which the protestant church could raise no objections. Such subject-matters
were landscapes, seascapes, battle-pieces, scenes from daily life etc. These –the latter in particular- became known as genre
scenes (genre = kind/branch in French). Through still-life painting, in particular, Dutch artists experimented with contrasts
and harmonies of colours, materials and textures, reaching a point where the subjects of a painting did not matter anymore
and demonstrating how trivial objects can make a perfect picture (op.cit.). Being the greatest among these masters, Vermeer
achieves precision in the rendering of forms, colours and textures, without his picture looking laboured. His unique combina-
tion of mellowness and precision makes his work so remarkably striking. He is like a photographer who softens the strong
contrasts of the picture without blurring the forms (op.cit.).
5
  Maps were often depicted in the paintings of Dutch masters. Vermeer’s maps, however, are distinctive, when compared to
those in the works of other artists (Alpers 1987). Compare, for instance the map in Jacop Ochtervelt’s The Musicians
(ca.1670, at the Art Institute of Chicago) with Vermeer’s map in The Art of Painting: it is hard to believe that the same map is
represented in both (i.e. the map of The Seventeen Provinces by Claes Jansz. Visscher, the1650’s): Ochtervelt merely indi-
cates that a map is on the wall, while Vermeer suggests (as in all of his paintings) the quality of the materials –varnished
paper, paint, as well as something of the graphic means by which the land mass is set forth (Alpers, op.cit.). The same map is
represented in three more paintings by Ochtervelt and two by Nicolaes Maes (Welu 1975).
                                                             [140]
Figure 1. Left: Vermeer’s 35 paintings. Right: The 10 paintings with geographic and cartographic interest.
                                       In coloured frame Officer and laughing girl.

In about half a dozen of Vermeer’s paintings, maps can be seen hanging on the walls6; they show
provinces, the country (Netherlands) or the continent (Europe), making in this way another win-
dow out of his withdrawn interiors (Bailey op.cit.). Also globes and instruments appear in three
more paintings of the artist7.
Vermeer is an artist that has remained in oblivion for almost two centuries after his death. The
search for his work and life has started since approximately a century and a half ago8. It is not
known exactly whether this is the reason that rather few paintings of Vermeer are known, or sim-
ply the fact that he made a few paintings during his lifetime, which was in any case short (1632-
1675). Of the approximately thirty-six paintings that are attributed to Vermeer up to now, ten con-
tain maps or globes in the scenes they portray, a fact that was described by Thoré as Vermeer’s
mania for maps (La manie des cartes geographiques…); all this cartographic material has been
identified: both the source and at least one surviving original of each map or globe shown on
Vermeer’s paintings are known to exist9 (Welu 1975).

6
 Officer and laughing girl, drawn about 1657-60, Frick Collection, New York;
Woman in blue reading a letter, drawn about 1662-64, Rijksmuseum, Amsterdam;
Young woman with a water jug, drawn ca. 1662, Metropolitan Museum, New York;
A lady with a lute, drawn ca. 1663, Metropolitan Museum, New York;
The art of painting, drawn about 1667, Kunsthistorisches Museum, Vienna;
The love letter, drawn about 1670, Rijksmuseum, Amsterdam.
We also know from autoradiography that Vermeer first painted a map of the seventeen provinces of the Netherlands in his
Woman with a pearl necklace, (drawn ca. 1664, now at the Gemaeldegalerie, Staatliche Museen zu Berlin - Preussischer
Kulturbesitz, Berlin); however he removed the map before completing the work, leaving as a result quite some amount of
blank wall (Bailey op.cit.). (See also URL13 about this particular painting).
7
 The Astronomer, 1668, Musée du Louvre;
The Geographer, ca. 1668-9, Staedelsches Kunstinstitut, Frankfurt a/M;
The allegory of faith, painted around 1669-1670, Metropolitan Museum, New York.
8
  The French politician and writer Théophile Thoré (under the pseudonym William Buerger) was one of the first that at-
tempted his exploration, followed by another Frenchman (Henri Harvard) who started to investigate the artist’s life and work
in the 1870s (Bailey 2001). From that time on, interest about the Dutch artist from Delft has increased to the degree that his
work can now be truly appreciated. No earthly traces, however, of his life in his native city have remained. For a virtual visit
in Vermeer’s work and Delft see URL12.
9
 Officer and laughing girl (1657-60); Map: made by Balthasar Florisz. van Berckenrode, published by Willem Jansz. Blaeu,
1621. Copies in Hoorn and Leiden.
                                                             [141]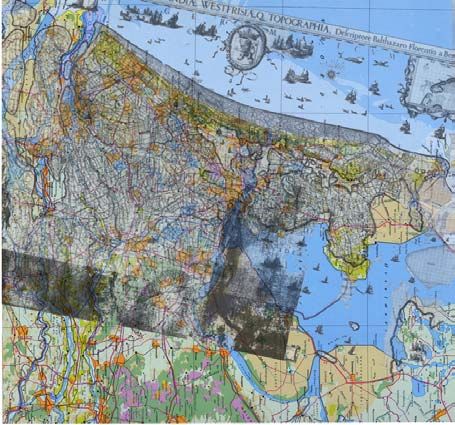
The ‘painted’ map in Officer and laughing girl

Among the first maps to be identified was the one contained in the painting Officer and laughing
girl (Fig, 2). The picture, created most probably between 1657 and 1660, has a size of 50.5 X 46
cm and belongs nowadays to the Frick Collection in New York. A girl and a soldier are sitting at a
table, next to a half-opened window, in a contemporary interior, engaged in what seems to be a
leisurely conversation. The soldier in the left is mostly in the shadow, his back half-turned to the
viewer, while the girl, smiling at him, faces the window and is illuminated by the sunlight stream-
ing in. The dark figure of the officer seems unnaturally large compared to the girl; moreover the
contrast between his dark, wide-brimmed hat and the young woman’s tied white head scarf, exag-
gerates the effect of disproportion and makes him appear almost threatening for her. She is gazing
into the officer’s eyes laughingly, while he is talking to her. She is holding a glass of wine with
her right hand, while her left hand is resting half-open on the table, the palm facing upwards, an
ambiguous gesture that could be interpreted as a request for money (Bailey 1995). In no other of
Vermeer’s paintings are shapes so different in size, an effect that is achieved by the unusual short-
ening of space (Schneider 2001), a shortening that gives the viewer a feeling of immersing, of be-
ing inside the room. The man dominates and his figure gives an impression of him trying to se-
duce the girl with wine.
Vermeer’s fondness of maps is demonstrated here too, by means of the map hanging on the wall
behind the girl. The map is drawn very clearly, in such a way that it appears as visually important
as the rest subjects of the genre scene. It shows the area of Holland and West Friesland, with west
at the top -which was not uncommon for the time. The following title can be clearly read on the
map’s top: NOVA ET ACCVRATA TOTIVS HOLLANDIAE WESTFRISIAEQ.(VE) TOPOGRAPHIA
(New and accurate description of the topography of the whole Holland and of West Friesland).
The orientation with west at the top, but also the unusual colours of the map (the land appears
grey-blue, while the sea has a more earthly colour) may at first glance puzzle the viewer about the
area shown. Moreover, the shape of the country has changed since then: the lake with the numer-
ous ships that appears in the middle, for instance, is nowadays Amsterdam airport.

Woman in blue reading a letter (ca 1662-64); Map: same as in Officer and laughing girl.
Young woman with a water jug (ca 1662); Map: The Seventeen Provinces of the Netherlands, published by the Dutch car-
tographer Huyck Allart. The only known copy, dated 1671, is in the University Library, Leiden. The original of this map first
appeared around the beginning of the 17th century.
A lady with a lute (ca 1663); Map: Jodocus Hondius map of Europe; first state edited by Jod. Hondius ca1613 with only one
copy remaining nowadays at the University Library Amsterdam; a second state of the Hondius map was printed in 1659 by
Joan Blaeu with three copies existing to our day, in three different atlases (in Berlin, London and Rostock).
The art of painting (ca 1667); Map: The Seventeen Provinces by Claes Jansz. Visscher, published in the1650’s; only one
copy has survived, now in the Bibliothèque Nationale Paris, without the title band, the text and the town views.
The love letter, (ca 1670); Map: same as in Officer and laughing girl.
The Astronomer (1668); Globe: same as in The allegory of faith ; Map (partially visible, to the right): A sea chart of Europe
by Willem Jansz. Blaeu, undated original in Berlin, Deutsche Staatsbibliothek.
The Geographer (ca 1668-9); Globe (celestial): by Jodocus Hondius, first published in 1600, three copies exist (in San Mar-
ino, Lucca and Amsterdam).
The allegory of faith (ca 1669-1670); Globe (terrestrial): by Jodocus Hondius 1618, one copy of the globe remains in Nur-
emberg.
                                                           [142]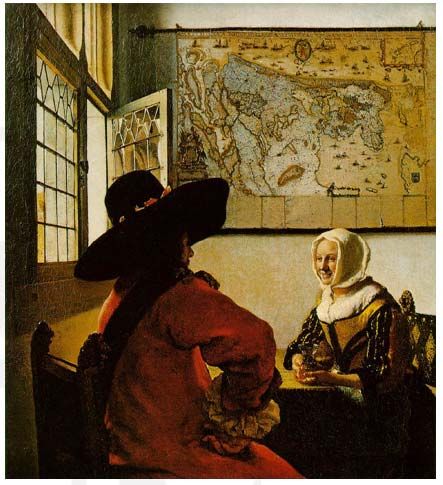
Figure 2. Johannes Vermeer: Officer and laughing girl (1657-60),
                                                  Frick Collection, N.Y.

The original map was created in 1620 by Balthasar Floriszoon van Berckenrode and published by
Willem Janszoon Blaeu in the early 1620’s; it then went through numerous editions in the years to
come (see below for more details on this particular map). Thus by the time that Vermeer com-
pleted the painting the map was already about forty years old and outdated (keeping in mind the
land reclamation and the creation of new polders taking place in the country during that period).
Although wall maps like this were still a rather expensive luxury, Cartography was becoming
popular in mid-17th century Netherlands; maps were symbols of humanistic education and knowl-
edge. The band with text around the map gives historical and geographical information about the
country (see also below, where the map is described in more detail) and praises the Dutch people
and the land they have successfully held.
The use of maps, such as above, implies actual historical / political links. This painting with the
figure of a soldier next to the map is perhaps an allusion on the victorious war with England
(1652-1654) (Schneider 2001). Vermeer may have been suggesting that the army officer had
something to do with the preservation from the enemy of the provinces displayed on the map; in
another of his paintings, where the same map is partially displayed (Woman in blue reading a let-
ter) he might have meant to hint that the young woman’s letter was written by someone ‘out
there’. The small room becomes thus a real, lived-in space (Bailey 2001).
At another level of interpretation, the map may emphasize the worldliness, superficiality and con-
sequently the deeper moral dangers in this apparently innocent scene of dalliance between a cava-
lier and a smiling girl10, implying an allegory of the battle of the sexes (Hill 1993). Notice also
that the edge of the map is ‘touching’ the girl’s head-top, making us think of the Vrouw Wereld
allegory again (Welu 1977). The map is drawn in remarkable detail. This contributes to the argu-
ment11 that Vermeer used a camera obscura for creating his paintings (see e.g. URL13, URL14,
URL15 for Vermeer and the use of optical devices in art).

10
   There exist more paintings by Vermeer with the leidmotif of a lady and one or two gentlemen drinking wine. Also other
contemporary painters have depicted similar genre scenes. The Officer and laughing girl is possibly inspired by De Hooch’s
Interior with a woman drinking with two men, drawn around the same time, where the settings are similar (a window and
light falling from the left and a map on the wall opposite to the viewer). De Hooch had been doing such ‘merry company’
scenes for several years (Bailey 1995).
11
   From a number of studies (referred to in Welu 1975), the distance between the map and the girl is calculated -via a projec-
tion- to be more than twice the distance between the girl and the soldier. Consequently the map appears to be smaller than its
                                                            [143]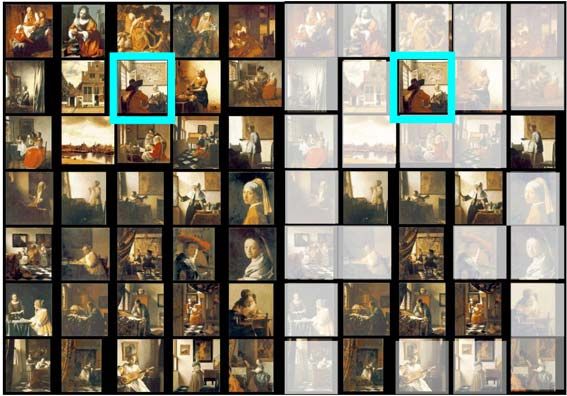
Figure 3. Johannes Vermeer: The painted map of Holland in Officer and laughing girl.

                              Figure 4. Camera obscura. Principle and implementation in painting

The camera obscura (literally dark chamber) is an optical device for projecting a scene onto a flat
surface. Its principle was to Arabs based on relevant findings by Aristotle, but its extensive use
starts in the 16th century, especially as a means for topographic purposes together to its common
use in arts12. The use of optical devices was popular at the time of Vermeer, among scientists and
artists. His fellow citizen and friend Anthony van Leeuwenhoek was experimenting with micro-
scopes and lenses. Carel Fabritius13 drew his remarkable View of Delft with the booth of a music
instrument merchant most probably by using a camera obscura with a lens (see URL16). Extensive
literature references on the use of optical devices by Vermeer can be found in Welu 1975).
 It seems that Vermeer was fond of this particular map, since he draws it in three of his paintings:
Officer and laughing girl, The love letter and Woman in blue reading a letter. In the last two

actual size (116 by 172 cm, including the text border). Other curious phenomena include the remarkable foreshortening of the
window to the left and the difference in size between the soldier and the girl. The whole setting suggests that the combination
of two images with the help of the camera obscura might have been ‘responsible’ for the composition.
12
  Together with the camera lucida (see e.g. URL15). The camera lucida was also used in map-making (see Livieratos,
2003).
13
  Another promising Delft painter, killed at the big explosion of 1654 at the age of thirty-two.
                                                              [144]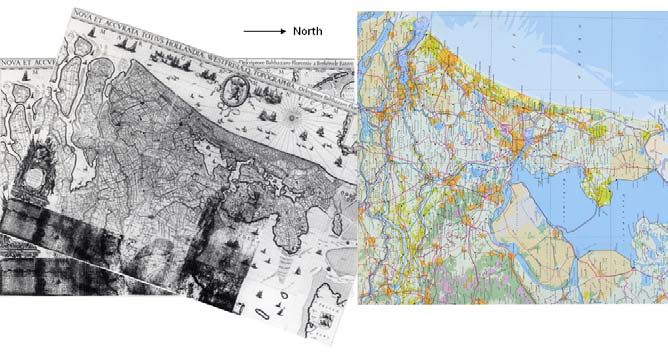
paintings the map is depicted only partially and in less bright colours, while in the first all of it is
visible. Actually this is the only map that appears more than once in paintings by Vermeer (refer
e.g. to note8); judging from the dates of these three paintings it might have been in his possession
for a long time.
The map was for the first time identified as early as 1929, by the Dutch cartobibliographer Freder-
ick C. Wieder (Wieder 1929; Welu 1975). Wieder identified the map as being a work of the early
seventeenth century by the Dutch cartographer Balthasar Florisz. van Berckenrode (1591-1644).
Most of the sources (bibliographical and on the Web, see e.g. URL17, URL18, indeed describe the
map appearing on this particular painting as dating from 1620 or 1621, created by Balthasar Flo-
risz. van Berkenrode and edited by Willem Jansz. Blaeu.
Published images of the map were not found on the Web, at least during the time of this research
(Spring 2003); they were located only in bibliographical sources such as in Welu 1975, 1977 and
Blonk-van der Wijst 2000. The last reference, in particular, contains a bulk of organized and elu-
cidating information not only about the map itself, but also on the history of three centuries
printed maps of the Netherlands; in the book the complete record of the whole series of conse-
quent editions of this map is given, as well as information about their current location. (see Blonk-
van der Wijst 2000: 221-248, maps no. 40-44). The similarity to the smallest detail between the
picture of the particular map and the one in Vermeer’s painting is indeed striking.
The first printed map of the Netherlands appears in 1542-3 and is issued by Jacop van Deventer.
The maps of the country for the period 1542 till ca 184014 comprise about one hundred different
editions (see op.cit.: 62-3); they can be classified into three main groups:
         A. The map of Jacop van Deventer (1542-3),
         B. The map of van Berckenrode-Blaeu (1621), and
         C. The map of Nicolas Visscher II (ca. 1690).
During the above period of time many things have changed in Holland e.g. polders have appeared,
as a result of land reclamation; such changes are particularly evident in the north of the Province
of North-Holland, in which we distinguish six types (I to VI) of the outline of the coast (see
op.cit.: 24, Fig. 12). The types I-IV fall in group A, type V belongs to group B and type VI to
group C.
The new mapping of Holland starts when the polder-boards of the three big polder Districts
(Delfland, Schieland and Rijnland), decide, around 1600, to have these Districts mapped, for their
organized administration. Between 1609 and 1616 Floris Balthasarsz. and his sons deliver the
maps of the Districts (URL19). The three Districts comprise a large part of Holland; therefore the
next plan was to make a new map of the whole of the country.
Since Floris Balthasarsz. had died, this project was carried out by his son Balthasar Florisz. He
supplied the first copies to the States of Holland in 1620, but by that time he was already in finan-
cial difficulties and was obliged to sell the copperplates and the privilege to Willem Jansz. Blaeu.
Thus, the map with the title Nova et accurata totius Hollandiae Westfrisiaeque Topographia (i.e.
the map depicted on the Vermeer painting) was published by Blaeu in 1621. It is a wall map con-
sisting of 22 sections printed from 17 copperplates measuring in all, 93 X 143 cm. It is not clear to
what extend Balthasar Florisz. himself surveyed the area outside the polder Districts. (i.e. Ri-
jnland, Delfland and Schieland ). It seems that he also used previous maps for that purpose
(op.cit.)

14
   By 1840 Holland was already divided in two parts: Provinces of North- and of South-Holland; the Provinces of South Hol-
land formed the country of Belgium.
                                                          [145]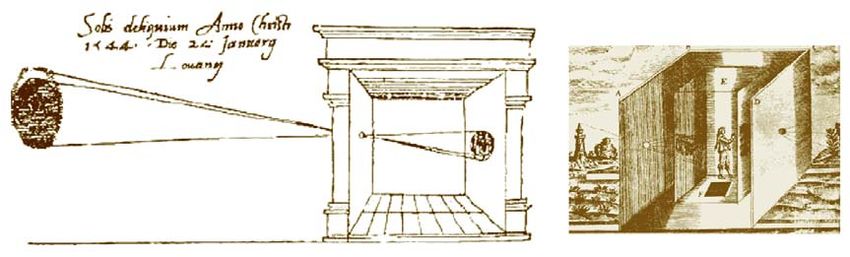
The map in question is described in the relevant bibliography as the van Berckenrode, Blaeu,
Visscher map; it appeared in various states during the course of time:
First state published by Balthasar Florisz. van Berckenrode himself.
      From the first state no copy has remained. It is definite that Balthasar Florisz. van Bercken-
      rode got permission by the United Provinces, in 1620, to publish a map of Holland and
      West-Friesland and that he indeed delivered twelve copies of this map to the States General,
      for which 144 pounds were paid to him on the 6th of June 1620. Van Berckenrode, however,
      got into great financial difficulties and the payment from the States was not enough for solv-
      ing his problems. He was therefore forced to sell the rights and the copperplates to Willem
      Jansz. Blaeu15.
Second state published by Willem Jansz. Blaeu in 1621.
     The area depicted by the map grossly coincides with that on the maps of group A, by Jacop
     van Deventer: Holland, the whole province of Utrecht, a part of Brabant, Gelderland and
     Friesland. Only in the east is the depicted area a bit smaller; on most of the maps by Van
     Deventer the Zuiderzee is depicted totally, on this map not. The most prominent difference
     between our map and the (older) maps of group A is the presence of roads, which are lack-
     ing in the van Deventer maps. The distinction between land- and waterways is very clear:
     waters are represented with a firm thick line and roads with two thin lines. Of this state
     hardly two copies are known to exist nowadays. Both of them are located in the Nether-
     lands:
       a. One in the city of Hoorn, at the AWG16: A mounted copy supplied with a letter-
           press text at the bottom, forming a wall map; the surrounding text is mounted on
           linen. The map is in bad condition. The copy is coloured -though faded. The text
           around the map (in Dutch) starts with an historical overview of the name(s) of
           the country and of the presence of the Dutch people in their land; it also gives
           information on the physical and human geography of the area through time
           (Fig.5, left).
       b. One in the city of Leiden, at the University Library, Collection Bodel-Nijenhuis:
           Incomplete copy in loose sheets without text; five sheets are missing at the bot-
           tom. This copy is in black and white (Fig.5, middle). This second map (the Lei-
           den copy) is in very good condition –it is in scale 1:110 000 (approx.); it is ac-
           tually a topographic map with all the characteristic details and the contents of a
           topographic map in such scale. The copperplates of the map later passed to the
           Visscher family, which published several editions beginning in 1637. In the
           process, the map underwent drastic changes in the lay-out and topography.
           Among the slightly newer editions, which were based on the original map of
           van Berckenrode from 1620, was the map that Henricus Hondius published in
           1629 (both as a wall-map and in folio format), after getting a privilege from the
           States General of the United Provinces of Netherlands (Fig.5, right).

15
   The transfer of publication rights and of the copper plates took place in Delft on 21 June 1621 and it is noted on the map
itself (on the Hoorn copy –this part is missing from the Leiden copy).
16
   Archiefdienst Westfriese Gemeenten (= Archive Service of the Municipalities of West Friesland; Hoorn is a city in West-
friesland, in the Province of Friesland, at the northern part of The Netherlands).
                                                           [146]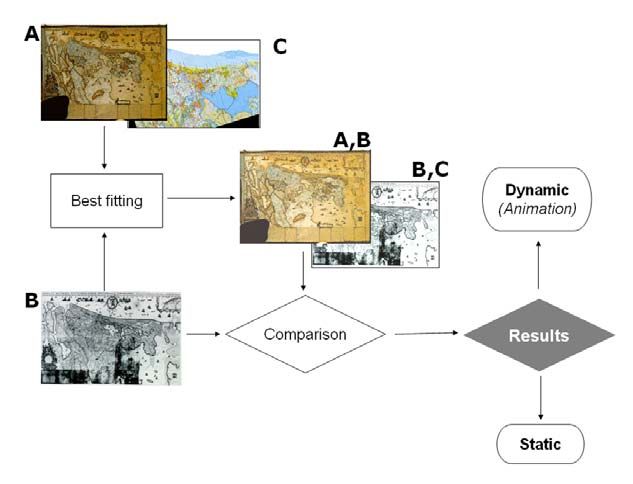
Figure 5. The three similar maps of the United Provinces derived from van Berckenrode’s original (1620). Left: The Hoorn
                               copy. Middle: The Leiden copy. Right: The Hondius version.

Figure 6. The van Berckenrode’s original map (left) as rotated clockwise by 18,5 degrees to fit the actual North direction as
                        oriented in a modern map (right) representing the same geographic area

              Figure 7. The van Berckenrode’s original map conformally best fitted to a modern map

                                      The painted map vs the model map

After having identified the map depicted in Vermeer’s painting, a number of legitimate questions
raised, in the context of the cartographic comparative analysis philosophy which is developing in
Thessaloniki since the early 1980’s (Koussoulakou, Livieratos and Rossikopoulos 1983: 127. For
a recent discussion, see Livieratos 2006b: 165).
The questions are summarized in the following:

                                                           [147]
• What is the degree of similarity between the painted map by Vermeer and
its actual model?
• Did the painter follow a sort of free-hand method in painting the map or did
he follow a more attentive technique?
• How is it possible to ‘see’ the cartographic differences in an apprehensive
way accessible to the general public interested in Arts?
The method which has to be adopted in answering these questions is the comparative analysis of a
pair of maps which involves best fitting processes for the transformation of the painted map into
the model map, assuming the conservation of some properties in the transformation (Boutoura
and Livieratos 2006: 60). In order to do so, the two maps involved in the analysis, have to be
given in digital form in order to perform the proper methodology for the cartographic comparison.
Figure 8. The comparison process
The result of the comparison can be two-fold, either static, represented by still overlapping im-
ages with given opacity or dynamic in terms of animated image, following a morphing process
(Livieratos 2006a: 71). An alternative is to study the fitting of the model map used by Vermeer
with a modern map of the Netherlands, which provides the possibility to study how the spatial
environment has changed during the last three centuries.
Such types of comparison are nowadays much easier to apply than in the past thanks to the tools
offered by the new digital technologies. Issues of interest in History of Cartography reveal new
‘hidden insights’ after having used such analytical tools. A typical example concerning the study
of old maps is the implementation of deformation analysis for the study of alterations in size and
shape of old maps with respect to modern counterparts. Such deformation analysis was attempted,
for the two maps mentioned before (i.e. the map on the painting and its original -old- topographic
counterpart).
In this paper the comparative method of analysis is applied on the painted map and its model
map, by transforming optimally one onto the other. Apart from the analytical and digital compo-
nent of the process, an interesting result is the visual representation of the transformation (dy-
namic morphing) from one map to the other, which in fact leads to animation. This revealed some
[148]remarkable indications about the method followed by the artist using the camera obscura in his
painting.
Two types of fitting the painted map onto model map are used in this study (Fig. 8). The first is a
‘similarity’ best fitting and the second is a ‘projective’ fitting (Boutoura and Livieratos 2006: 65).
Both fittings lead to a general comment about the remarkable overall agreement of the two maps.
Proceeding to the fitting analysis we observe the following:
a. The ‘similarity’ fitting is keeping unaltered the shape of the painted map and the
comparison with the model is shown in the still image of Fig. 9, where Vermeer’s
painted map is in dark and van Berckenrode’s model map is in light. From the rele-
vant animated comparison (click here for on-line dynamic visualization – Anima-
tion 1) we observe that no point is fixed and the overall fitting motion is rather ran-
dom.
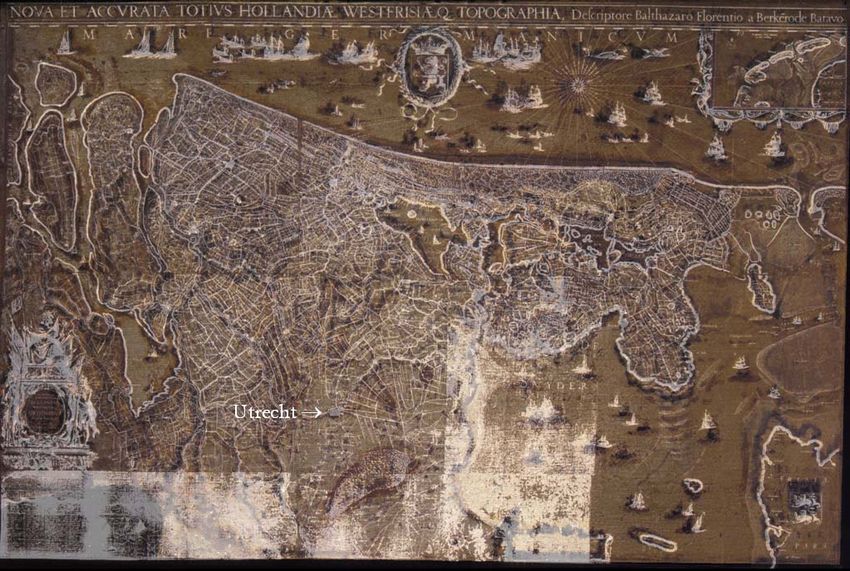
b. The ‘projective’ fitting is actually testing the camera obscura scenario. The result is
shown in the still image of Fig. 10, where Vermeer’s painted map is in dark and van
Berckenrode’s model map is in light. With this fitting, it is attempted to restore the
eventual central projection effect, inherent in the painted map, caused by the use of
the camera obscura. From the relevant animated comparison (click here for on-line
dynamic visualization – Animation 2) we observe that the major spatial differences
are concentrated at the edges of the painted map, while at the painting’s centre the
agreement is higher. The fitting is moving almost radially around a fixed point
which coincides with the city of Utrecht! This very interesting result supports the
camera obscura scenario.
In the interactive Fig. 11, the animation strip in sixteen frames is generating (in direct and inverse
modes) the dynamic visualization of the comparison between the model map and the best fitted
painted map (here the comparison uses the ‘projective’ fitting).
According to the ‘projective’ fitting, the position of the area with less deformation which coin-
cides with Utrecht supports a possible hypothesis that the axis of the camera obscura was target-
ing the map at that position, which in Fig. 12, is shown in a red dot centred on the city of Utrecht
at three relevant different images, i.e. the painted map, the model map and the whole painting.
The presumed camera obscura axial targeting at Vermeer’s painting, focused on the city of
Utrecht, is not at the exact geometric centre of the painting defined by the blue orthogonal lines in
Fig. 12. The city of Utrecht is at the centre of the red orthogonal lines (Fig. 12) defining the pre-
sumable targeting centre of the camera obscura axis. The red ‘vertical’ line deviates to the right,
passing from the closest vicinity of the hands of the soldier and the girl and from the geometric
centre of the map, developing, in this way, a certain balance in the setting of the persons and of
the hanging map.
The red ‘horizontal’ line is at a level relevant to the height of a standing-up person, above the
heads of the sitting soldier and the smiling girl. This line is also dividing in half the window
frame. In other words, the red orthogonal reference system looks like preserving the intrinsic bal-
ance of the whole painting; thus, a point on the map such as Utrecht is likely a proper target to fix
the camera obscura’s optical axis.
[149]Figure 9. The still image derived from the ‘similarity’ best fitting of Vermeer’s painted map (dark)
on van Berckenrode’s model map (light).
Figure 10. The still image derived from the ‘projective’ best fitting of Vermeer’s painted map (dark)
on van Berckenrode’s model map (light). Utrecht is fitted perfectly in both images.
[150]Figure 11. The sixteen frames of the animation strip which generates the dynamic visualization
of the comparison. It can be seen in two opposite modes: a) Click here – Animation 2 – to see in animation how the model
map is transformed to the painted map (under projective fitting); b) Click here – Animation 3 – to see in animation how the
painted map (under projective fitting) is transformed to the model map.
Figure 12. The red spot is centred on the city of Utrecht, the presumed axial targeting
at Vermeer’s painting by camera obscura. The blue orthogonal lines define the geometric centre of the painting and the red
the presumably ‘operational’ centre for the painting.
Conclusions
The presence of maps in art is important, particularly in paintings of the 17th century in the Neth-
erlands. A prominent example in this school is Vermeer, who depicted maps in almost a quarter
out of his work. The maps on these paintings are exact copies of originals that have all been iden-
tified. Thus, a topic worth studying, in the frame of cartographic heritage, is how these apparent
similarities (i.e. between maps and their painted versions) can be compared in a more systematic
way and how the results of such comparisons can be visualized for better understanding the rela-
tions between the painted map and the model counterpart. This is actually an elegant example of
how digital technologies are implied in the matters of cartographic heritage offering nowadays the
chance for research on such topics. The visualization of deformation analysis for old maps is ap-
plied here to compare the painted image of a map with its original counterpart.
In this work, we apply the map comparison methodology on the map painted by Vermeer in his
masterpiece “Officer and laughing girl” with respect to the original map on which the painting
was based. Postulating the use of the camera obscura by Vermeer, we applied a projective trans-
formation for the fitting of the painted map onto the model map. The selection of projective fitting
is supported by the assumption about the use of the camera obscura which in fact is operating ac-
cording to the principle of central projection (valid in photography as well). The results shown,
either in still overlapping opacity images or in animated versions, seem to verify the assumption.
In addition, the identification of the city of Utrecht, as the target-point of the camera obscura ge-
ometry, was verified especially by the results of the animated visualization of the best fitting
[151]process. Of course, the findings in this study are not solving ‘completely’ the problem mainly be-
cause the image-sources used in the analysis, concerning the Vermeer’s painting and the van
Berckenrode’s model-map, are suffering alterations implied by the copying procedures (see, e.g.
Tsioukas, Daniil and Livieratos 2006). On the other hand, here we used one of the model maps
available, namely the Leiden copy. It would be interesting to repeat the analysis using also the
Hoorn copy as model map.
Nevertheless, even using the sources given at a certain level of fidelity to the originals, the results
obtained are undoubtedly worth taking in consideration because they provide a great degree of
approximation to the ‘complete’ solution of the problem. Needless also to say, that such type of
analyses contributes to the enrichment of the ‘world’ of cartographic heritage with gains from
Arts, attracts the interest of the ‘world’ of Arts for cartographic heritage and tests the analytical
tools available in order to understand better the methods, techniques and instrumentation used
during the ante-photography period in the relevant activities of human intellect and talent.
Acknowledgements
Thanks are due to Dr. James Welu, Director, Worcester Art Museum, Worcester, MA, USA, Dr.
Charles van den Heuvel, Universiteits Bibliotheek, Bodel-Nijenhuis Collection, Leiden, The
Netherlands and Mr. Jan de Bruin, Archiefdienst Westfriese Gemeenten (Archive Service of the
Municipalities of West-Friesland), Hoorn, The Netherlands, for their kind support in providing
information and data.
References
Alpers S. 1987. The mapping impulse in Dutch art. In D. Woodward (ed.) Art and cartography.
Six historical essays. Chicago: The University Press, 51-96.
Bailey A. 2001. A view of Delft. Vermeer then and now. London: Chatto & Windus
Bailey M. 1995. Vermeer. Phaidon.
Barber P., C. Board (eds.) 1993. Tales from the map room. London: BBC Books.
Blonk-van der Wijst D. and J. 2000. Hollandia Comitatus – Een kartobibiliografie van Holland.
Hes & De Graaf Publishers BV, The Netherlands.
Boutoura C., E. Livieratos 2006. Some fundamentals for the study of the geometry of early maps
by comparative methods. e_Perimetron 1 (1): 60-70 [In digital form www.e-perimetron.org].
Gombrich E. 1984. The Story of Art. Phaidon.
Hill G. 1993. In the realms of love and allegory. In P. Barber and C. Board (eds.) Tales from the
Map Room. London: BBC Books.
Koussoulakou A., E. Livieratos, D. Rossikopoulos 1983. Deformation analysis of historical maps,
Quaterniones Geodaesiae, 4 (2), 127-148, (in Greek).
Koussoulakou A., E. Livieratos, 2000. Maps and the Internet: Towards another cartography? In
Proc. 6th National Cartographic Conference, Cartography in evolution. Athens: Hellenic Carto-
graphic Society, 345-352 (in Greek).
Livieratos E. 2001. Comments on cartography, maps and the relevant Greek ‘implications’. Geog-
raphies, 1, 56-72 (in Greek).
Livieratos E. 2002. A Tour into Cartography and Maps: 25 centuries from the Ionians to Ptolemy
and to Righas. Thessaloniki: National Centre for Maps and Cartographic Heritage (in Greek).
[152]Livieratos E. 2003. The first scientific map of Northern Greece. In E. Livieratos (ed.) Map Sheets
of Northern Greece. The first mapping, end of 19th –beginning of 20th centuries. Thessaloniki: Na-
tional Centre for Maps and Cartographic Heritage (in Greek).
Livieratos E., A. Koussoulakou, 2004. ‘Maps in grand painting’ (in Greek), presented at the 8th
Hellenic Cartographic Conference, Thessaloniki, November 2004 (Proceedings in publica-
tion)
Livieratos, E. 2006a. The use of animation in visualizing deformations of a portolan-type
map. e_Perimetron, 1 (1): 71-76 [In digital form www.e-perimetron.org].
Livieratos E. 2006b. On the study of the geometric properties of historical cartographic represen-
tations. Cartographica, 41 (2), 165-175.
Schneider N. 2001. Vermeer. Taschen.
Sittl K. 1885. Der Adler und die Weltkugel als attribute des Zeus in der griechischen und
roemischen Kunst. Jahrbuch der classischen Philologie, Supplementbd. XIV, 42-43.
Stammler W., 1959. Frau Welt. Eine mittelarlterliche Allegorie. Freiburg.
Tsioukas V., M. Daniil, E. Livieratos 2006. Possibilities and problems in close range non-contact
1:1 digitization of antique maps. Presented at the First International Workshop Digital approaches
to cartographic heritage, ICA WG ‘Digital technologies in cartographic heritage’, Thessaloniki,
18-19 May.
Welu J. A. 1975. Vermeer: His Cartographic Sources. Art Bulletin 57, 529-547.
Welu J. A. 1977. Vermeer and Cartography, PhD. dissertation, Boston University.
Wieder F. C. 1929. Monumenta Cartographica, III. The Hague, 70 (55).
Woodward D. (ed.) 1987. Art and cartography. Six historical essays. Chicago: The University
Press, 51-96.
Woodward D. 1999. Keynote address. 19th ICA Conference, Ottawa, August. (Personal communi-
cation: Draft text)
Zandvliet K. 1998. Mapping for money. Maps, plans and topographic paintings and their role in
Dutch overseas expansion during the 16th and 17th centuries. Amsterdam: Batavian Lion Interna-
tional
Web sites
URL1: http://es.rice.edu/ES/humsoc/Galileo/Catalog/catalog.html
URL2: http://socrates.berkeley.edu/~ah172/prints/loanda.htm
An example of a battle map: The Conquest of Loanda
URL3: http://www.unh.edu/music/Icon/itrknlid.htm
Balthasar Florisz. van Berckenrode is referred to as artist of outdoor battles
URL4: http://home.wxs.nl/~marcel.tettero/Haarlem/Veerhuisje.html
Reference to Balthasar Florisz. van Berckenrode. as oorlogsfotograaf (=war photogra-
pher)
URL5: http://www.stub.unibe.ch/stub/ryhiner/mapmak/b1.html
Reference to Balthasar Florisz. van Berckenrode (profession, place, date).
[153]URL6: http://www.waalsekerk-amsterdam.nl/gesch2.htm
Some History of Amsterdam and Holland (the 80-year war, start: 1568) and a (fragment of
a) large-scale 3D perspective city map of A’dam by Balthasar Florisz. van Berckenrode.
URL7: http://www.ridinger-niemeyer.com/maps/12581_e.htm
Balthasar Florisz. van Berckenrode referred to as surveyor.
URL8: http://bc.leidenuniv.nl/goedgezien/objectbeschrijvingen/object117.htm
‘The battle near Nieuwpoort’, by Balthasar Florisz van Berckenrode.
URL9: http://home.kabelfoon.nl/~jdebruin/Updateframe.html
A bird’s eye view: large-scale city map by Balthasar Florisz van Berckenrode.
URL10: http://www.bib.wau.nl/speccol/lokaties.html
Reference to a garden map by Balthasar Florisz van Berckenrode (large scale, painting
like).
URL11: http://www.historietilburg.nl/tijdschrift/10.6/528.htm
A bird’s eye view map of Rotterdam by Floris Balthasar van Berckenrode (father) and
more on mapmaking at the time.
URL12: http://www.xs4all.nl/~kalden
A virtual Vermeer and Delft tour
URL13: http://essentialvermeer.20m.com
The essential Vermeer lover –a comprehensive site.
URL14: http://www.bbc.co.uk/history/society_culture/art/vermeer_camera_01.shtml
Vermeer and the camera obscura.
URL15: http://www.americanscientist.org/bookshelf/Leads02/teuber.html
About optical devices such as the camera obscura and the camera lucida used in art.
URL16: http://www.kfki.hu/~arthp/html/fabritiu/view_del.htm
A view of Delft by Carel Fabritius’ wide-angle lens.
URL17: http://palimpsest.stanford.edu/byform/mailing-lists/exlibris/1996/10/msg00145.html
Reference to the 1621 map of van Berckenrode in Officer and laughing girl.
URL18: http://www.cacr.caltech.edu/~roy/vermeer/hdy.html
The 1621 map of van Berckenrode in Officer and laughing girl.
URL19: http://bc.leidenuniv.nl/cbn/selec/inhoud.htm
The first systematic mapping of the polder-districts Rijnland, Delfland and Schieland
by the van Berckenrode family.
[154]You can also read