VERMILION ENERGY INVESTOR PRESENTATION - DECEMBER 2021

Page created by Eva Rojas
 
CONTINUE READING
VERMILION ENERGY INVESTOR PRESENTATION - DECEMBER 2021
DECEMBER 2021

VERMILION ENERGY INVESTOR PRESENTATION
 INTERNATIONALLY DIVERSIFIED | FREE CASH FLOW FOCUSED | ESG LEADERSHIP
VERMILION ENERGY INVESTOR PRESENTATION - DECEMBER 2021
VERMILION’S KEY ATTRIBUTES
                                                                                                                                                                                                                                                               PRODUCITON
                                                                                                                                                                                                                                                            (2022E PRO FORMA
                                                                                                                                                                                                                                                          CORRIB ACQUISITION)**

           ►        Compelling investment with growing free cash flow, accelerated deleveraging and                                                                                                                                                           OIL (BRENT)
                    return of capital                                                                                                                                                                                                                             16%      EUROPEAN
                                                                                                                                                                                                                                                                              GAS
                       o       Trading at one of the highest FCF yields (>35%)* and one of the largest valuation discounts                                                                                                                                 OIL /              22%

                               compared to peers**                                                                                                                                                                                                     CONDENSATE /
                                                                                                                                                                                                                                                           NGL
                                                                                                                                                                                                                                                          (WTI)           NORTH
                       o       2021E / 2022E free cash flow in excess of $500MM (>$3.00/share) / $1B (>$6.00/share)***                                                                                                                                     36%         AMERICAN
                                                                                                                                                                                                                                                                           GAS
                       o       Plan to reinstate $0.06 quarterly dividend in Q1 2022                                                                                                                                                                                       26%

                                  ▪        Paid over $40 per share of dividends from 2003 to early 2020
                                                                                                                                                                                                                                                         FFO CONTRIBUTION
                                                                                                                                                                                                                                                          (2022E PRO FORMA
           ►        Internationally diversified asset portfolio enhances margins and free cash flow                                                                                                                                                     CORRIB ACQUISITION)**

                       o       Exposure to premium global commodity prices results in top decile netbacks and reduces cash                                                                                                                                        OIL (BRENT)
                               flow volatility                                                                                                                                                                                                                        17%

                       o       European natural gas forward prices over $30/mmbtu and Brent over US$3/bbl premium to WTI                                                                                                                                  OIL /
                                                                                                                                                                                                                                                      CONDENSATE /       EUROPEAN
                                                                                                                                                                                                                                                                            GAS
                       o       Combination of high margin, low decline assets with strong capital efficiencies translates to                                                                                                                              NGL
                                                                                                                                                                                                                                                         (WTI)              42%
                               strong free cash flow                                                                                                                                                                                                      31% NORTH
                                                                                                                                                                                                                                                                AMERICAN
                                                                                                                                                                                                                                                                  GAS
                                                                                                                                                                                                                                                                   9%

* Based on Peters & Co. research, 2022E unhedged FCF yield (see slide 12). ** Based on National Bank Financial research (see slide 13). *** 2021E FCF estimate based on 2021 guidance and November 26, 2021 commodity strip pricing (see slide 36). 2022E FCF estimate
based on 2022 guidance and includes the annualized impact of the Corrib Acquisition using November 26, 2021 commodity strip pricing (see slide 36). FCF is a non-standardized measure (see Advisory) defined as FFO less E&D Capex.                                                   2
VERMILION ENERGY INVESTOR PRESENTATION - DECEMBER 2021
VERMILION’S KEY ATTRIBUTES

          ►       Financially disciplined with a focus on balance sheet strength and returning capital to shareholders
                      o       2022E year end net debt less than $1.3B* with a net debt to trailing FFO ratio of
VERMILION ENERGY INVESTOR PRESENTATION - DECEMBER 2021
CAPITAL MARKETS SUMMARY

                                    Market Summary
                                    Trading Price (December 9, 2021)                                                                                              $14.39 (TSX), $11.32 (NYSE)
                                    Ticker Symbol (TSX & NYSE)                                                                                                                               VET
                                    Shares Outstanding (September 30, 2021)                                                                                                        162.0 million
                                    Average Daily Trading Volume (shares)                                                                                  2.2 million (TSX), 2.5 million (NYSE)
                                    Plan to reinstate a $0.06 quarterly dividend in Q1 2022
                                    Director and Employee Ownership *                                                                                                                                        5%
                                    Capital Structure
                                    Market Capitalization                                                                                                                                         $2.3 billion
                                    Enterprise Value                                                                                                                                              $4.1 billion
                                    Net Debt (including net working capital, September 30, 2021) **                                                                                               $1.8 billion
                                    2021E Net Debt-to-FFO Ratio ***                                                                                                                                      1.8x
                                    2022 Guidance (Excludes Corrib Acquisition )
                                    Production                                                                                                                                  83,000 – 85,000 boe/d
                                    E&D Capital Expenditures                                                                                                                                 $425MM

   PLAN TO REINSTATE A QUARTERLY DIVIDEND IN Q1 2022
* Based on outstanding shares. ** Net Debt is a non-GAAP measures (see Advisory). *** Based on November 26, 2021 strip and company estimates. 2021 strip pricing as at November 26, 2021: Brent US$70.62/bbl; WTI
US$67.71/bbl; LSB = WTI less US$3.92/bbl; TTF $18.92/mmbtu; NBP $18.40/mmbtu; AECO $3.57/mmbtu; CAD/USD 1.25; CAD/EUR 1.48 and CAD/AUD 0.94. Refer to the “FFO Sensitivity” slide in this presentation for          4
more details on pricing assumptions. Includes existing hedges.
VERMILION ENERGY INVESTOR PRESENTATION - DECEMBER 2021
ESG LEADERSHIP

               Environmental                   Vermilion is committed to reducing the environmental impact of traditional energy production, enriching and caring
                                               for the communities in which we live and work, and maintaining our strong corporate governance
                                                         ►      CDP Climate and Water scores of “B” in 2021 have us tied for the top decile for our industry
                                                         ►      S&P Global’s Corporate Sustainability Assessment (CSA)
                                                                   o      Ranked in the 80th percentile for our industry in 2021

                      Social                             ►      The Globe and Mail, Board Games
                                                                   o      Ranked 5th amongst our peer group, 7th amongst Canadian oil and gas companies in 2020
                                                         ►      MSCI ESG Research – “AA” ESG Rating in 2021*
                                                         ►      Institutional Shareholder Services (ISS) QualityScore
                                                                   o      Recognized as a leader in managing risk in our industry with a decile rating of “1” for Environmental and ”2” for Social practices
                                                         ►      Sustainalytics – Risk Rating of “31.4” in 2021 placing us third in our peer group**
                 Governance                              ►      In April 2021, Vermilion introduced near-term and long-term emission reduction targets
                                                                   o      Aspirational target of net zero emissions in our operations, including Scope 1 and Scope 2 emissions, by 2050
                                                                   o      Reducing Scope 1 emissions intensity from our operations by 15 to 20% by 2025 (baseline 2019)
                                                         ►      In October 2021, Vermilion achieved certification from Equitable Origin under the EO100™ Standard for
                                                                Responsible Energy Development (2017) for three of our natural gas production sites in Alberta

    READ MORE AT HTTP://SUSTAINABILITY.VERMILIONENERGY.COM
* The use by Vermilion Energy Inc of any MSCI ESG Research LLC or its affiliates (“MSCI”) data, and the use of MSCI logos, trademarks, service marks or index names herein, do not constitute a sponsorship, endorsement,
recommendation, or promotion of Vermilion by MSCI. MSCI services and data are the property of MSCI or its information providers, and are provided ‘as-is’ and without warranty. MSCI names and logos are trademarks or      5
service marks of MSCI. ** Peers with Sustainalytics scores include; ARX, CPG, ERF, MEG, MUR, PXT, TOU, WCP.
VERMILION ENERGY INVESTOR PRESENTATION - DECEMBER 2021
BUILDING A SUSTAINABLE FUTURE

          VERMILION RECOGNIZED BY BMO AS AN INDUSTRY
          LEADER IN ESG
          ►     Vermilion continues to rank in the top quartile in emissions
                intensity

          ►     Relative to its peers, Vermilion ranks well on total fresh water
                use per barrel of oil

          ►     Vermilion has strong ESG governance with a focused Board
                Committee, specialized management and greater
                management focused on achieving its ESG ambitions

          ►     Vermilion’s disclosure quality is above its Canadian peers

    VERMILION RANKS AS ONE OF THE MOST SUSTAINABLE ENERGY PRODUCERS
*Source: BMO ESG in Canadian Oil and Gas Report dated November 1, 2021.                         6
VERMILION ENERGY INVESTOR PRESENTATION - DECEMBER 2021
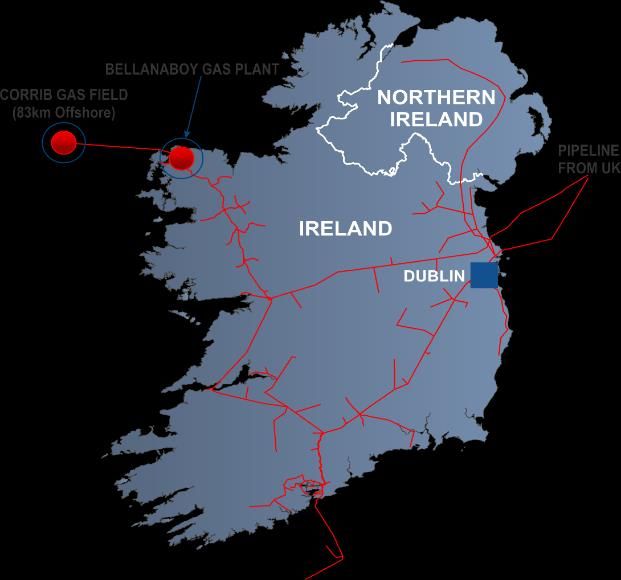
VALUE DRIVEN ACQUISTION STRATEGY

►   Target underexploited consolidation opportunities and new growth assets within existing core areas
     o   Accretive while minimizing equity dilution to maximize per share value
     o   Generates strong free cash flow in a mid-cycle pricing environment to support a sustainable dividend

►   Differentiated European franchise with over 24 years operating in Europe and acquiring from the majors
     o   We understand the regulatory environment and have built strong relationships with the key stakeholders
     o   International deal flow has historically been limited, but is accelerating
     o   We will continue to be patient and opportunistic as opportunities become available

►   Proven track record of acquiring and developing multi-zone horizons in North American basins
     o   Building on our success in west-central Alberta, we target core areas with multi-zone development potential and
         infrastructure synergies
     o   Will continue to evaluate North American opportunities where we can leverage our expertise and replicate this strategy

                                                                                                                                  7
VERMILION ENERGY INVESTOR PRESENTATION - DECEMBER 2021
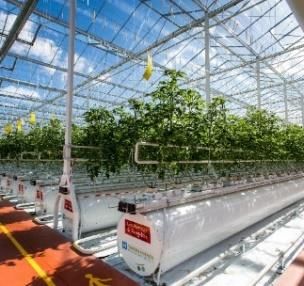
INVENTORY AND RESERVE LIFE OPTIMIZATION

                                                                                                                                                                           16

              ►        Vermilion actively manages its inventory and                                                                                                        14
                       acquisition strategy to optimize reserve life and
                       maximize shareholder value                                                                                                                          12

                                                                                                                                                                           10

                                                                                                                                                                   YEARS
              ►        Our conventional and semi-conventional asset                                                                                                        8
                       base requires low capital reinvestment due to low                                                                                                   6
                       decline rate and strong capital efficiencies
                                                                                                                                                                           4

                                                                                                                                                                           2
              ►        Our globally diversified asset base provides the
                       flexibility to combine high return PDP acquisitions                                                                                                 0
                                                                                                                                                                                     2010 2011 2012 2013 2014 2015 2016 2017 2018** 2019 2020
                       with longer-life inventory deals
                                                                                                                                                                                                     PDP - RLI*           2P - RLI*

      WE HAVE CONSISTENTLY MAINTAINED A PDP AND 2P RLI OF ~5 YEARS AND ~13 YEARS, RESPECTIVELY
* RLI calculated using year-end PDP and 2P reserves divided by average production the years. ** 2018 RLI adjusted to reflect full year production impact from Spartan acquisition.
                                                                                                                                                                                                                                                8
VERMILION ENERGY INVESTOR PRESENTATION - DECEMBER 2021
CORRIB CONSOLIDATION ACQUISITION

         ►      Acquisition of an incremental 36.5% interest, increases our operated ownership to 56.5%
                   o      ~7,700 boe/d of 2022E production expected to generate FFO of ~$365MM* and FCF** of ~$361MM*
                   o      Total consideration of $556 million with an effective date is January 1, 2022, anticipated to close 2H 2022
                   o      Interim FCF to be netted off purchase price, estimated cash to close of $200 to $300 million
                   o      ~70% of 2022E/2023E production hedged, provides high certainty of an approximate two-year payback
         ►      Highly accretive, accelerates deleveraging and enhances ability to return additional capital to shareholders
                   o      Reduces 2022 year-end net debt to trailing full-year pro forma FFO by ~11%* with incremental deleveraging in 2023 and beyond
                   o      2022E FFO and FCF per share accretion of 33% and 53%, respectively
                   o      Acquisition is self-funded with a quick 2-year payout and high 41% IRR, with ~75% of reserves remaining after payout
                   o      Deal structure eliminates need for equity issuance and maximizes FCF per share on a long-term basis which will enhance shareholder returns

         ►      Increases our exposure to premium priced European gas and rebalances international weighting
                   o      ~$130/boe netback in 2022
                   o      Adds over a decade of European gas production with end of field life estimated at 2034

   CONSOLIDATES INTEREST IN AN OPERATED HIGH MARGIN, LOW DECLINE AND LOW EMISSION ASSET
* Based on company estimates, the 2022 annualized impact of the Corrib Acquisition and commodity strip prices at November 26, 2021 including the impact of hedges. 2022 strip pricing as at November 26, 2021: Brent
US$68.92/bbl; WTI US$65.58/bbl; LSB = WTI less US$4.93/bbl; TTF $22.88/mmbtu; NBP $23.62/mmbtu; AECO $4.16/mmbtu; CAD/USD 1.28; CAD/EUR 1.45 and CAD/AUD 0.91. **FCF is a non-standardized measure (see
Advisory) defined as FFO less E&D Capex.
                                                                                                                                                                                                                       9
VERMILION ENERGY INVESTOR PRESENTATION - DECEMBER 2021
EXPOSURE TO EUROPEAN GAS ENHANCES NETBACKS
                                                                                             PRODUCTION                                                                                   FFO

                                                                                              OIL (BRENT)                                                                               OIL (BRENT)
                                                                                                  18%     EUROPEAN                                                                          23%
                                                                                                             GAS
                                                                                                             15%
                                                                                                                                                                                                       EUROPEAN
                     2022E VET BASE*                                                    OIL /
                                                                                    CONDENSATE /
                                                                                                                                                                                OIL /                     GAS
                                                                                                                                                                                                          24%
                                                                                                             NORTH                                                          CONDENSATE /
                                                                                        NGL                                                                                     NGL
                                                                                       (WTI)                AMERICAN
                                                                                                              GAS                                                              (WTI)             NORTH
                                                                                        39%                                                                                     41%             AMERICAN
                                                                                                              28%
                                                                                                                                                                                                  GAS
                                                                                                                                                                                                  12%

                                                                                            OIL (BRENT)                                                                              OIL (BRENT)
                                                                                                16%                                                                                      17%
                                                                                                            EUROPEAN
                                                                                                               GAS
                                                                                                                                                                              OIL /
                                                                                                               22%
                      2022 FULL YEAR                                                  OIL /
                                                                                                                                                                          CONDENSATE /       EUROPEAN
                                                                                                                                                                                                GAS
                                                                                                                                                                              NGL
                       PRO FORMA**                                                CONDENSATE /                                                                               (WTI)              42%
                                                                                      NGL                NORTH                                                                31%
                                                                                     (WTI)              AMERICAN                                                                     NORTH
                                                                                      36%                 GAS                                                                       AMERICAN
                                                                                                          26%                                                                         GAS
                                                                                                                                                                                       9%

* Based on company estimates and commodity strip prices at November 26, 2021, excluding the Corrib Acquisition. ** Based on company estimates, the 2022 annualized impact of the Corrib Acquisition and commodity
strip prices at November 26, 2021 including the impact of hedges. 2022 strip pricing as at November 26, 2021: Brent US$68.92/bbl; WTI US$65.58/bbl; LSB = WTI less US$4.93/bbl; TTF $22.88/mmbtu; NBP
$23.62/mmbtu; AECO $4.16/mmbtu; CAD/USD 1.28; CAD/EUR 1.45 and CAD/AUD 0.91.                                                                                                                                        10
POWDER RIVER BASIN CONSOLIDATION ACQUISITION

        ►      Strategic bolt-on acquisition adjacent to our existing Hilight field
                 o     20,000 net acres of land with multizone potential
                 o     1,500 boe/d of high netback oil production with 13.7 mmboe of 2P Reserves
                 o     Operating netback of ~$40/boe at current commodity prices
                 o     Total consideration of US$76MM funded with Q3 2021 FCF

        ►      Expands drilling inventory and optimizes the number of two-mile laterals
                 o     Increases Turner drilling inventory by 40 locations to 62* consisting of 24 one-
                       mile and 38 two-mile laterals
                 o     Two-mile wells deliver ~80% higher IP30 and EUR at a DCET cost that is
                       ~50% higher than a one-mile well

        ►      Assets are FCF positive and are expected to self-fund Turner
               development over the next 5+ years
                                                                                                          Vermilion
        ►      Longer-term development potential from emerging Niobrara and Parkman                       Acquisition

                 o     >200 internally estimated drilling locations on Vermilion acreage
   STRATEGIC BOLT-ON ACQUISITON CONSOLIDATES LAND BASE IN A BASIN WITH MULTI-ZONE DEVELOPMENT POTENTIAL
* Comprised of 40 2P booked undeveloped locations and 22 internal inventory estimates
                                                                                                                        11
INTERNATIONAL DIVERSIFICATION

                                12
THREE CORE OPERATING AREAS

                                                                                                                                                                                            2022E PRO FORMA
                                                                                                                                                                                           CORRIB ACQUISITION*

                                                                                                                                                                                 PRODUCTION                             E&D CAPEX

                                                                                                                                                                                                 INT
                                                                                                                                                                                                 39%                   N.A.         INT
                                                                                                                                                                                    N.A.                               50%          50%
                                                                                                                                                                                    61%

                                                                                                                                                                                         FFO                                  FCF

                                                                                                                                                                                  N.A.                                 N.A.
                                                                                                                                                                                  40%                                  37%
                                                                                                                                                                                                 INT                                INT
                                                                                                                                                                                                 60%                                63%

   VERMILION FOCUSED IN THREE CORE AREAS – NORTH AMERICA, EUROPE AND AUSTRALIA
* Based on company estimates, the 2022 annualized impact of the Corrib Acquisition and commodity strip prices at November 26, 2021 including the impact of hedges. 2022 strip pricing as at November 26, 2021: Brent
US$68.92/bbl; WTI US$65.58/bbl; LSB = WTI less US$4.93/bbl; TTF $22.88/mmbtu; NBP $23.62/mmbtu; AECO $4.16/mmbtu; CAD/USD 1.28; CAD/EUR 1.45 and CAD/AUD 0.91. Refer to the “FFO Sensitivity” slide in this                               13
presentation for more details on pricing assumptions.
GLOBAL CRUDE OIL PRICING ADVANTAGE

                                                                                                                                                                              OIL PRICES
        ►      In aggregate, Vermilion’s global crude oil portfolio has                                                                 $90

               sold at an average $5.00/bbl premium to the Canadian
                                                                                                                                        $80
               light oil benchmark (MSW) over the past 7 years
                                                                                                                                        $70
        ►      Approximately 35% of Vermilion’s crude oil production is
               priced with reference to Dated Brent*

                                                                                                                               C$/bbl
                                                                                                                                        $60
                 o      Vermilion’s 2021 Australian crude selling at an
                        approximate US$11.00/bbl premium to Dated Brent                                                                 $50

        ►      Vermilion has significant leverage to oil prices                                                                         $40

                 o      US$1/bbl increase generates approximately $16MM of                                                              $30
                        incremental FFO on an annual unhedged basis                                                                              2015          2016          2017           2018          2019       2020      2021E*
                                                                                                                                                                      VET Realized                           MSW (Cdn Light)

    VERMILION’S OIL PORTFOLIO PROVIDES EXPOSURE TO PRICE-ADVANTAGED BENCHMARKS
* 2021 estimate based on November 26, 2021 strip pricing and company estimates. 2021 strip pricing as at November 26, 2021: Brent US$70.62/bbl; WTI US$67.71/bbl; LSB = WTI less US$3.92/bbl; TTF $18.92/mmbtu;
NBP $18.40/mmbtu; AECO $3.57/mmbtu; CAD/USD 1.25; CAD/EUR 1.48 and CAD/AUD 0.94.                                                                                                                                                        14
PREMIUM EUROPEAN NATURAL GAS PRICING

        ►       European natural gas forward prices currently                                                                                                 GLOBAL NATURAL GAS PRICES                              >C$40/
                trading at ~C$30.00/mmbtu for 2022 and                                                                                                                                                               mmbtu
                ~C$17.00/mmbtu for 2023, supported by:                                                                                 $25

                  o      Low domestic storage levels coupled with forecasted
                         cold weather could drive even higher prices                                                                   $20

                         Declining European domestic production

                                                                                                                           C$/MMBTU*
                  o
                                                                                                                                       $15
                  o      Increasing European carbon pricing
                  o      Rising use of gas in the power sector                                                                         $10

        ►       Vermilion’s historical corporate average realized gas
                                                                                                                                       $5
                price is significantly higher than AECO and is further
                enhanced with the Corrib Acquisition                                                                                   $0

        ►       Vermilion has significant leverage to European
                                                                                                                                             VET Corporate      Euro Gas (NBP)        AECO          NBP Prompt   Corrib Acquisition
                natural gas price (+C$1/mmbtu = +$22MM of FFO)                                                                               Realized Price                                                      Hedge Price

EUROPEAN NATURAL GAS FORWARD PRICES TRADE AT A 3 TO 6 TIMES HIGHER MULTIPLE VERSUS NORTH AMERICA
* 2011 – November 2021: Actual prices. December 2021E - 2023E Forwards as at November 26, 2021. ** 2022E VET corporate realized price includes full-year pro forma impact from the Corrib Acquisition                                 15
EUROPEAN GAS MARKET FUNDAMENTALS

          ►      Declining European domestic production results in higher                         €/ton    EMISSION ALLOWANCES (EUA CARBON CREDITS)
                                                                                                                        PRICE HISTORY*
                 dependence on imports                                                             90.00
                                                                                                   80.00
                     o    Groningen field will cease production in October 2022                    70.00
                     o    Mature North Sea production is in decline                                60.00
                                                                                                   50.00
                                                                                                   40.00
        ►      Power sector gas demand growth accelerated                                          30.00
                 o       Germany (Europe's largest power consumer) have recently                   20.00
                                                                                                   10.00
                         accelerated the phase out of coal power generation from previous
                                                                                                    0.00
                         target of 2038 to 2030                                                      1/1/2016   1/1/2017   1/1/2018   1/1/2019   1/1/2020     1/1/2021
                 o       Gas will serve as a transition fuel during renewable’s buildout period                        Emission Allowances (Carbon Credits)

        ►      Emission allowance prices (EUA carbon credits) are trading at record highs, prices reflect European climate policy
                 o       European gas prices hold a positive price relationship with EUA’s
        ►      Lack of clarity on pipeline flows from Russia, and an overall question around Russian gas dependence has placed
               LNG as the marginal source of supply in 2021
                 o       LNG is a globally competitive market due to strong Asian demand which has seen record high prices this year
  STRONG MARKET FUNDAMENTALS SUPPORT HIGHER EUROPEAN GAS PRICES
* Source: ICE European Union Allowance (EUA) Prompt Futures
                                                                                                                                                                         16
ENHANCED OPERATING NETBACK

                                                                                                 2022E OPERATING NETBACKS
                                               $60.00                                                                                                                                                                        100%
                                                                                                                                                                                                                             90%
            2022E OPERATING NETBACK ($/BOE)*

                                               $50.00

                                                                                                                                                                                                                                    2022E LIQUIDS WEIGHTING (%)*
                                                                                                                                                                                                                             80%
                                                                                                                                                                                                                             70%
                                               $40.00
                                                                                                                                                                                              AVERAGE = $32.24               60%
                                               $30.00                                                                                                                                                                        50%
                                                                                                                                                                                                                             40%
                                               $20.00
                                                                                                                                                                                                                             30%
                                                                                                                                                                                                                             20%
                                               $10.00
                                                                                                                                                                                                                             10%
                                                $0.00                                                                                                                                                                        0%
                                                        VET**   CPG   BTE     WCP    TVE          ARX          ERF          POU          NVA          ATH          KEL          BIR         PEY          AAV           TOU
                                                                       BASE          PRO FORMA CORRIB ACQ.                                AVERAGE                      LIQUIDS WEIGHTING

   VERMILION’S INTERNATIONALLY DIVERSIFIED ASSETS PRODUCE TOP DECILE NETBACKS
*Source: RBC Estimates from November 22, 2021 comp tables based on 2022 futures pricing as follows: WTI US$71.93/bbl; NYMEX US$4.43/mmbtu. ** Based on company estimates, the 2022 annualized impact of the
Corrib Acquisition and commodity strip prices at November 26, 2021 including the impact of hedges. 2022 strip pricing as at November 26, 2021: Brent US$68.92/bbl; WTI US$65.58/bbl; LSB = WTI less US$4.93/bbl; TTF
$22.88/mmbtu; NBP $23.62/mmbtu; AECO $4.16/mmbtu; CAD/USD 1.28; CAD/EUR 1.45 and CAD/AUD 0.91.
                                                                                                                                                                                                                                                                   17
FOCUS ON FREE CASH FLOW
    & PROFITABILITY

                          18
FUND FLOWS FROM OPERATIONS

                                                           $1,600

                                                           $1,400

                                                           $1,200
                                        ANNUAL FFO ($MM)

                                                           $1,000

                                                            $800

                                                            $600

                                                            $400

                                                            $200

                                                              $0
                                                                                 2018                                       2019                                      2020                                    2021E*                                    2022E**
                                                                                                         E&D CAPEX                           FCF                PRO FORMA CORRIB ACQ.

   OUR HIGH MARGIN, LOW DECLINE ASSETS HAVE THE ABILITY TO GENERATE SIGNIFICANT FREE CASH FLOW
* Based on company estimates and November 26, 2021 strip pricing. . 2021 strip pricing as at November 26, 2021: Brent US$70.62/bbl; WTI US$67.71/bbl; LSB = WTI less US$3.92/bbl; TTF $18.92/mmbtu; NBP $18.40/mmbtu; AECO $3.57/mmbtu; CAD/USD 1.25; CAD/EUR 1.48 and
CAD/AUD 0.94. ** Based on company estimates, the 2022 annualized impact of the Corrib Acquisition and commodity strip prices at November 26, 2021 including the impact of hedges. 2022 strip pricing as at November 26, 2021: Brent US$68.92/bbl; WTI US$65.58/bbl; LSB = WTI less
US$4.93/bbl; TTF $22.88/mmbtu; NBP $23.62; AECO $4.16/mmbtu; CAD/USD 1.28; CAD/EUR 1.45 and CAD/AUD 0.91.. Includes existing hedges. FCF presented as FFO less E&D Capital.                                                                                                          19
FREE CASH FLOW YIELD

                                                         2022E FCF YIELD*                                                                                                                                  2022E DAFCF YIELD*
          60%                                                                                                                                               35%

          50%                                                                                                                                               30%

                                                                                                                                                            25%
          40%
                                                                                                                                                            20%
                                                                                                                                                                                                                                                                           AVERAGE = 17%
          30%
                                                                                                                                                            15%
                                                                                                           AVERAGE = 20%
          20%
                                                                                                                                                            10%

          10%
                                                                                                                                                              5%

            0%                                                                                                                                                0%

                                 2022E                     PRO FORMA CORRIB ACQ.                                        AVERAGE                                                         2022E                    PRO FORMA CORRIB ACQ.                                          AVERAGE

  VERMILION’S 2022E PRO FORMA FCF YIELD AND DAFCF YIELD ARE THE HIGHEST AMONGST OUR PEERS
*Source: Peters & Co. estimates as of December 6, 2021, using Peters & Co. 2022 base price deck: WTI US$66.75/bbl; Brent US$70.18/bbl; NYMEX US$3.65/mmbtu; AECO $3.27/mcf. Canadian based companies represented, with >50,000 boe/d of 2021E production based on
Peters & Co.’s estimates. FCF Yield = (Unhedged Cash Flow – Sustaining Capital Expenditures) / Market Capitalization. DAFCF Yield = (Unhedged Cash Flow – Sustaining Capital Expenditures + Interest Expense) / Enterprise Value. ** Based on company estimates, the 2022
annualized impact of the Corrib Acquisition and commodity strip prices at November 26, 2021 including the impact of hedges. 2022 strip pricing as at November 26, 2021: Brent US$68.92/bbl; WTI US$65.58/bbl; LSB = WTI less US$4.93/bbl; TTF $22.88/mmbtu; NBP $23.62/mmbtu;              20
DISCOUNTED EV/DACF MULTIPLE

                                                                                                                     2022E EV/DACF (UNHEDGED)*
                               6.0x
                               5.5x
                               5.0x
                               4.5x
                               4.0x                    AVERAGE 3.7x
                               3.5x
                               3.0x
                               2.5x
                               2.0x
                               1.5x
                               1.0x
                               0.5x
                               0.0x
                                            VET           CPG           ERF           NVA           ARX            PEY           BTE           BIR          WCP            AAV           TOU           POU           MEG           CVE            SU           CNQ
                                                                                                                                      2022E EV/DACF                         AVERAGE

   VERMILION TRADES AT ONE OF THE LOWEST EV/DACF MULTIPLES RELATIVE TO ITS PEERS
*Source: Peters & Co estimates as of December 6, 2021, using Peters & Co. 2022 base price deck: WTI US$66.75/bbl; Brent US$70.18/bbl; NYMEX US$3.65/mmbtu; AECO $3.27/mcf. Canadian based companies represented, with >50,000 boe/d of 2021E production based on
Peters & Co.’s estimates.                                                                                                                                                                                                                                            21
VALUATION DISCOUNT

                                                E&P FORWARD CONSENSUS EV/DACF PREMIUM/DISCOUNT TO 3Y & 5Y HISTORICAL*
                            2.0x

                            1.0x

                            0.0x

                           -1.0x

                           -2.0x

                           -3.0x

                           -4.0x
                                        MEG           VET           ARX            CPG           POU           ERF            BTE           NVA           WCP            PEY           BIR           TOU            AAV
                                           Disc/Prem to 5Y Historical                        Disc/Prem to 3Y Historical                       Median 3Y Disc/Prem                         Median 5Y Disc/Prem

    VERMILION TRADES AT ONE OF THE LARGEST DISCOUNTS TO ITS HISTORICAL VALUATION MULTIPLE
*Source: National Bank research estimates as of September 29, 2021 (VET share price = $12.72). Canadian based E&P companies represented, with >50,000 boe/d of 2021E production based on National Bank estimates.
                                                                                                                                                                                                                          22
BALANCE SHEET

                23
BALANCE SHEET COMPOSITION

                                  CURRENT CREDIT CAPACITY $2.5B                                                 ►      No near-term maturities
                                           AS AT SEPTEMBER 30, 2021
                 $2,250                                                                                                   o      Covenant-based credit facility termed out to May 2024
                 $2,000                                                                                                   o      US$ Senior Notes termed out to March 2025
                 $1,750
                 $1,500
                                                                                                                ►      Vermilion’s US$ Senior Notes have no financial covenants
                                                                                                                       and have been assigned the following credit ratings**
                 $1,250
           $MM

                 $1,000
                                                                                                                          o      Moody’s: B3
                  $750                                                                                                    o      S&P: B+
                  $500                                                                                                    o      Fitch: BB-
                  $250
                     $0
                                                                                                                 4-Year Covenant-based Credit Facility                                Covenant                   YE 2020 Q3 2021
                                                                                                                          Financial Covenants
                                2021            2022           2023            2024            2025
                            Undrawn Capacity on Revolving Credit Facility ($716MM)                               Total debt / Consolidated EBITDA**                                Less than 4.0                  3.48     2.20
                            Revolving Credit Facility Balance ($1,384MM)                                         Senior debt / Consolidated EBITDA**                               Less than 3.5                  2.82     1.72
                            Senior Unsecured Notes (US$300MM)                                                    Interest Coverage Ratio**                                        Greater than 2.5                8.12    11.00

    AMPLE LIQUIDITY WITH $716MM AVAILABLE ON OUR REVOLVING CREDIT FACILITY
* The terms of the indenture limit the ability to, among other things: make certain payments/distributions, incur additional indebtedness or perform certain corporate restructurings. ** Values as defined in
the credit agreement.                                                                                                                                                                                                              24
DEBT REDUCTION

                                                                                  NET DEBT AND NET DEBT TO TRAILING FFO RATIO
                               $2,500                                                                                                                                                                                                                         5.0x
                                                                                                                                                                                                                   Corrib acquisition provides
                                                                                                                                                                                                                    11% leverage reduction
                                                                                                                                                                                                                     versus VET base plan
                               $2,000                                                                                                                                                                                                                         4.0x

                               $1,500                                                                                                                                                                                                                         3.0x
                         $MM

                               $1,000                                                                                                                                                                                                                         2.0x

                                  $500                                                                                                                                                                                                                        1.0x

                                     $0                                                                                                                                                                                                                       0.0x
                                                   Q2 2020                    Q3 2020                    Q4 2020                   Q1 2021                    Q2 2021                   Q3 2021                 Q4 2021E**                    2022E**

                                           Revolving Credit Facility Balance*                            Senior Unsecured Notes (US$300MM)                                   Net Debt to Trailing FFO****                       Pro Forma Corrib Acq.

  WE ARE FINANCIALLY DISCIPLINED WITH A FOCUS ON LONG-TERM DEBT REDUCTION
*Net of adjusted working capital and unrealized foreign exchange on swapped USD borrowing. Adjusted working capital is defined as current assets (excluding current derivatives), less current liabilities (excluding current derivatives and current lease
liabilities). ** 2021 strip pricing as at November 26, 2021: Brent US$70.62/bbl; WTI US$67.71/bbl; LSB = WTI less US$3.92/bbl; TTF $18.92/mmbtu; NBP $18.40/mmbtu; AECO $3.57/mmbtu; CAD/USD 1.25; CAD/EUR 1.48 and CAD/AUD 0.94. 2022
strip pricing as at November 26, 2021: Brent US$68.92/bbl; WTI US$65.58/bbl; LSB = WTI less US$4.93/bbl; TTF $22.88/mmbtu; NBP $23.62; AECO $4.16/mmbtu; CAD/USD 1.28; CAD/EUR 1.45 and CAD/AUD 0.91. ****Reflects period-end Net Debt
                                                                                                                                                                                                                                                                     25
FINANCIAL LEVERAGE

                                                                                                                         LEVERAGE RATIOS
                           4.5x
                           4.0x
                           3.5x
                           3.0x
                           2.5x
                           2.0x
                                      VERMILION TARGETED LEVERAGE RANGE
                           1.5x
                           1.0x
                           0.5x
                           0.0x

                                                                                                                                                                                               2016

                                                                                                                                                                                                                                                2020
                                   2003

                                               2004

                                                           2005

                                                                       2006

                                                                                   2007

                                                                                               2008

                                                                                                           2009

                                                                                                                       2010

                                                                                                                                   2011

                                                                                                                                               2012

                                                                                                                                                           2013

                                                                                                                                                                       2014

                                                                                                                                                                                   2015

                                                                                                                                                                                                           2017

                                                                                                                                                                                                                       2018

                                                                                                                                                                                                                                    2019

                                                                                                                                                                                                                                                                     2022E**
                                                                                                                                                                                                                                                            2021E*
                                                                                              NET DEBT TO FFO**                                                                NET DEBT TO EBITDA***

  FOCUSED ON REDUCING LEVERAGE TO OUR TARGETED RANGE
* Based on company estimates and November 26, 2021 strip pricing. 2021 strip pricing as at November 26, 2021: Brent US$70.62/bbl; WTI US$67.71/bbl; LSB = WTI less US$3.92/bbl; TTF $18.92/mmbtu; NBP $18.40/mmbtu; AECO $3.57/mmbtu; CAD/USD 1.25; CAD/EUR 1.48
and CAD/AUD 0.94. ** 2022 strip pricing as at November 26, 2021: Brent US$68.92/bbl; WTI US$65.58/bbl; LSB = WTI less US$4.93/bbl; TTF $22.88/mmbtu; NBP $23.62; AECO $4.16/mmbtu; CAD/USD 1.28; CAD/EUR 1.45 and CAD/AUD 0.91. Includes existing hedges. FCF
presented as FFO less E&D Capital. *** Reflects period-end Net Debt. **** EBITDA as defined in the credit agreement.
                                                                                                                                                                                                                                                                               26
COMMODITY HEDGE POSITION

                                                                              2022                                                                                                                    2023
                                               100%                                                                                                                    100%
        PERCENTAGE OF PRODUCTION HEDGED (%)*

                                                                                                                                PERCENTAGE OF PRODUCTION HEDGED (%)*
                                               90%                                                                                                                     90%
                                               80%                                                                                                                     80%
                                               70%                                                                                                                     70%
                                               60%                                                                                                                     60%
                                               50%                                                                                                                     50%
                                               40%                                                                                                                     40%
                                               30%                                                                                                                     30%
                                               20%                                                                                                                     20%
                                               10%                                                                                                                     10%
                                                0%                                                                                                                      0%
                                                        Crude Oil         European            N.A.            Corporate                                                         Crude Oil         European            N.A.            Corporate
                                                                         Natural Gas       Natural Gas          Total                                                                            Natural Gas       Natural Gas          Total
                                                       WTI (C$/bbl) Brent (C$/bbl) Euro Gas (C$/mmbtu)** N.A. Gas (C$/mmbtu)                                                   WTI (C$/bbl) Brent (C$/bbl) Euro Gas (C$/mmbtu)** N.A. Gas (C$/mmbtu)
      Avg. Ceiling                                      $100.97        $104.75            $17.01                $4.72          Avg. Ceiling                                        N/A           N/A              $14.89                 N/A
      Avg. Floor                                         $77.63        $80.54             $16.30                $2.83          Avg. Floor                                          N/A           N/A              $14.57                 N/A
                                                      WTI    BRENT     NATURAL GAS       PRO FORMA CORRIB ACQ.                                                                WTI    BRENT     NATURAL GAS       PRO FORMA CORRIB ACQ.

 VISIT VERMILIONENERGY.COM/INVEST-WITH-US/HEDGING.CFM FOR MORE DETAILED HEDGING INFORMATION
*Company estimates as at December 7, 2021. Hedge percentages based on contract volumes as a percentage of net of royalty production and excludes Basis swaps on North American natural gas. ** European Natural Gas
Hedge prices represent a pro forma blended average including the Corrib Acquisition hedges put in place by Equinor on our behalf.
                                                                                                                                                                                                                                                       27
SUMMARY

►   Compelling investment with growing free cash flow, accelerated deleveraging and return of capital, currently
    trading at one of the lowest valuations compared to our peers

►   Unique portfolio of internationally diversified assets that provide exposure to premium global commodity prices
    which results in top decile netbacks and enhances free cash flow to support a sustainable dividend

►   Financially disciplined with a focus on balance sheet strength and returning capital to shareholders, including
    plans to reinstate a quarterly dividend in Q1 2022

►   Value driven acquisition strategy focused on maximizing value per share, as evidenced by Corrib Acquisition which
    further increases our premium European gas exposure and free cash flow while deleveraging the balance sheet

►   Industry leader in sustainability and ESG performance as evidenced by our high rankings from various ESG
    agencies and our recently established near-term and long-term emissions reduction targets

                                                                                                                        28
ASSET OVERVIEW

                 29
VERMILION PRODUCTION HISTORY

                         105,000

                          90,000

                          75,000

                          60,000
                 BOE/D

                          45,000

                          30,000

                          15,000

                                  0
                                              2010               2011               2012              2013               2014               2015               2016               2017               2018               2019               2020             2021E*      2022E**
                  E&D CAPEX
                                               119%             103%                81%                81%                85%               94%                 47%                53%                62%                58%                73%                39%       28%
                  AS % OF FFO
                                                                                               North America                                International                           Pro Forma Corrib Acq.

     LOW REINVESTMENT RATIO DRIVES STRONG FREE CASH FLOW
* 2021 FFO estimate based on November 26, 2021 strip pricing and company estimates. 2021 strip pricing as at November 26, 2021: Brent US$70.62/bbl; WTI US$67.71/bbl; LSB = WTI less US$3.92/bbl; TTF $18.92/mmbtu; NBP $18.40/mmbtu; AECO $3.57/mmbtu; CAD/USD 1.25;
CAD/EUR 1.48 and CAD/AUD 0.94. ** Based on company estimates, the 2022 annualized impact of the Corrib Acquisition and commodity strip prices at November 26, 2021 including the impact of hedges 2022 strip pricing as at November 26, 2021: Brent US$68.92/bbl; WTI
US$65.58/bbl; LSB = WTI less US$4.93/bbl; TTF $22.88/mmbtu; NBP $23.62; AECO $4.16/mmbtu; CAD/USD 1.28; CAD/EUR 1.45 and CAD/AUD 0.91. Refer to the “FFO Sensitivity” slide in the Supplemental Information section of this presentation for more details on pricing
assumptions. Estimates include existing hedges.
                                                                                                                                                                                                                                                                                  30
EUROPE

                                            NETHERLANDS                                               GERMANY
IRELAND                                     ► #2 onshore gas producer                                 ► Established production operations
► 20% operated interest in the Corrib       ► Large and growing inventory of drilling opportunities      and substantial exploratory land
    Natural Gas Project                                                                                  position in the North German Basin
► 56.5% operated interest upon closing of
    partner acquisition, expected 2H 2022
► Corrib field constitutes ~100% of                                                                    CENTRAL & EASTERN EUROPE
    Ireland’s domestic gas production                                                                  ► Approximately 2.0 million acres of
                                                                                                          undeveloped land in the Pannonian
                                                                                                          basin across three countries (Croatia,
FRANCE                                                                                                    Hungary and Slovakia)
► #1 domestic oil producer with ¾                                                                      ► Focused on under-invested basins
   share of the domestic industry                                                                         prospective for both oil and gas that
► Extensive inventory of workovers,                                                                       can benefit from new technology
   recompletions, waterfloods and
   infill drilling

                                                                                                                                                   31
CEE EXPLORATION POTENTIAL

            VERMILION HAS BUILT A HIGHLY PROSPECTIVE EXPLORATION PORTFOLIO ACROSS CEE
            ►        Approximately 2.0 million net acres of undeveloped land in the Pannonian basin across three countries
            ►        Focused on under-invested basins prospective for both oil and gas that can benefit from new technology

            CROATIA
            ►        975,000 net acres across two licenses prospective for natural gas and light oil
            ►        Drilled two successful gas wells in 2019 on the SA-10 block which tested at 15 mmcf/d and 17 mmcf/d, respectively*
                      o      First production from SA-10 block planned for early 2023
                      o      292 km2 of modern 3D seismic data in the SA-10 block has been acquired over acreage surrounding the two discoveries
            ►        365 km2 of modern 3D seismic in the SA-07 block is being acquired over the under explored acreage between and
                     adjacent to three highly prolific oilfields which have produced in excess of 193MM bbls to date
            HUNGARY
            ►        950,000 net acres with four licenses prospective for shallow natural gas and light oil
            ►        Two wells that have produced over 1.0 bcf to date
            ►        Multiple oil prospects being evaluated which lie along a proven and producing oil play fairway in the adjacent concession
            SLOVAKIA
            ►        50,000 net acres on a license highly prospective for natural gas
            ►        Trnava Licence – a series of unproduced gas discoveries made during the 1950’s planned to be developed using
                     Vermilion’s newly acquired proprietary 3D seismic data set.
                       o    Several un-drilled fault-blocks imaged by 3D will also be tested.

    FOCUSED ON ESTABLISHING LOW-COST POSITIONS IN THE UNDER-EXPLOITED PANNONIAN BASIN
* Ceric-01 well (100% working interest) tested at a final flow rate of 15.0 mmcf/d at a stabilized flowing wellhead pressure of 851 psi on a 0.86 inch diameter choke during a one hour flow period following perforating. An additional 18 hour flow test was later conducted at reduced rates to
limit flaring. During this test, the well flowed at a rate of 6.2 mmcf/d at a stabilized flowing pressure of 1,376 psi on a 0.37 inch choke. No formation water was produced during the tests. The well encountered 32 feet of net pay in two Upper Miocene Pannonian sandstones from 3,346-
3,353 and 3,828-3,861 feet. Only the lower zone was tested. Berak-01 well (100% working interest) tested at a rate of 17.2 mmcf/d during a four-hour flow period with a stabilized flowing wellhead pressure of 908 psi on a 0.875 inch diameter choke. A final shut in wellhead pressure of
1,186 psi was recorded following the flow test. The flow test continued an additional 12 hours at reduced choke sizes to minimize flaring. No formation water was produced during the test. The well logged 21 feet of net gas pay with an average porosity of 32% from the Upper Miocene
Pannonian sandstone occurring within a gross measured depth interval of 3,006-3,033 feet. Test results are not necessarily indicative of long-term performance or ultimate recovery.
                                                                                                                                                                                                                                                                                                     32
AUSTRALIA

    ►   100% operated interest in Wandoo, an offshore oil field
        approximately 80 km N.W. of Australia (55m water depth)

    ►   Horizontal well development with 20 producing wellbores and
        five dual lateral sidetracks tied into two platforms

    ►   Two well-program planned for Q2 2022

    ►   Contracted Wandoo crude oil sales receive a premium to
        Dated Brent index

STABLE ASSET DELIVERING PREMIUM TO BRENT PRICING AND STRONG FREE CASH FLOW

                                                                             33
NORTH AMERICA

  CANADA
  ►   Targeting light oil and condensate-rich natural gas in West Central Alberta and light
      oil in SE Saskatchewan
  ►   Approximately 400,000 net acres in West Pembina targeting the Mannville (2,400 –
      2,700m depth) and Cardium (1,800m) formations with shared surface infrastructure
  ►   Approximately 500,000 net acres of land in southeast Saskatchewan with
      development potential in stacked high-return targets

  UNITED STATES
  ►   Targeting light oil opportunities in the Powder River Basin in northeastern Wyoming
  ►   Over 150,000 net acres (90% operated WI) in the Powder River Basin targeting
      Turner Sand development in the Hilight (2,600m) and East Finn (1,500m) assets
  ►   Approximately 15,000 net acres prospective for Niobrara and Parkman

SIGNIFICANTLY ADVANTAGED PLAYS WITH A TRACK RECORD OF DEVELOPING MULTIZONE HORIZONS

                                                                                              34
APPENDIX

           35
FFO SENSITIVITY

               COMMODITY PRICES**                                               2021E                2022E                                    2022 ANNUAL FFO SENSITIVITY (C$MM)*
                                                                                                                                               (Excludes Impact of Corrib Acquisition)
               Brent (US$/bbl)                                                  $70.62                $68.92                                                              FFO Impact (C$)                FFO Impact (C$)
                                                                                                                                                        Change
               WTI (US$/bbl)                                                    $67.71                $65.58                                                                 Hedged                        Unhedged
               LSB = WTI less (US$/bbl)                                          $3.92                 $4.93
               MSW = WTI less (US$/bbl)                                          $3.81                 $4.45                    WTI & Brent             US$1/bbl               $16.0MM                      $16.2MM

                                                                                                                                 LSB / WTI
               TTF ($/mmbtu)                                                    $18.92                $22.88                                            US$1/bbl               $6.0MM                        $6.0MM
                                                                                                                                 Differential
               NBP ($/mmbtu)                                                    $18.40                $23.62
               AECO ($/mmbtu)                                                    $3.57                 $4.16                     TTF & NBP           $1.00/mmbtu               $10.9MM                      $22.1MM
               Henry Hub (US$/mmbtu)                                             $3.84                 $4.61
                                                                                                                               NA Gas Prices $0.25/mmbtu                       $12.3MM                      $12.8MM
               CAD/USD                                                              1.25                 1.28
               CAD/EUR                                                              1.48                 1.45                     CAD/USD                 $0.01                   N/A                       $12.3MM
               CAD/AUD                                                              0.94                 0.91
               EUR/GBP                                                              1.15                 1.17                     CAD/EUR                 $0.01                   N/A                        $5.5MM

    OUR INTERNATIONALLY DIVERSIFIED PORTFOLIO PROVIDES LEVERAGE TO GLOBAL COMMODITY PRICES
* Annual FFO sensitivity based on current 2022 production guidance, excluding the Corrib Acquisition. ** Commodity price assumptions listed have been reflected throughout this presentation using the
November 26, 2021 strip, unless otherwise noted.                                                                                                                                                                           36
ENVIRONMENTAL SUSTAINABILITY

           ►     We are playing a meaningful role in the energy transition by reducing
                 the environmental impact of our traditional energy production and
                 developing renewable energy projects
                    o      We have near-term and long-term emission reduction targets
                    o      We deploy energy and emissions efficiency improvement projects
                           throughout our operations
                    o      In France, oil operations provide geothermal heat to industrial-scaled
                           agriculture and eco-friendly housing projects with strong social impact

           ►     Vermilion has been consistently recognized for outstanding
                 sustainability performance by independent ESG agencies
           ►     Our strategy is aligned with the UN’s Global Goals for Sustainable
                 Development (SDGs)
           ►     We believe sustainability-oriented investors, governments and citizens
                 will have their greatest positive impact by turning to Best-In-Class
                 operators like Vermilion during the energy transition
    VERMILION IS AN INDUSTRY LEADER IN SUSTAINABILITY AND ESG PERFORMANCE
View our newly updated 2021 Sustainability Report online at http://sustainability.vermilionenergy.com   37
EMISSIONS REDUCTION TARGETS

                ►                  In April 2021, Vermilion introduced near-term and long-term emission reduction targets
                                    o     Aspirational target of net zero emissions in our operations, including Scope 1 and Scope 2 emissions, by 2050
                                    o     Reducing Scope 1 emissions intensity from our operations by 15 to 20% by 2025 (baseline 2019)
                                    o     Commitment to set new targets every five years, including analyzing potential for Scope 3 reductions

                ►                  Our emissions reduction targets are supported by our track record
                                                      EMISSION INTENSITY                                                                                  METHANE INTENSITY
                                                    Scope 1&2 tCO2e per BOE                                                                                 tCO2e per BOE
                                  0.035                                                                                                 0.012
                                                                                                                                        0.010

                                                                                                                        tCO2e per BOE
                  tCO2e per BOE

                                  0.030
                                                                                                                                        0.008
                                  0.025                                                                                                 0.006
                                                                                                                                        0.004
                                  0.020
                                                                                                                                        0.002
                                  0.015                                                                                                 0.000
                                           2014    2015       2016          2017        2018*           2019   2020**                           2014   2015   2016   2017     2018   2019   2020

    OUR 2025 INTENSITY REDUCTION TARGET IS THE FIRST STEP ON OUR PATHWAY TO NET ZERO BY 2050
* Increases in intensity in 2018 were due to the significant corporate acquisition of Spartan Energy.
** Vermilion’s total Scope 1&2 emissions were 1,040,347 tCO2e in 2020 based on operational control.                                                                                                38
SUSTAINABILITY PROJECTS

   ►   Vermilion is committed to advancing environmental sustainability, economic inclusivity and creating partnerships
       within the communities in which we live and work
                      PARENTIS SUSTAINABILITY PARTNERSHIP                            LA TESTE ECO-NEIGHBOURHOOD
                      ►   Our recycled geothermal energy tomato greenhouse           ►    Our operations in La Teste, France provides 1MW of
                          project in Parentis, France provides 8 MW of                    renewable energy to an eco-neighborhood, using
                          renewable energy                                                recycled geothermal energy from our oil operations
                      ►   Prevents the emission of 10,000 tonnes of CO2/year         ►    30-year partnership to provides 80% of the energy
                      ►   Produces 7,500 tonnes of tomatoes per year has                  required for 550 homes
                          created 250 direct agricultural jobs in a region in need   ►    Prevents the emission of 500 tonnes of CO2/year and
                          of investment                                                   reduces energy bills by 50%

                     VIC BILH ENERGY TRANSITION                                      BIODIVERSITY IN IRELAND
                     ►    In Q2 2021 we established a third geothermal               ►   Our biodiversity action plan in Ireland exemplifies how
                          application from our produced water in France                  we manage our activities with a focus on protecting
                                                                                         the habitats and species around us
                     ►    Our Vic Bilh facility will provide geothermal heat to a
                                                                                     ►   We are committed to maintaining an increase of
                          nearby Fleur de Vie facility that produces high quality
                          spirulina, a microalgae with a wide variety of uses            species diversity in maturing habitats and exploring
                                                                                         opportunities for further enhancement measures
                     ►    The facility is expected to be completed in autumn 2021
                                                                                     ►   Increases societal awareness of the ecological values
                                                                                         of the landscape, its habitats and species

ENHANCING SUSTAINTBILITY THROUGH INNOVATION AND PARTNERSHIPS
                                                                                                                                                   39
ADVISORY

This presentation is for information purposes only and is not intended to, and should not be construed to constitute, an offer to sell or the solicitation of an offer to buy, securities of Vermilion. This presentation and its contents should not
be construed, under any circumstances, as investment, tax or legal advice. Any person viewing this presentation acknowledges the need to conduct their own thorough investigation into Vermilion and its activities before considering any
investment in its securities.
Certain statements included or incorporated by reference in this presentation may constitute "forward-looking statements" or "forward-looking information" within the meaning of applicable Canadian and United States securities laws
(collectively, "forward-looking statements"). Forward-looking statements are typically identified by words such as "anticipate", "continue", "estimate", "expect", "forecast", “focus”, "may", "will", "project", "could", "plan", "intend", "should",
"believe", "outlook", "potential", "target", "seek", "budget", "predict", "might" and similar words suggesting future events or future performance. All statements other than statements of historical fact may be forward-looking statements.
Forward-looking statements in this presentation may include, but are not limited to, matters relating to: business strategies, plans and objectives (including over the near, medium and longer-term); forecast (or estimated) fund flows from
operations (FFO) and free cash flow (FCF), FCF yield, production mix and FFO contribution; commodity pricing and FFO sensitivity; dividends; share buybacks; and hedging. In addition, statements relating to "reserves" or "resources"
are deemed to be forward-looking statements as they involve the implied assessment, based on certain estimates and assumptions, that the reserves and resources described exist in the quantities predicted or estimated and can be
profitably produced in the future.
Forward-looking statements are based on Vermilion’s current expectations and assumptions and are subject to a number of risks and uncertainties that could materially affect future results. In addition to assumptions identified in this
presentation, assumptions have also been made regarding: availability of equipment, services and supplies; marketing of crude oil, natural gas liquids and natural gas; timely receipt of required regulatory approvals; foreign currency
exchange rates and interest rates; and timing and results of development activities. Risks include, but are not limited to, general economic risks and uncertainties, future commodity prices, exchange rates, interest rates, geological risk,
political risk, regulatory approval risk, production demand, transportation restrictions, risks associated with COVID-19, changes in tax, royalty and regulatory regimes and risks associated with international activities. Additional risks and
uncertainties are described in Vermilion’s Annual Information Form, as well as Vermilion’s Management’s Discussion and Analysis (“MD&A”) which are filed on SEDAR at www.sedar.com and on the SEC’s EDGAR system at
www.sec.gov. Due to the risks, uncertainties and assumptions inherent in forward-looking statements, prospective investors in the Company's securities should not place undue reliance on these forward-looking statements. Forward
looking statements are made as of the date hereof and Vermilion undertakes no obligation to update publicly or revise any forward looking statements, whether as a result of new information, future events, or otherwise, unless required
by applicable securities laws.
All references are to Canadian dollars unless otherwise specified.
This presentation contains certain non-standardized financial measures including net debt and fund flows from operations as well as non-GAAP measures including netbacks that are not determined in accordance with International
Financial Reporting Standards (“IFRS”) as issued by the International Accounting Standards Board. These measures as presented do not have any standardized meaning prescribed by IFRS and therefore may not be comparable with
calculations of similar measures by other companies. Reference is made to Vermilion's publicly filed documents, including our most recently filed MD&A, for a discussion of these measures, including a reconciliation of fund flows from
operations to cash flow from operating activities and net debt to long-term debt. Management believes that, in conjunction with results presented in accordance with IFRS, these measures assist in providing a more complete
understanding of certain aspects of Vermilion’s results of operations and financial performance. Investors are cautioned, however, that these measures should not be construed as an alternative to measures determined in accordance
with IFRS as an indication of our performance.
Certain natural gas volumes have been converted on the basis of six thousand cubic feet of gas to one barrel equivalent of oil. Barrels of oil equivalent (boe’s) may be misleading, particularly if used in isolation. A boe conversion ratio of
six thousand cubic feet to one barrel of oil is based on an energy equivalency conversion method primarily applicable at the burner tip and does not represent a value equivalency at the wellhead.
For more detail, including the forecast price and cost assumptions used by GLJ in preparing their evaluation reports, the chance of development, the chance of discovery, and other country specific contingencies, please refer to
Vermilion’s Annual Information Form for the year ended December 31, 2020 available under the Company profile at www.sedar.com.

                                                                                                                                                                                                                                                         40
You can also read