CORPORATE UPDATE SEPTEMBER 2021 TSX: PNE - A DYNAMIC CASH FLOW BUSINESS - Pine Cliff Energy Ltd.

Page created by Hector Lowe
 
CONTINUE READING
CORPORATE UPDATE SEPTEMBER 2021 TSX: PNE - A DYNAMIC CASH FLOW BUSINESS - Pine Cliff Energy Ltd.
A DYNAMIC CASH FLOW BUSINESS

           CORPORATE UPDATE
                   SEPTEMBER 2021
                          TSX: PNE
CORPORATE UPDATE SEPTEMBER 2021 TSX: PNE - A DYNAMIC CASH FLOW BUSINESS - Pine Cliff Energy Ltd.
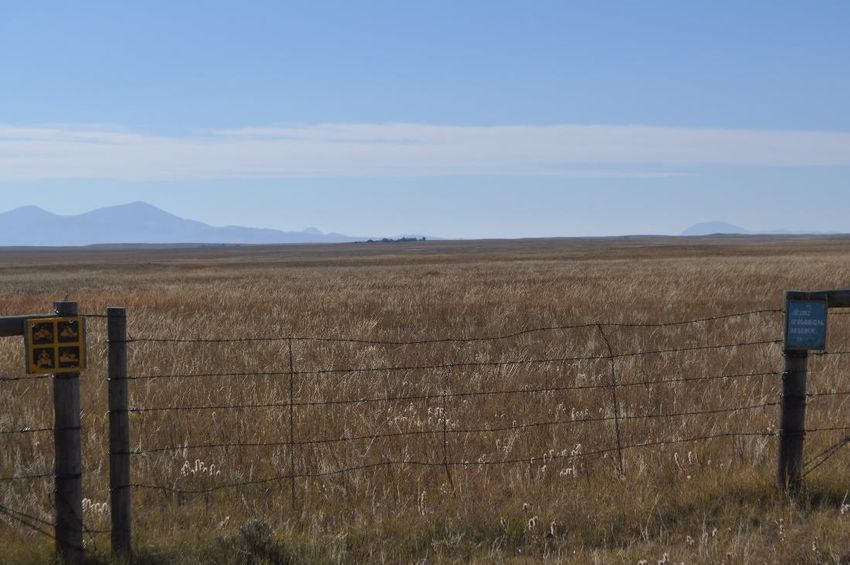
THREE REASONS TO BUY PINE CLIFF ENERGY STOCK

                             The natural gas market is experiencing a significant
         1                   transformation due to increasing demand which is driving
                             prices higher.

         2                   Pine Cliff Energy has tremendous exposure to the
                             increase in Canadian natural gas prices.

                             With one of the lowest production decline rates in the
         3                   industry, Pine Cliff generates a free cash flow yield of
                             approximately 30%(1).

       (1) Based on 2022 future strip pricing of US$63.25 WTI and $3.24/GJ AECO, PNE market capitalization as of
       August 9, 2021, and assuming an estimated $15 million of CAPEX spend to maintain production at 18,200 Boe/d.

                                                                                                                      1
CORPORATE UPDATE SEPTEMBER 2021 TSX: PNE - A DYNAMIC CASH FLOW BUSINESS - Pine Cliff Energy Ltd.
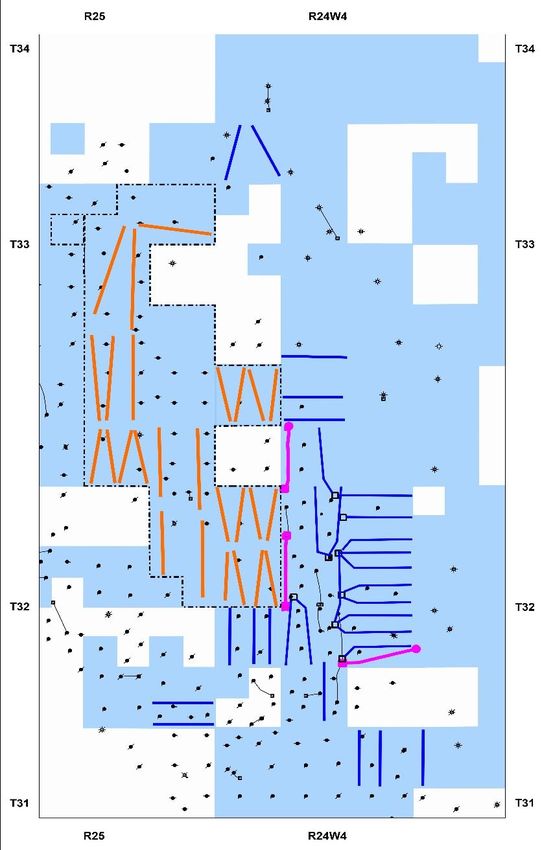
STRONG NATURAL GAS FUNDAMENTALS

North American Rig Count Continues to     • North American 2015-2019 Average Rig Count: 1,038.
  Lag Historical Averages (2020 was       • August 6, 2021 North American Rig Count: 647 (38% below 2015-2019 Average).
         lowest in 80 years)

                                          • Canadian (AECO) natural gas pricing compared to US pricing has narrowed from
  Reconnection of Canadian and US           prior years.
        Natural Gas Pricing               • Canadian exports of natural gas to the US has risen to over 6.5 Bcfd in 2021.

                                          • Capital market focus on debt repayment, return of capital and growth within free
Growth Capital Budgets Slashed Across       cash flow.
         the Entire Industry
                                          • Backwardation of forward energy curve (prices) continue to limit increased drilling.

   USA Natural Gas Production Has         • US gas production has dropped from a high of 96 Bcfd in Q4 2019 to
              Dropped                       approximately 92 Bcfd in August 2021.

                                          • Natural gas, since 2016, is the primary energy source in North America for power
 Natural Gas Demand Continues to Be         demand.
            Strong in 2021                • In both 2020 and 2021, the US had record natural gas power demand months.

LNG Exports have Rebounded in the US
                                          • US LNG export capacity is over 11 Bcf/d and was at record highs in 2021.
 and are Expected to Start in Canada in
                                          • US Pipeline exports to Mexico reached record highs of over 7 Bcf/d in 2021.
                 2025

                                                                                                                                   2
CORPORATE UPDATE SEPTEMBER 2021 TSX: PNE - A DYNAMIC CASH FLOW BUSINESS - Pine Cliff Energy Ltd.
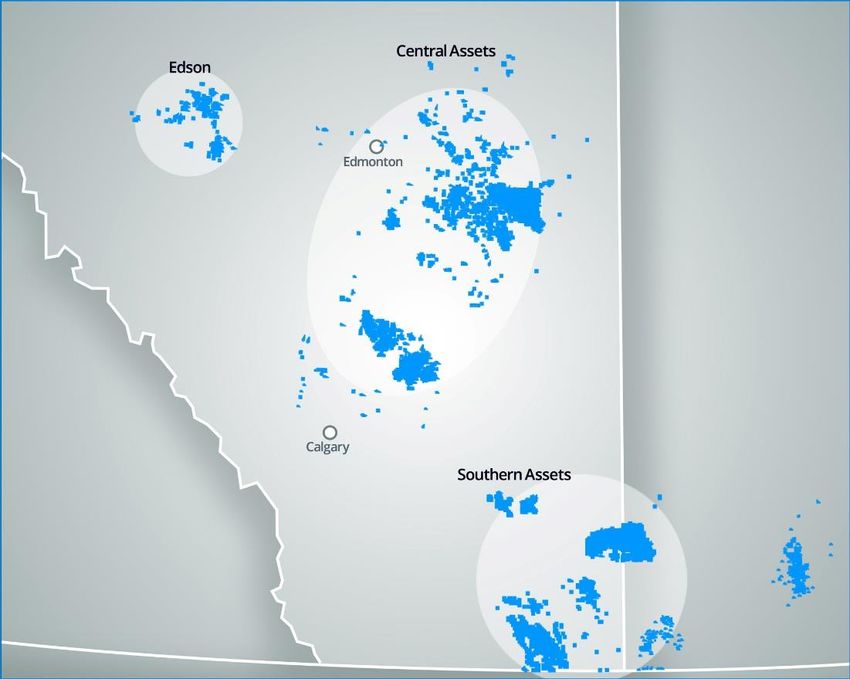
NATURAL GAS OUTLOOK – NORTH AMERICAN DEMAND

                   US Total Natural Gas Demand                                                         U.S. Electricity Demand

Despite                                                                                                                                            The
COVID-19, US                                                                                                                                       composition of
demand for                                                                                                                                         US Electricity
natural gas has                                                                                                                                    production has
continued to                                                                                                                                       shifted with
set all-time                                                                                                                                       natural gas
highs in 2021.                                                                                                                                     growing to
                                                                                                                                                   40% of the
                                                                                                                                                   total electricity
                                                                                                                                                   produced in
                                                                                                                                                   2020
                                                                                                  Source: EIA, Monthly Energy Review (July 2021)

                    Source: S&P Global Platts and ARC Energy Institute (August, 2021)

            U.S. Natural Gas Exports (excluding Canada)                                 North American Natural Gas Demand Growth Outlook

Combined U.S.                                                                                                                                      Growth in LNG
gas exports                                                                                                                                        exports and
have averaged                                                                                                                                      electric power
over 17 Bcf/d                                                                                                                                      generation is
in 2021 with                                                                                                                                       predicted to
further growth                                                                                                                                     drive natural
expected with                                                                                                                                      gas demand
an increase in                                                                                                                                     growth in
Mexico                                                                                                                                             North America
infrastructure.                                                                                                                                    for many
                                                                                                                                                   years.

                              Source: ARC Energy Institute (August, 2021)               Source: TransCanada August 2019 London Energy Conference
                                                                                                                                                             3
CORPORATE UPDATE SEPTEMBER 2021 TSX: PNE - A DYNAMIC CASH FLOW BUSINESS - Pine Cliff Energy Ltd.
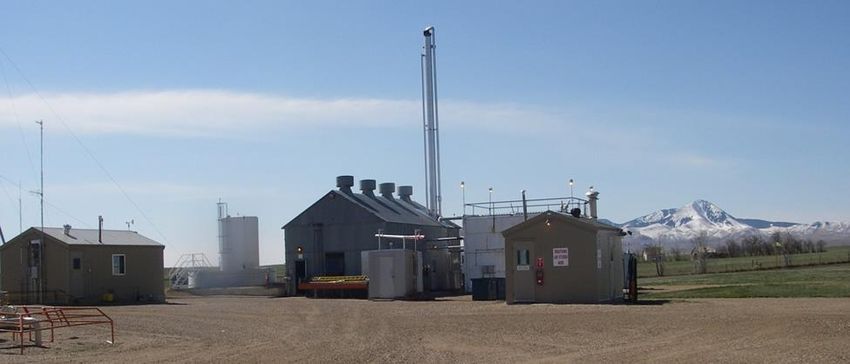
NATURAL GAS OUTLOOK – NORTH AMERICAN SUPPLY

                  Western Canada Natural Gas Supply                                                    North American Natural Gas Rig Count

2021 Western                                                                                                                                            Active drilling
Canadian gas                                                                                                                                            rigs in North
supply is on                                                                                                                                            America have
trend for a                                                                                                                                             remained
third straight                                                                                                                                          near historical
year of                                                                                                                                                 5-year lows.
declining
production
after six years
of growth.

                          Source: Peters & Co. Limited Natural Gas Bulletin (June, 2021)   Source: Baker Hughes Co. and Canaccord Genuity (June 2021)

                          U.S. Natural Gas Supply                                                        U.S. Shale Gas Production by Basin
                  Bcf/d

After two                                                                                                                                               U.S. gas
years of supply                                                                                                                                         production
growth of 9                                                                                                                                             peaked in
and 8.4 Bcfd,                                                                                                                                           2019, and has
US gas supply                                                                                                                                           fluctuated in
dropped in                                                                                                                                              2021 with a
2020 due to                                                                                                                                             flattening
reduced                                                                                                                                                 trend.
drilling.

                                           Source: EIA (March, 2021)                                         Source: EIA (July 2021)
                                                                                                                                                                  4
CORPORATE UPDATE SEPTEMBER 2021 TSX: PNE - A DYNAMIC CASH FLOW BUSINESS - Pine Cliff Energy Ltd.
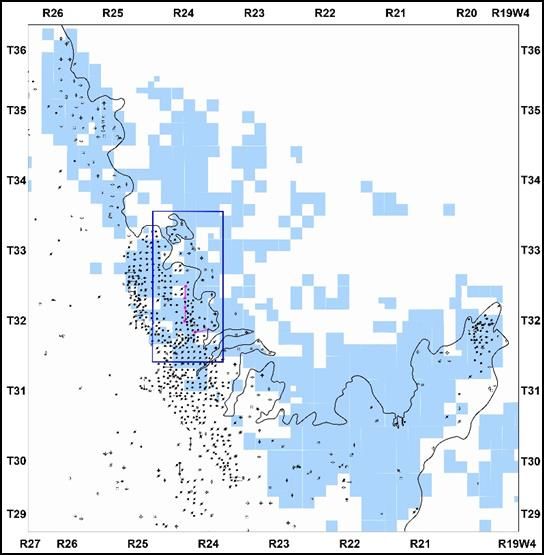
NATURAL GAS OUTLOOK – STORAGE IS THE SCORECARD

            Canadian Natural Gas Storage                                                       US Natural Gas Storage

                     Source: TD Securities (August, 2021)
                                                                                               Source: TD Securities (August 2021)

            European Natural Gas Storage                                       European Natural Gas Storage Year Over Year Comparison

    Source: Desjardins Capital Markets, Gas Infrastructure Europe, Bloomberg                  Source: Celsius Energy (July 2021)

               Natural Gas Storage Is Below Five Year Average Storage
                        Levels in Canada, the US and Europe.
                                                                                                                                     5
CORPORATE UPDATE SEPTEMBER 2021 TSX: PNE - A DYNAMIC CASH FLOW BUSINESS - Pine Cliff Energy Ltd.
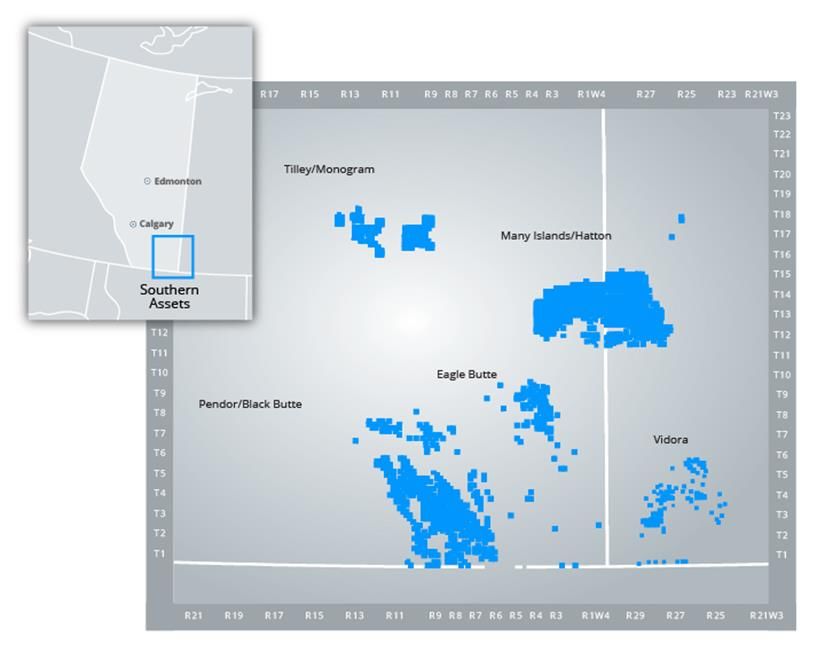
2022 CASH FLOW TORQUE TO NATURAL GAS PRICING

                                      2022 Cash Flow Torque to AECO1

                                                                                                                            (1)
   Note: Strip pricing as of July 7, 2021: C$3.03/Mcf AECO; US$67.49/bbl WTI; Cash flow sensitivities based on pre-hedging netbacks
   (1) Haywood Securities Inc., PNE cash flow based on a production rate of 18,500 boe/d for 2022 (August, 2021)

         PNE’s cash flow has one the highest torques to natural gas
                          pricing in the industry.
                                                                                                                                      6
CORPORATE UPDATE SEPTEMBER 2021 TSX: PNE - A DYNAMIC CASH FLOW BUSINESS - Pine Cliff Energy Ltd.
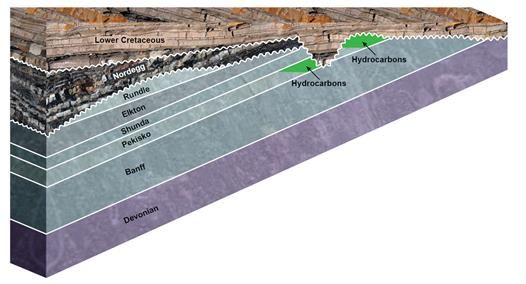
ONE OF   THE     HIGHEST CASH FLOW SENSITIVITIES                            TO       NATURAL GAS

         Natural Gas Producers (>$100 MM Mkt Cap)
         2022E DAFCF Yield Sensitivity                                       2022E Cash Flow Torque

                                                    Source: Desjardins Capital Markets (August 2021) excludes sensitivities to financial
                                                    and physical natural gas hedges

                                                                                           2022 DAFCF Yield to EV

                                                                               Source: Canaccord Genuity Group Inc. (August 2021)

                                                                                                                                           7
CORPORATE UPDATE SEPTEMBER 2021 TSX: PNE - A DYNAMIC CASH FLOW BUSINESS - Pine Cliff Energy Ltd.
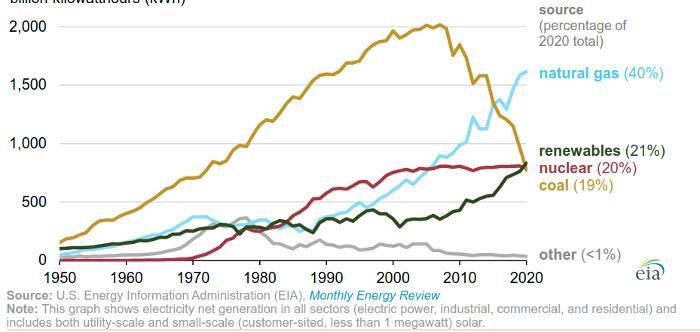
DEMONSTRATED ABILITY TO GENERATE FUNDS FLOW

                                                                                                                                                                              $15,026
                                                                                                                                                                                                                                                                                                                                                             $6.00                     $2.50

                                  $15,000

                                                                                                    $11,615

                                                                                                                                                                                        $11,233
                                                                                                                                                                                                  $10,834
                                                                                                                                                                                                                                                                                                                                                             $5.00
                                                                        $10,089

                                                                                                                                                                                                                                                                                                                                                                                       $2.00

                                                                                                                                                                                                                                                                                                                                          $10,000
                                  $12,000

                                                                                                                                                                                                                                                                                                                                                    $9,494
    Adjusted Funds Flow ($000s)

                                                                                  $9,180
                                                                                           $8,104

                                                                                                                                                                                                                                                                                                                                 $7,996
                                                                                                                                $7,507
                                                                                                                                                                                                                                                                                                                                                             $4.00

                                                                                                                                                                                                                                                                 $6,823
                                   $9,000

                                                                                                                                         $6,550

                                                                                                                                                                                                                                                                                                                                                                                                   PNE STOCK PRICE
                                                                                                              $6,182

                                                                                                                                                                                                                                                                                                                                                                     AECO 5A ($/Mcf)
                                                                                                                                                                                                                                                                                                                                                                                       $1.50
                                                               $5,564

                                                                                                                       $5,555

                                                                                                                                                                                                                              $5,137

                                                                                                                                                                                                                                                                                              $5,025
                                                                                                                                                                                                                                                        $4,433
                                   $6,000
                                             $3,721

                                                                                                                                                                                                                     $3,759
                                                                                                                                                                     $6,972
                                                                                                                                                                                                                                                                                                                                                             $3.00

                                                                                                                                                                                                            $2,879
                                                      $3,014

                                                                                                                                                                                                                                               $1,920
                                                                                                                                                  $1,398

                                                                                                                                                                                                                                                                                                                                                                                       $1.00

                                                                                                                                                                                                                                                                                                       $1,153
                                   $3,000

                                                                                                                                                                                                                                                                                                                          $809
                                                                                                                                                                                                                                                                                                                                                             $2.00

                                       $0
                                                                                                                                                                                                                                                                                                                                                                                       $0.50

                                                                                                                                                                                                                                       -$977

                                                                                                                                                                                                                                                                                                                -$1,229
                                                                                                                                                                                                                                                                                                                                                             $1.00

                                                                                                                                                                                                                                                                          -$2,047
                                  ($3,000)
                                                                                                                                                           -$3,655

                                                                                                                                                                                                                                                                                    -$3,922
                                  ($6,000)                                                                                                                                                                                                                                                                                                                   $0.00
                                                                                                                                                                                                                                                                                                                                                                                       $0.00

                                        PNE generated positive adjusted funds flow in 32 of the past 37 quarters and
                                         has a stock price that has been historically correlated with AECO pricing.
Sources- PNE Share price of $0.59 as of end of day September 10, 2021, forward curve average of $4.59/mcf from GLJ Petroleum Consultants as of September 13, 2021                                                                                                                                                                                                                              8
CORPORATE UPDATE SEPTEMBER 2021 TSX: PNE - A DYNAMIC CASH FLOW BUSINESS - Pine Cliff Energy Ltd.
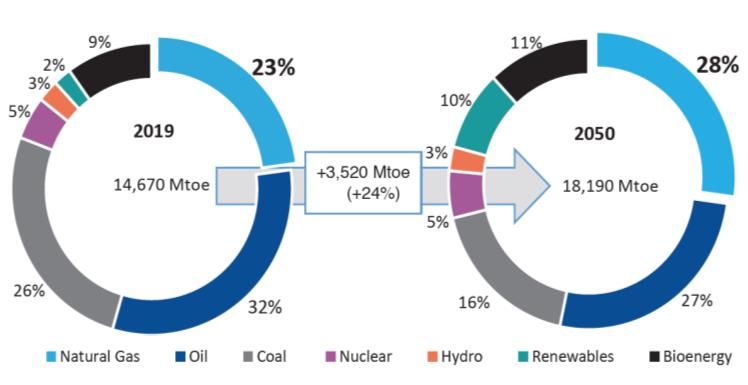
2022 ADJUSTED FUNDS FLOW PROJECTIONS

AECO (CDN)(1)                                 $/Mcf                $             3.00    $           3.50       $          4.00     $           4.50     $           5.00

Realized Gas Price                            $/Mcf                $             3.17    $           3.62       $          4.07     $           4.53     $           4.99

Realized Price(2)(3)                          $/Mcfe               $             3.64 $              4.05       $          4.45     $           4.87     $           5.29

Royalties(4)                                  $/Mcfe               $            (0.43) $            (0.43)      $         (0.43) $             (0.43) $              (0.43)

Operating Expenses(4)                         $/Mcfe               $            (1.70) $             (1.70)     $          (1.70) $            (1.70) $              (1.70)

Transportation(4)                             $/Mcfe               $            (0.20) $            (0.20)      $         (0.20) $             (0.20) $              (0.20)

G&A and Interest(4)                           $/Mcfe               $            (0.28) $            (0.28)      $         (0.28) $             (0.28) $              (0.28)

Corporate Netback(5)                          $/Mcfe               $             1.03    $           1.44       $          1.85     $           2.26     $           2.68

Adjusted Funds Flow(6)                        $ MM                 $              41     $            57        $          74       $            90      $            107

Shares Outstanding(7)                         MM Shares                          337                 337                   337                  337                   337

Per Basic Share                               $/Share              $            0.12     $          0.17        $         0.22      $          0.27      $           0.32

  (1)   AECO 5A reference price
  (2)   Using 2022 estimated production of 18,200 Boe/d
  (3)   Internal premium estimates related to delivery points and US$65/Bbl WTI, 1.26 US$/C$ foreign exchange and estimated Edmonton light differential of C$5.00/Bbl
  (4)   2022 internal cost estimates
  (5)   Corporate netback is a non-GAAP measure and represents commodity sales, less royalties, operating expenses, transportation, G&A and interest expense,
        calculated per Mcfe. For a reconciliation of non-GAAP measures, see PNE’s YE MD&A for the year December 31, 2020
  (6)   Adjusted funds flow is a non-GAAP measure that represents the total of cash provided from operating activities, before adjusting for changes in non-cash working
        capital, and decommissioning obligations settled
  (7)   Number of common shares outstanding as of August 4, 2021

   Every $0.10 change in Pine Cliff’s realized gas price equates to
          approximately $3.6 million of annual funds flow.
                                                                                                                                                                              9
WHAT         WE       HAVE BUILT

THREE MAJOR OPERATED CORE AREAS

• 2021 Production Guidance of 18,000 – 18,500
  Boe/d.
     • Weighted 91% towards natural gas.

• High Working Interest and Operatorship.
     • Production and infrastructure is 85% operated.
     • 80% average working interest on land.

• Extensive Land and Seismic Position.
     • 2.4 MM gross acres (1.9 MM net acres) and ownership
       and access to over 2,000 kms of 2D and 3D seismic.

• Significant Undrilled or Recompletion Locations.
     • 139 gross (83.1 net) undeveloped locations including
       38 gross (19.8 net) booked locations.

• Strategic Operated Infrastructure.
     • Includes 100% ownership of three Canadian Energy
       Regulator (“CER”) regulated export pipelines to
       Montana and Saskatchewan providing natural gas
       market pricing diversity.

                                                              10
ONE OF THE LOWEST BASE PRODUCTION DECLINES

                       Base Decline
                                •   Pine Cliff’s asset base has one of the lowest base declines of any Western Canada producer.
                                •   This provides PNE the ability to maintain production or grow with minimal capital.
                                •   The average junior Canadian oil and gas producer has a production decline rate of 26%.
                                           PNE Production
                       25,000                                                                       Corporate Decline Rate (%)

                       20,000
Production (boe/day)

                       15,000

                       10,000

                        5,000

                           0

                                                                                                 Source: Haywood Securities. (August 2021)

                                     'Base Production'    'Uplift Production'
                                     '2019 Acquisition'

                                    6.7% Annualized Base Production Decline since January, 2018.

                                                                                                                                             11
A COUNTER-CYCLICAL STRATEGY

BUILDING A FREE CASH FLOW MODEL IN A VOLATILE COMMODITY PRICE ENVIRONMENT

• PNE has been uniquely focused on a low-risk, low decline, primarily natural gas asset
  consolidation strategy in Western Canada with nine acquisitions since 2012 (See
  Appendix for list of acquisitions).
• PNE has opportunistically exploited its own land base and continues to make strategic
  acquisitions to increase upside in hydrocarbon potential.
• PNE has one of the lowest decline rates in the entire oil and gas sector with a decline
  rate of approximately 7% on base production.

• PNE has one of the highest cash flow sensitivities to rising Canadian (AECO) natural
  gas prices.

• PNE has generated positive adjusted funds flow in 32 of the past 37 quarters.

        PNE provides shareholders with exposure to natural gas
      prices while delivering adjusted funds flow to generate long-
                         term shareholder value.

                                                                                            12
CORPORATE PROFILE

A UNIQUE SUSTAINABLE CASH FLOW MODEL
                                                         • 2021 Production Guidance                    18,000 – 18,500 Boe/d
• Listing                               TSX: PNE
                                                         •      - % natural gas                        91%
• Market Capitalization(1)(3)           $198.9 MM        • 2021 Capital Guidance                       $13.0 MM
• Average Daily Volume(2)               0.467 MM         • Corporate Base Production                   ~7%
                                                           Decline
• 52-Week Trading Range(2)              $0.16 to $0.59
                                                         • Cash(4)                                     $22.5 MM
• Shares Issued(3)                      337.2 MM
                                                         • Long-term Debt(5)                           $61.0 MM
• Directors and Officers Ownership(3)
  - Basic                               10.08%           • Reserves (1P/2P)(6)                         42.9/54.8 MMBoe
  - Fully Diluted                       12.87%
                                                         • Tax Pools(4)                                ~$376 MM

                                                                           (1) ReflectsSeptember 10, 2021 closing price of $0.59 per share.
                                                                           (2) Average daily trading volumes and 52-week trading range for
                                                                           September 10, 2020 to September 10, 2021.
                                                                           (3) As of September 10, 2021. In addition, there were 27.3 MM stock

                                                                           options issued (8.1% of outstanding shares).
                                                                           (4) As of June 30, 2021.
                                                                           (5) As of June 30, 2021: $12 MM of insider subordinated debt that

                                                                           matures on December 31, 2024 and bears interest at 6.5% annually,
                                                                           $19 MM to AIMCo that matures on July 31, 2022 and bears interest
                                                                           at 7.05% annually ($12 MM of which was repaid on July 28, 2021)
                                                                           and $30 MM to AIMCo that matures on December 31, 2024, and
                                                                           bears interest at 9.75% until September 30, 2021 and thereafter
                                                                           increases by 1% annually up to 12.75%.
                                                                           (6) Based on an independent reserve report prepared by McDaniel &

                                                                           Associates Consultants Limited dated February 10, 2021 (“2020
                                                                           Reserve Report”).

                                                                                                                                     13
A STRONG BALANCE SHEET AND SHAREHOLDER BASE

                                                            % of PNE
Shareholder and Relationship           Shares Held                           Date and Source
                                                           Outstanding
Robert Disbrow (Reporting Insider                                           September 13, 2021 –
                                         39,890,500            11.83%
and Long Term Debt Holder)                                                         SEDI

Alberta Investment Management
                                                                              October 7, 2020 –
Company – AIMCo (Long Term Debt          36,056,954            10.69%
                                                                                  SEDAR
Holder)

George Fink (PNE Chairman of the                                            September 13, 2021 –
                                         25,275,029            7.50%
Board and Long Term Debt Holder)                                                   SEDI

Philip B. Hodge (PNE President, CEO                                         September 13, 2021 –
                                         7,435,293             2.21%
and Director)                                                                      SEDI

      ALL debt at September 13 2021, is term debt and held by three of Pine Cliff’s largest
      shareholders (AIMCo, George Fink and Robert Disbrow) with the balance of the first
      tranche of $7MM not due until July 2022 and the remaining $42MM not due until
      December 31, 2024).

                                                                                              14
WHY INVEST IN PINE CLIFF

• Long life predictable natural gas assets with an industry leading decline rate creates
  stable, predictable funds flow.
• One of the strongest per share sensitivities among Canadian energy companies to natural
  gas price improvements.
• Demonstrated ability to generate positive funds flow despite volatile natural gas prices.
• Executing on a long-term vision to assemble an asset base to deliver sustainable cash to
  create shareholder value.
• Significant management and board stock ownership creates strong alignment with
  shareholder interests.
• Proven ability to exploit opportunities with recent Pekisko drilling success.
• Increasing oil and gas drilling inventory on a land position of approximately two million
  gross acres.

                                                                                              15
ANALYST COVERAGE

                                              Company                                                                    Analyst

                 Canaccord Genuity                                                               Anthony Petrucci

                 Desjardins Capital Markets                                                      Chris MacCulloch

                 Haywood Securities Inc.                                                         Christopher Jones

                 Paradigm Capital                                                                Adam Gill

                 Peters & Co.                                                                    Dan Grager

                 Stifel FirstEnergy                                                              Cody Kwong

 By posting this list, Pine Cliff does not imply endorsement of or agreement with the information, conclusions or recommendations provided in the reports. Pine Cliff does not
 generally distribute electronic copies of analyst reports.
                                                                                                                                                                                 16
APPENDIX

           17
EXPERIENCED BOARD AND MANAGEMENT

BOARD OF DIRECTORS

        George F. Fink (Chairman of the Board)
            Mr. Fink is the Chairman of the Board of Pine Cliff Energy Ltd. (“Pine Cliff” , “PNE”, or the “Company”) and is also
            the Chief Executive Officer and Chairman of the Board of Bonterra Energy Corp. Mr. Fink sits on the Board of
            Directors of the Explorers and Producers Association of Canada (“EPAC”) and has formerly served on the Board of
            Governors of the Canadian Association of Petroleum Producers (“CAPP”). Mr. Fink's career spans 40 years,
            primarily in the oil and gas industry. After articling with Ernst & Young and obtaining the Chartered Accountant
            designation, Mr. Fink worked for Shaw Pipe Industries, Ranger Oil and Comstate Resources before starting
            Bonterra Corporation (a spinoff from Comstate).

        Philip B. Hodge
            Mr. Hodge joined Pine Cliff in January 2012 as President, Chief Executive Officer and Director and its first
            employee. Mr. Hodge also sits on the Board of Directors of EPAC. Prior to Pine Cliff, Mr. Hodge held the position
            of Vice President, Business Development at Penn West Exploration, at the time, one of the largest conventional oil
            and natural gas producers in North America. Prior to that, Mr. Hodge was a Managing Director at Mackie Research
            Capital Corporation and J.F. Mackie & Co., Calgary based investment banks, Vice President, General Counsel and
            Director of Westport Innovations Inc., President of Westport’s China Division and a partner at Bennett Jones LLP, a
            Canadian national law firm, practicing in that firm's securities and mergers and acquisitions teams in its Calgary
            office.

        Robert B. Fryk
            Mr. Fryk joined the Board of Director of Pine Cliff in May, 2021 and is Chair of its Reserves Committee. He
            previously held the position of President and Chief Executive Officer of Gain Energy Ltd. from February 2017 until
            March 2021. Prior to that, he was Chief Operating Officer at Gain and Executive Vice-President and Chief
            Operating Officer at Velvet Energy Ltd. from 2011 to 2015. Mr. Fryk has over 37 years of experience in
            management, business development and operations, including oil and gas reservoir exploitation, drilling,
            completions, marketing and asset and corporate economic evaluations for acquisitions and divestments. Mr. Fryk
            has a Bachelor of Science – Chemical Engineering Degree from the University of Calgary and is a member of the
            Association of Petroleum Engineers and Geoscientists of Alberta.
                                                                                                                            18
EXPERIENCED BOARD AND MANAGEMENT – CONT.

             Jacqueline R. Ricci
                  Ms. Ricci joined the Board of Directors of Pine Cliff in May, 2020 and is Chair of its Audit Committee. Ms.
                  Ricci has been a Vice President and Director at J. Zechner Associates, Toronto, Ontario, since 1997,
                  where she is responsible for stock selection and portfolio mix in J. Zechner's Canadian Small/Mid-
                  Capitalization Portfolios. In this position, Ms. Ricci has significant experience evaluating business plans
                  and management performance in small and mid-capitalization companies in the Canadian market.

             William S. Rice, Q.C.
                  Mr. Rice joined the Board of Directors of Pine Cliff in May, 2016 and is the Chair of its Governance,
                  Nomination and Compensation Committee. Mr. Rice was Chair and Chief Executive Officer of the Alberta
                  Securities Commission from 2005 to 2015 and Chair of the Canadian Securities Administrators from 2011
                  to 2015. From 2000 to 2005, Mr. Rice was National Managing Partner of the Bennett Jones LLP law firm.
                  Prior to taking his position with the Alberta Securities Commission, Mr. Rice served as a chair or member
                  of a number of corporate boards of directors.

MANAGEMENT
       .

Philip B. Hodge - President & CEO
Terry L. McNeill – Chief Operating Officer – Mr. McNeill joined Pine Cliff as Vice President Operations in April 2014 and was
appointed Chief Operating Officer in January 2015. Mr. McNeill has over 28 years of industry experience and has held similar
positions at both public and private companies.
Alan MacDonald – Chief Financial Officer - Mr. MacDonald is a Chartered Accountant with over 38 years of experience in
the oil and gas industry and was Vice President and Chief Financial Officer at United Hydrocarbon International Corp., APF
Energy Trust, Rockyview Energy Inc. and Cumberland Oil & Gas Ltd.
Christopher Lee - VP Exploration - Mr. Lee joined Pine Cliff in 2012 and has over 20 years of experience working in the oil
and gas industry with NuVista Energy, Bonavista Energy and Storm Energy.

                                                                                                                          19
PNE HISTORICAL EV/DACF MULTIPLES

Source: Canaccord Genuity Group Inc. (August 2021)

               PNE has traded at an average EV/DACF multiple of eight for the past eight
            years, and is currently trading at one of its lowest historical EV/DACF multiples.
                                                                                                 20
NATURAL GAS OUTLOOK – GLOBAL SUPPLY AND DEMAND

                      Global Natural Gas Demand                                 Global LNG Demand
                   Mboe/D

Natural   gas
2021 Western                                                                                              Demand for
consumption
Canadian gas                                                                                              LNG continues
continues
supply is onto                                                                                            to climb,
increase
trend forina                                                                                              specifically in
practically
third straight                                                                                            Asia, with over
every
year ofregion of                                                                                          43 countries
the  world, but
declining                                                                                                 now importing
is accelerating
production                                                                                                LNG, from only
the
afterfastest in
       six years                                                                                          23 ten years
non-OECD
of growth.                                                                                                ago.
countries.

                                Source: GECF (February, 2021)   Source: Shell LNG Outlook (March, 2021)

Global Consumption of Primary Energy Sources (2019 to 2050E)         Emerging LNG Supply-Demand Gap

Natural gas is                                                                                            Forecasted
projected to                                                                                              demand for
grow 24%                                                                                                  LNG is creating
globally over                                                                                             a future
the next 30                                                                                               shortage of
years, with                                                                                               supply by
market share                                                                                              2030.
going from
23% to 28%.

                                Source: GECF (February, 2021)   Source: Shell LNG Outlook (March, 2021)
                                                                                                                   21
FOCUS ON PER SHARE VALUE

Predictable Funds Flow Model
 Low decline and low capital efficiencies form the
 foundation for a sustainable “funds flow” model.                      EXPERIENCED
                                                                       MANAGEMENT
Significant Insider Ownership                                             TEAM
 Interests aligned with shareholders to build per
 share value.

Access to Capital                                                                       LOWEST
 Eight financings completed since Nov. 2012, the                                      PRODUCTION
 most recent being the equity financing in May             STRATEGIC
                                                            BALANCE
                                                                       VALUE PER        DECLINE
                                                                                        AMONG
 2019.
                                                             SHEET       SHARE         CANADIAN
                                                                                         PUBLIC
Strategic Balance Sheet Focus                                                          COMPANIES
 Long-term debtholders that are significant equity
 holders with no debt due before July, 2022.

Disciplined Growth Track Record
 Decades of transaction execution experience has                       HIGH INSIDER
 guided the company through nine acquisitions and                      OWNERSHIP
 growth from 100 Boe/d to approximately 19,000
 Boe/d.
Growing Drilling Inventory
 Strategic acquisitions and 2019 drilling success is
 forming the base of a high return drilling inventory to
 replace production.
                                                                                               22
AN ACTIVE EIGHT YEARS OF ACQUISITIONS
TRANSACTION RECORD SINCE JANUARY 2012
                           $500,000,000
                                                                      Market Cap                            11
                           $450,000,000                               Share Price                      10                                                                                                                                  $2.50

                                                                                                 9               12
                           $400,000,000

                                                                                                                        13            14                                                                                                   $2.00
                           $350,000,000

                           $300,000,000
                                                                                    8
                                                                  4             7                                                                                          15                                                              $1.50
                           $250,000,000                                        6
                                                                           5
                                                             3
                           $200,000,000         1
                                                      2                                                                                                                                                                                    $1.00
                                                                                                                                                                                       16
                           $150,000,000                                                                                                                                                           17
                                                                                                                                                                                                                  18
                           $100,000,000
                                                                                                                                                                                                                                           $0.50

                             $50,000,000

                                          $-                                                                                                                                                                                               $-

1. Dec 21/11 - Phil Hodge appointed President and CEO, George Fink appointed Chairman and announced $2.9MM rights offering and 11. Sept 2/14 – announced $60.1MM equity offering at $2.05/sh
private placement
                                                                                                                               12. April 20/15 – announced $14.1MM acquisition of additional assets in Edson
2. Feb 10/12 – announced $23.5MM Carrot Creek/Edson acquisition
                                                                                                                               13. Nov 9/15 – announced $185MM acquisition of new core area in Central AB and $72MM common share offering at $1.08/sh
3. Aug 23/12- announced acquisition of Geomark Exploration Ltd.
                                                                                                                               14. Aug 10/16 – issued $30MM promissory note and $11MM in promissory notes to insiders (July 29, 2016)
4. Nov 20/12 – announced purchase of debt and security of Scope Energy and $5.4MM private placement at $0.70/share
                                                                                                                               15. July 13/18 – issued $19MM promissory note and 2.85MM share purchase warrants at $0.51/sh to AIMCo expiring on July 13, 2021
5. May 27/13 – announced $34MM acquisition of additional 52% working interest in the Monogram Unit                             and $1MM increase in promissory notes to insiders

6. June 4/13 – announced $25MM common share offering at $0.88/share                                                            16. May 31/19– completed $8.6MM asset acquisition in Central AB, $4MM flow-through common shares at $0.276/sh and $1.4MM
                                                                                                                               common share offering at $0.23/sh
7. July 17/13 – announced $13.3MM acquisition of additional Southern Alberta assets and operatorship
                                                                                                                               17. Oct 1/19 –extended $30MM of AIMCo debt to December 31, 2024, issued 7.5MM share purchase warrants at $0.21/sh to AIMCo,
8. Oct 2/13 – announced $20.0MM common share offering at $1.10/sh                                                              and extended $12MM insider debt to December 31, 2024

9. July 17/14 – announced $100MM Southern Alberta/Saskatchewan asset acquisition                                               18. Sept 1/20 – AIMCo exercised its rights with share purchase warrants and purchased 7.5MM common shares

10. July 29/14 – announced $33.3MM Carrot Creek/Edson asset acquisition
                                                                                                                                                                                                                                                                 23
FLEXIBLE NATURAL GAS PRICE EXPOSURE

  UNIQUE INFRASTRUCTURE OPTIONALITY
  •   Sales volumes can be physically diverted to Saskatchewan and the United States by utilizing three
      PNE owned CER regulated pipelines.

  •   Preserves capability of PNE to optimize physical flows based on market pricing.

  •   Avoids longer term commitments that are required in pipeline open seasons.

  •   In 2021, up to 70% of PNE gas production can be exposed to AECO prices.

  •   Current netback analysis suggests AECO derived pricing net of transportation costs, provides the
      most optimal netback for Alberta production, while Saskatchewan production benefits from
      TransGas Energy Pool (“TEP”) pricing.

                                                                                                    24
NATURAL GAS REVIEW – HEDGING UPDATE

PHYSICAL PRICE HEDGING

                                                               Delivery Quantity (GJ/d)
Contractual Terms             Delivery   $/GJ    Q3-2021   Q4-2021          Q1-2022       Q2-2022
                              Point
Aug 1, 2021 – Oct 31, 2021    AECO       $2.44   26,600    8,867            -             -

Aug 1, 2021 – Oct 31, 2021    TransGas   $3.11   6,000     2,000            -             -

Aug 1, 2021 – Oct 31, 2021    Dawn       $3.24   5,000     1,667            -             -

Aug 1, 2021 – Sept 30, 2021   AECO       $3.38   2,500     -                -             -

Aug 1, 2021 – Dec 31, 2021    AECO       $3.54   1,667     2,500            -             -

Nov 1, 2021 – Dec 31, 2021    AECO       $4.00   -         3,333            -             -

Nov 1, 2021 – Mar 31, 2022    AECO       $3.25   -         1,667            2,500         -

Apr 1, 2022 – Oct 31, 2022    AECO       $2.78   -         -                -             2,500

                                                                                                    25
CENTRAL ASSETS AREA OVERVIEW

PINE CLIFF’S LARGEST CORE AREA
                                 •   Gas weighted, low decline assets in the Ghost Pine and
                                     Viking areas of Central Alberta.
                                 •   Extensive land position of 1.3 MM gross (0.95 MM net)
                                     acres.
                                 •   Q2 - 2021 production of 9,630 Boe/d (86% natural gas),
                                     53% of Pine Cliff’s production.
                                 •   PNE currently estimates approximately 85 gross (66.9
                                     net) Pekisko, Basal Quartz, and Sparky locations,
                                     including 67 gross (53.1 net) unbooked locations and 18
                                     gross (13.8 net) booked locations in the 2020 Reserve
                                     Report.
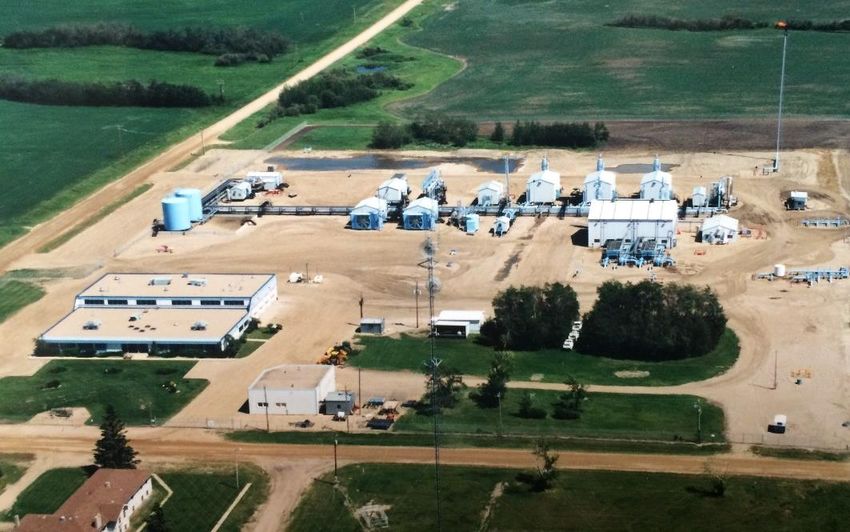
                                 •   Ownership in key strategic infrastructure, including five
                                     gas plants with midstream revenue.
                                 •   Significant drilling and recompletion inventory in the
                                     Horseshoe Canyon Coal Bed Methane.
                                 •   Oil and liquid rich natural gas recompletion and drilling
                                     opportunities with extensive seismic over the area.
                                 •   Pine Cliff has a 71% working interest in its Central
                                     Alberta assets and operates 96% of the production.

                                                                                         26
TWINING PEKISKO OIL

                                                                         •   Oil and gas are trapped in the reservoir close to the
                                                                             subcrop edge (pinch-out). The Pekisko oil pool in
                                                                             Twining, is estimated to have over one billion barrels of
                                                                             original oil in place and is the single largest Pekisko oil
                                                                             accumulation in The Western Canadian Sedimentary
                                                                             Basing (WCSB) to date.

                                                                         •   Vertical well development and extensive coring in the
                                                                             area has well defined the pool. 416 oil wells have been
                                                                             drilled in the pool, 33 of those are horizontal wells
                                                                             completed with acid stimulations.

                                                                         •   Despite the amount of development, only 4% of the oil
                                                                             in place has been recovered.

                                                                         •   PNE has a large land base of approximately 229,000
Pekisko subcrop with Pekisko wells and Twining play outline
                                                                             gross (195,216 net) acres in Ghost Pine with an
                                                                             extensive 3D and 2D seismic library.

                                                                         •   PNE is the first to employ multi-staged fracturing
                                                                             technology within the Twining pool to unlock the
                                                                             unrecovered oil.

Graphic representation of subcrop trap. Source Canadian Discovery Ltd.
                                                                                                                                     27
TWINING PEKISKO INVENTORY

                         •     Drilled three horizontal wells (One in 2018 and two in
                               2019).

                         •     PNE has an extensive 3D and 2D seismic library over the
                               play.

                         •     Estimated cost to drill, complete, equip and tie-in (DCET)
                               of $2.8 MM.

                         •     PNE has two operated multi-well oil batteries in the center
                               of each development area.

                         •     An extensive network of oil and gas gathering pipelines
                               and compression.

                                             Unbooked Locations    Booked Locations           Total
                        Area                 Gross       Net      Gross      Net      Gross           Net
                        Twining                 21       19.0       9         9.0      30             28.0
                        North Twining Unit     18        8.7        8         3.8      26             12.5
                        TOTAL                  39        27.7       17        12.8     56             40.5

                                                                                                             28
TWINING PEKISKO ECONOMICS

                            29
EDSON AREA OVERVIEW

HIGH IMPACT INVENTORY

                        •   Q2 - 2021 production of 1,299 Boe/d
                            (73% natural gas), 7% of Pine Cliff’s
                            production.
                        •   PNE currently estimates high quality
                            locations targeting the Bluesky, Ellerslie,
                            Rock Creek, Wilrich, and Ostracod areas
                            with approximately 51 gross (13.3 net)
                            locations including 31 gross (7.3 net)
                            unbooked locations and 20 gross (5.0 net)
                            booked locations in the 2020 Reserve
                            Report, High ownership in key pipelines
                            and facilities.
                        •   Source of midstream revenue.
                        •   51% working interest, production is 46%
                            operated.

                                                                    30
HIGH QUALITY EDSON AREA LOCATIONS

    MULTI ZONE, LIQUIDS RICH LOCATIONS

•    Attractive and predictable high liquids yield
     production.
•    55 gross (13.9 net) multi-zoned undrilled
     locations including 35 gross (8.7 net)
     unbooked locations and 16 gross (4.6 net)
     booked locations in the 2020 Reserve
     Report.
•    Pine Creek / McLeod (Ellerslie, Bluesky) -
     27 gross (6.0 net) undrilled locations
     including 21 gross (4.7 net) unbooked
     locations and 6 gross (1.3 net) booked
     locations in the 2020 Reserve Report.
•    Carrot Creek (Ellerslie, Ostracod and Rock
     Creek) - 21 gross (6.8 net) undrilled
     locations including 14 gross (4.0 net)
     unbooked locations and 7 gross (2.8 net)
     booked locations in the 2020 Reserve
     Report.
•    Large operated infrastructure.
•    Ability to align firm service transportation
     with production.

                                                     31
SOUTHERN ASSETS AREA OVERVIEW

 LOW DECLINE, LOW COST PRODUCTION

                                    •   Q2 - 2021 production of 7,166 Boe/d
                                        (99.9% natural gas), 40% of Pine Cliff’s
                                        production.
                                    •   100% ownership of three CER regulated
                                        pipelines delivering gas to Montana and
                                        Saskatchewan.
                                    •   Gas sales into Saskatchewan at TEP
                                        pricing.
                                    •   Multi-zone area with production from
                                        Cretaceous Milk River, Medicine Hat and
                                        Second White Specks.
                                    •   Extensive land position of over 1 MM
                                        gross acres (0.9 MM net acres) with
                                        recompletion and infill drilling upside.

                                                                             32
ASSET RETIREMENT OBLIGATIONS

                                                                                    Pine Cliff*            Province of Alberta**
•   85.7% of Pine Cliff’s wells are producing
    which is considerably higher than the latest
    Alberta average of 62.1%.                            Active Wells            8,122       85.7%           159,000           62.1%

•   So far in 2021 Pine Cliff has abandoned 220
    wells and expect to abandon an additional           Inactive Wells           1,353       14.3%            97,000           37.9%
    150 wells this year.                                 *    From Pine Cliff Energy’s 2020 AIF
                                                         **   https://www.alberta.ca/oil-and-gas-liabilities-management.aspx
•   Pine Cliff is actively working on reclamation of
    over 200 locations and expects to apply for
    over 50 reclamation certificates in 2021 and
    an additional 50 to 100 each year thereafter.      100.0%
                                                        90.0%
•   Over 55% of Pine Cliff wells are minimum            80.0%
    disturbance dry natural gas sites which have        70.0%
    significantly less abandonment and                  60.0%                 Pine Cliff
                                                        50.0%                Energy Ltd,
    reclamation cost than conventional sites.           40.0%                  85.7%                       Province of
                                                                                                          Alberta, 62.1%
                                                        30.0%
                                                        20.0%
                                                        10.0%
                                                         0.0%
                                                                     Pine Cliff Energy Ltd           Province of Alberta

                                                                                  Active Wells     Inactive Wells

                                                                                                                                       33
ACTIVELY MANAGING ENVIRONMENTAL FOOTPRINT

•     As at June 30, 2021, PNE recorded an asset retirement obligation (“ARO”) of $230.7 MM
      (inflated at 2.00% and discounted at 2.30%) on its balance sheet ($240.1 MM undiscounted,
      uninflated).
•     As of June 30, 2021, PNE’s discounted ARO at 15% was $46.1 MM.

                                           Combined Alberta and Saskatchewan Well Count
                                                                             Gross(1)     Net(1)
    Producing Wells                                                           7,993       6,059
    Standing Wells                                                            1,019       663
    Abandoned Wells without Reclamation Certificate                           1,100       856
    Total Wells                                                               10,112      7,578
    (1)   Well count as of June 30, 2021

                                                                                                   34
ACTIVELY MANAGING ENVIRONMENTAL FOOTPRINT

                            Pine Cliff’s Annual Well Abandonment and Reclamation Expenditures
                                                                   Gross                      Net
                                 2017                            $2.5 million             $2.4 million
                                 2018                            $3.0 million             $2.7 million
                                     2019                       $2.1 million               $1.9 million
                                    2020                        $1.7 million               $1.5 million
                                   Totals1                      $8.8 million               $8.5 million
    1. Includes data up to December 31, 2020

•    Pine Cliff understands and has respected our ongoing obligation to abandon and reclaim assets
     that are not expected to be productive again. Pine Cliff has spent over $8 million dollars over the
     past four years on abandonment and reclamation work and will continue to do so. With funding
     already allocated from the Alberta and Saskatchewan site rehabilitation programs, Pine Cliff will
     spend more on abandonment and reclamation in 2021 than it has ever spent in a single year.

                                                                                                           35
METHANE EMISSIONS REDUCTION PROGRAM

•   Pine Cliff Energy Ltd. is proud to have been an early action leader in reducing methane
    emissions from its operations. Starting in March 2018, Pine Cliff has worked with a third party to
    inventory all pneumatic devices and pumps, and replace all eligible high-bleed pneumatic
    controllers with newer low or no-bleed alternatives.

•   To date 451 high-bleed controllers have been replaced, retrofitted or removed in Pine Cliff’s
    operations.

•   Through this initiative, Pine Cliff has reduced its annual GHG emissions by 29,160 Tonnes CO2e,
    which is equivalent to taking 6,190 cars off the road on a permanent basis each year.

                                                                                                         36
RESERVE REPORT(1)

                Summary of Remaining Working Interest Reserves, as of December 31, 2020
                                                                                                                       Natural Gas and
                                                                            Light, Medium          Natural Gas
                                                                                                                          Coal Bed              Oil Equivalent
                                                                            and Heavy Oil            Liquids
                                                                                                                          Methane
                Reserve Category                                                MBbl                   MBbl                 MMcf                     MBoe
                Proved
                   Developed Producing                                                  848.6               2,763.8             220,889.7                 40,427.4
                   Developed Non-Producing                                               24.1                  48.1                2,394.8                    471.3
                   Undeveloped                                                          830.0                 242.4                5,567.7                  2,000.4
                Total Proved                                                          1,702.7               3,054.3             228,852.3                 42,899.0
                Probable                                                              1,129.8               1,422.6               56,331.3                11,941.0
                Total Proved plus Probable                                            2,832.5               4,476.9             285,183.6                 54,840.0

                                     By Classification                                                                    By Category
                                                                                                                               5%

                                                                                                                        8%

                                           22%
                                                                               PDP                                                                                    Natural Gas
                                        4%                                     PDN/PUD                                                                                NGLs
                                                                               Probable                                                                               Oil
                                                          74%
                                                                                                                                           87%

(1)   Based on an independent reserve report prepared by McDaniel & Associates Consultants Limited. Please read in conjunction with Pine Cliff’s press release on
      February 10, 2021, which can be found on www.sedar.com and is subject to the same cautionary statements as set out therein
                                                                                                                                                                              37
FUTURE DRILLING OPPORTUNITIES

  EXTENSIVE INVENTORY OF OIL AND GAS LOCATIONS TO SUPPLY LONG TERM MODEL

                                         Summary of Undrilled Locations
                                     Unbooked Locations         Booked Locations(1)            Total Locations
                                     Gross         Net          Gross          Net           Gross          Net
 Camrose Mannville Recomplete                 3           2.9            -               -            3            2.9
 Carrot Creek Ellerslie                      14           4.0           3              1.3           17            5.3
 Carrot Creek Ostracod                         -            -           1              0.4            1            0.4
 Carrot Creek Rock Creek                       -            -           3              1.1            3            1.1
 Ghost Pine Basal Quartz Gas                  4           3.4            -               -            4            3.4
 Ghost Pine Basal Quartz Oil                 10           8.4           1              1.0           11            9.4
 Ghost Pine Sparky Gas                        6           5.6            -               -            6            5.6
 Pine Creek Bluesky                            -            -           6              2.2            6            2.2
 Pine Creek/McLeod Ellerslie                 17           3.3           4              0.5           21            3.8
 Sundance Wilrich                              -            -           3              0.5            3            0.5
 Three Hills Pekisko Oil                      8           8.0            -               -            8            8.0
 Twining Pekisko Oil                         21          19.0           9              9.0           30           28.0
 Twining Unit Pekisko Oil                    18           8.7           8              3.8           26           12.5
  (1) Based on 2019 Reserve Report
 Total                                       101         63.2           38            19.8           139          83.1

                                                                                                                     38
CAUTIONARY STATEMENTS

Certain statements contained in this presentation include statements which contain words such as “anticipate”, “could”, “should”, “expect”, “seek”, “may”, “intend”, “likely”, “will”, “believe” and
similar expressions, statements relating to matters that are not historical facts, and such statements of our beliefs, intentions and expectations about development, results and events which
will or may occur in the future, constitute “forward-looking information” within the meaning of applicable Canadian securities legislation and are based on certain assumptions and analysis
made by us derived from our experience and perceptions. In particular, this presentation contains statements regarding: the potential growth opportunities and benefits on Pine Cliff Energy
Ltd.’s (“Pine Cliff” of the “Company”) assets; information regarding Pine Cliff on a pro forma basis; expected decline rates; the strategy of the Company and the ability of the Company to
execute on this strategy; expected cash/adjusted funds flow; future returns on share price; future capital expenditures, including the amount, timing and nature thereof; oil and natural gas
prices and demand; cash flow / adjusted funds flow leverage to natural gas prices; corporate netbacks and break even price and its ability to provide protection from volatile commodity
prices; expected operating expenses, processing and gathering income, transportation costs, royalty rates, general and administrative expenses and interest expenses; expected cash flow /
funds flow (defined herein as commodity revenues plus processing and gathering income less royalties, operating expenses, transportation, G&A and interest); expansion and other
development trends of the oil and gas industry; reserve and resource volumes; estimated ultimate recoveries (“EUR”); estimated capital per well; business strategy and outlook; expansion
and growth of the business and operations; maintenance of existing customer, supplier and partner relationships; future acquisition opportunities including the amount, timing, success and
nature thereof; the ability of the Company to raise capital; the ability of the Company to grow production, repay debt, repurchase shares; supply channels; accounting policies; credit risks;
availability and number of drilling or recompletion locations, including the timing and success thereof; expected internal rates of return (defined herein); expected IP365 (defined herein); the
potential growth opportunities on the assets; change in Pine Cliff’s LLR; timing of asset retirement obligations; the 2021 production guidance; the 2021 capital guidance, including the
allocation of the capital budget; the effects from the novel coronavirus (“COVID-19”) on global crude oil demand and pricing; the 2021 and 2022 adjusted funds flow projections; the 2022
cash flow torque; the 2021 cash flow sensitivity; the 2022 free cash flow yield; and other such matters. As such, many factors could cause the performance or achievement of Pine Cliff to be
materially different from any future results, performance or achievements that may be expressed or implied by such forward-looking statements. Because of the risks, uncertainties and
assumptions contained herein, readers should not place undue reliance on these forward-looking statements. All data, projections, sensitivities, graphs or any other information in this
presentation compiled by a third party has been credited to that third party and Pine Cliff does not take responsibility for the accuracy of such information.
In addition, statements relating to "reserves" are by their nature forward-looking information, as they involve the implied assessment, based on certain estimates and assumptions that the
reserves described can be profitably produced in the future. The recovery and reserves estimates provided herein are estimates only and there is no guarantee that the estimated reserves
will be recovered. Pine Cliff cautions that its future oil, natural gas and natural gas liquids production, revenues, adjusted funds flow, liquidity, plans for future operations, expenses, outlook
for oil and natural gas prices, timing and amount of future capital expenditures, and other forward-looking information is subject to all of the risks and uncertainties normally incident to the
exploration for and development and production and sale of oil and gas.
All such forward-looking information, including 2021 adjusted funds flow projections and 2022 free cash flow yield, is based on certain assumptions and analyses made by us in light of our
experience and perception of historical trends, current conditions and expected future developments, as well as other factors we believe are appropriate in the circumstances. The risks,
uncertainties, and assumptions are difficult to predict and may affect operations, and may include, without limitation: foreign exchange fluctuations; equipment and labour shortages and
inflationary costs; general economic conditions; industry conditions; changes in applicable environmental, taxation and other laws and regulations as well as how such laws and regulations
are interpreted and enforced; the ability of oil and natural gas companies to raise capital; the effect of weather conditions on operations and facilities; the existence of operating risks; volatility
of oil and natural gas prices; oil and gas product supply and demand; risks inherent in the ability to generate sufficient cash flow from operating activities to meet current and future
obligations; increased competition; stock market volatility; opportunities available to or pursued by us; and other factors, many of which are beyond our control. The foregoing factors are not
exhaustive.
Actual results, performance or achievements could differ materially from those expressed in, or implied by, this forward-looking information and, accordingly, no assurance can be given that
any of the events anticipated by the forward-looking information will transpire or occur, or if any of them do so, what benefits will be derived therefrom. Except as required by law, Pine Cliff
disclaims any intention or obligation to update or revise any forward-looking information, whether as a result of new information, future events or otherwise.
The forward-looking information contained herein is expressly qualified by this cautionary statement.
This presentation contains the term barrels of oil equivalent (“Boe”) which has been calculated on the basis of six thousand cubic feet equivalent (“Mcfe”) of gas to one barrel of oil. This
conversion ratio is based on energy equivalence primarily at the burner tip and does not represent a value equivalency at the wellhead. The term Boe may be misleading, particularly if used
in isolation.

                                                                                                                                                                                                39
CAUTIONARY STATEMENTS

This presentation contains a number of oil and gas metrics, including funds flow, maintenance capital, initial production rates (“IP”), capital efficiencies and internal rate of return (“IRR”)
which do not have standardized meanings or standard methods of calculation and many not be comparable to similar measures used by other companies. Such metrics have been included
herein to provide readers with additional measures to evaluate the Company. IRR is calculated by taking expected capital costs to drill, complete, equip and tie-in wells against future net
revenue and management estimates of operating costs, royalties, production rates and reserves. IP is the initial production rates for the first stated number of days of production of a well.
Capital efficiencies are calculated by dividing the IP production rates by the capital cost.

Undeveloped locations consist of drilling and recompletion locations booked in the independent reserve report dated February 10, 2021 prepared by McDaniel & Associates Consultants
Limited (the “2020 Reserve Report”) and unbooked drilling and recompletion locations. Booked locations are proposed proved and probable locations identified in the 2020 Reserve
Report. Unbooked drilling and recompletion locations are internal estimates based on an evaluation of geology, volumetrics and analogs evaluation of geologic, reserves and spacing
based on industry practice. Pine Cliff has identified 139 gross (83.1 net) undeveloped locations of which 38 gross (19.8 net) are booked drilling locations, and 101 gross (63.3 net) are
unbooked drilling and recompletion locations. The Pekisko oil locations consist of 64 gross (48.5 net) include 17 gross (12.8 net) booked probable locations and 47 gross (35.7 net)
unbooked locations. The Basal Quartz oil locations of 11 gross (9.4 net) include one gross (1.0 net) booked probable locations and 10 gross (8.4 net) unbooked locations.

There is no guarantee that Pine Cliff will drill any or all of the undrilled locations and there is no certainty that drilling these locations will result in additional reserves or production or achieve
expected rates of return. Pine Cliff’s drilling activity depends on availability of capital, regulatory approvals, commodity prices, drilling costs and other factors. As such, Pine Cliff’s actual
drilling activities may materially differ from those presently identified, which could adversely affect Pine Cliff’s business.

This presentation uses the terms “adjusted funds flow”, “operating netbacks”, “corporate netbacks” and “net debt” which are not recognized under IFRS and may not be comparable to
similar measures presented by other companies. The Company uses these measures to evaluate its performance, leverage and liquidity. Adjusted funds flow is a non-GAAP measure that
represents the total of cash provided from operating activities, before adjusting for changes in non-cash working capital, and decommissioning obligations settled. Net debt is a non-GAAP
measure calculated as the sum of term debt at the principal amount, promissory notes at the principal amount, amounts due to related party, and trade and other payables less trade and
other receivables, cash and prepaid expenses and deposits. Operating netback is a non-GAAP measure calculated as the Company’s total commodity revenue, plus processing and
gathering income, less royalty expenses, operating expenses, and transportation expenses, divided by the Boe or Mcfe production of the Company. Corporate netback is a non-GAAP
measure calculated as the Company’s operating netback, less general and administrative expenses, interest expense, divided by the Boe or Mcfe production of the Company.

                                                                                                                                                                                                     40
CORPORATE INFORMATION

BOARD OF DIRECTORS                                 HEAD OFFICE                       WEBSITE
George F. Fink (Chairman)                          850, 1015 – 4th Street SW         www.pinecliffenergy.com
Philip B. Hodge                                    Calgary, Alberta T2R 1J4
Robert B. Fryk                                     Phone: (403) 269-2289             INVESTOR CONTACT
Jacqueline R. Ricci                                Fax: (587) 393-1693               info@pinecliffenergy.com
William S. Rice
                                                   REGISTRAR AND TRANSFER AGENT
OFFICERS                                           Odyssey Trust Company of Canada
Philip B. Hodge
 President and Chief Executive Officer             AUDITORS
Terry L. McNeill                                   Deloitte LLP
 Chief Operating Officer
Alan MacDonald                                     STOCK EXCHANGE LISTING
 Chief Financial Officer and Corporate Secretary   TSX Exchange
Christopher S. Lee                                 Trading Symbol: PNE
 Vice President, Exploration

                                                                                                                41
You can also read