4D MRI: Robust sorting of free breathing MRI slices for use in interventional settings
←
→
Page content transcription
If your browser does not render page correctly, please read the page content below
4D MRI: Robust sorting of free breathing MRI slices for use
                                                    in interventional settings
                                                    Gino Gulamhussene1 , Fabian Joeres1Y , Marko Rak1Y , Maciej Pech2 , Christian
                                                    Hansen1,*

                                                    1 Faculty of Computer Science, Otto-von-Guericke University Magdeburg, Germany
                                                    2 Clinic for Radiology and Nuclear Medicine, University Hospital Magdeburg, Germany

                                                    Y These authors contributed equally to this work.
arXiv:1910.01902v2 [eess.IV] 6 Jul 2020

                                                    * hansen@isg.cs.uni-magdeburg.de

                                                    Abstract
                                                    Purpose
                                                    We aim to develop a robust 4D MRI method for large FOVs enabling the extraction of
                                                    irregular respiratory motion that is readily usable with all MRI machines and thus
                                                    applicable to support a wide range of interventional settings.

                                                    Method
                                                    We propose a 4D MRI reconstruction method to capture an arbitrary number of
                                                    breathing states. It uses template updates in navigator slices and search regions for fast
                                                    and robust vessel cross-section tracking. It captures FOVs of 255 mm x 320 mm x 228
                                                    mm at a spatial resolution of 1.82 mm x 1.82 mm x 4mm and temporal resolution of
                                                    200ms. A total of 37 4D MRIs of 13 healthy subjects were reconstructed to validate the
                                                    method. A quantitative evaluation of the reconstruction rate and speed of both the new
                                                    and baseline method was performed. Additionally, a study with ten radiologists was
                                                    conducted to assess the subjective reconstruction quality of both methods.

                                                    Results
                                                    Our results indicate improved mean reconstruction rates compared to the baseline
                                                    method (79.4% vs. 45.5%) and improved mean reconstruction times (24s vs. 73s) per
                                                    subject. Interventional radiologists perceive the reconstruction quality of our method as
                                                    higher compared to the baseline (262.5 points vs. 217.5 points, p=0.02).

                                                    Conclusions
                                                    Template updates are an effective and efficient way to increase 4D MRI reconstruction
                                                    rates and to achieve better reconstruction quality. Search regions reduce reconstruction
                                                    time. These improvements increase the applicability of 4D MRI as a base for seamless
                                                    support of interventional image guidance in percutaneous interventions.

                                                    Keywords
                                                    4D-MRI, image-guided interventions, self-gated, respiratory motion, retrospective
                                                    stacking

                                     July 7, 2020                                                                                        1/16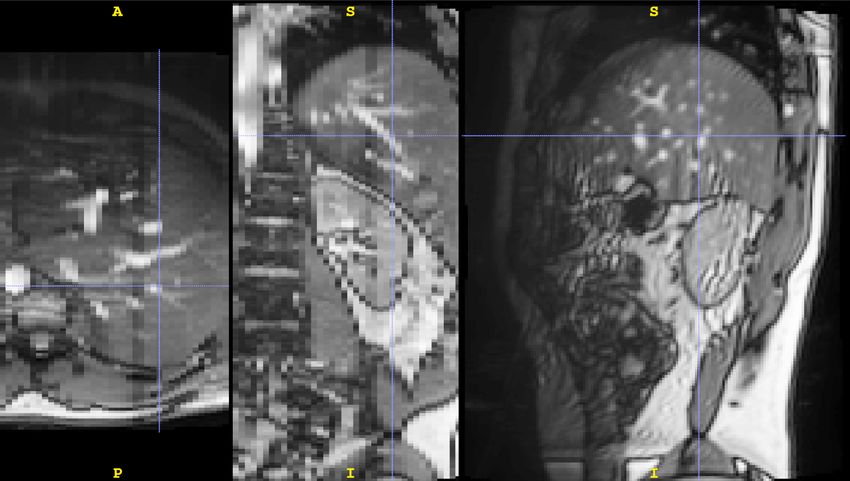
Introduction
               During the last decade, 4D MRI has gained considerable interest in research, because it
               promises access to information on the respiratory motion of the thorax and abdomen
               free of radiation. Respiratory motion information is vital for many medical applications
               in diagnostics [1], treatment planning [2] and execution [3]. Our application scenarios
               are MRI guided percutaneous interventions on the liver like radio frequency-, microwave-
               and cryoablation, biopsies, or brachytherapy, where the challenge of a moving target
               exists. 4D MRI methods have been proposed, but none satisfy all the needs for our
               interventional application. These needs are first, physiological correctness of the 4D
               sequence, and second, robustness against the out-of-plane motion. In this study, we
               propose a new 4D MRI reconstruction method. It utilizes retrospective sorting of
               dynamic 2D TRUFI MRI slices and is capable of imaging the whole liver during free
               breathing and capturing organ deformations caused by respiration. It reconstructs a
               physiologically meaningful sequence of respiratory states by utilizing a dedicated
               navigator frame and copes with out-of-plane motion.

               Related work
               To our knowledge, there exist two approaches to acquiring 4D MRI, each with its
               unique advantages and disadvantages. The first is to acquire 3D MRI sequences in
               real-time, as done by Kim et al. [4] and Bled et al. [5]. The advantages of this approach
               are that it does not rely on gating and thus supports imaging events that do not occur
               repeatedly, i.e., events that are not periodic. The disadvantages of this approach are its
               low temporal and spatial resolution [6, 7] and its relatively small FOV, rendering it
               impossible to capture the respiratory motion of large organs like the liver.
                   The second approach is to reconstruct volumes for different organ states or
               breathing phases in retrospection by binning previously acquired data. Two main types
               of this approach exist. In the first type, the k-space data is sparsely sampled and binned
               before reconstructing a volume for a given organ state [8–10]. The strength of this type
               lies in capturing periodic organ state changes with a large FOV within a few minutes,
               depending on the length of the motion cycle. Its weaknesses are its assumption of
               strictly periodic organ motion. Thus, it can only reconstruct an average motion cycle of
               the target organ, which is not ensured to be physiologically meaningful. Furthermore,
               this type introduces image artifacts [11, 12] that could hinder motion estimation from
               the reconstructed 4D MRI.
                   The second type of the second approach reconstructs fast dynamic 2D sequences at
               all slice positions to cover the organ of interest. Then retrospective gating is applied to
               the resulting 2D images, binning them by different organ states, i.e., breathing states,
               and sorting them in their respective volumes. Its advantages are its applicability for
               non-periodic or quasi-periodic changes in the organ state and its high temporal and
               spatial resolution. Hence it is well-suited to capture motion variation, e.g., deep or
               shallow, abdominal or thoracic breaths within one session. It can work with a navigator
               or respiratory signal to ensure the physiological correctness of reconstructed motion. A
               further advantage of the binning strategy is its availability because it is readily usable
               with all MRI machines and all 2D sequences. Its disadvantages are that it is more
               time-intensive than the k-space binning and that much of the acquired data is
               redundant. The latter, however, can advantageously be used to increase the SNR of the
               reconstructed 4D images.
                   For both types, the surrogate can be intrinsic, relying on image information or
               k-space information, or extrinsic, relying on externally recorded signals, e.g., from using
               a breathing belt or form tracking markers that are placed on the abdomen of the

July 7, 2020                                                                                         2/16
subject. Siebenthal et al. [13, 14] utilize navigator slices as surrogate and vessel
cross-section tracking as a matching criterion. Cai et al. [15] use the body area. Lee et
al. [16] use sagittal diaphragm profiles and reconstruct one breathing cycle. Tong et
al. [17] propose a graph-based sorting where the weights are based on image information
and semi-automatic assigned respiratory phase although, they are only able to
reconstruct one best breathing cycle and not a variety of breathing cycles. Romaguera
et al. [18] propose a graph-based approach using pseudo-navigators. A drawback of the
graph-based navigator-less approach is that physiological correctness cannot be ensured
even if temporal coherence is ensured.
Materials and methods
We decided to follow the retrospective sorting approach because, as set out in the
related work section, it is the only one suited for capturing physiologically meaningful,
non-periodic organ motion with high temporal and spatial resolution and large field of
views. Its only disadvantage is the long acquisition time, which can be overcome, as
shown in this work. Specifically, we build upon the proposed method of von Siebenthal
et al. [13, 14].
The Otto-von-Guericke-University Magdeburg ethics board approves our study
”Studies with healthy subjects in 3 Tesla for methodological development of MRI
experiments” (approval number 172/12), stating they concluded that there are no
ethical concerns and that this approving assessment is made based on unchanged
conditions. Oral and written consent was obtained during the study.
In the following three sections, we describe the general concept behind the baseline
method and our method. In section Template updates and search region, we describe
how we build upon the baseline to improve it and overcome the named drawbacks.
MRI acquisition
Our MR data were acquired on a MAGNETOM Skyra MRI scanner (Siemens Medical
Solutions, Erlangen, Germany). All images were acquired with a TRUFI sequence (TR
= 39.96 ms, echo spacing = 3.33 ms, TE = 1.49 ms, flip angle = 30 degree, readout
bandwidth = 676 Hz/px, base resolution = 176 kx , phase resolution = 80% yielding a
matrix size of 140 x 176, in-plane resolution 1.82mm x 1.82mm, out of plane resolution
4 mm, FOV: 255 mm x 320 mm). For faster measurement, a partial Fourier was used
sampling 5/8 of the k-space asymmetrically in phase-encoding direction, i.e., roughly
60% of the ky lines, resulting in 88 actually acquired ky lines. Using this setup, we
achieve acquisition times of 200 ms per slice. The acquisition setup was chosen to mimic
an interventional setup as closely as possible. This specifically means high acquisition
speed and just good enough contrast to detect the respiratory motion. No body array
coil (surface array coil comprised of multiple elements) was used. Only the bore fixed
receiver coil was used, which makes this 4D MRI method compatible with a wide range
of external surrogates, including those that need a free line of sight to the abdomen of
the subject. This includes, but is not limited to, surrogates based on a scan of the
abdomen’s surface or marker tracking on the abdomen. This is important to make the
gathered motion information available for a wide range of interventional scenarios where
different surrogates may be used to track breathing. A total of 19 data sets of 13 healthy
subjects were acquired. One subject was imaged three times, four subjects were imaged
twice, and eight subjects were imaged once. If a subject was imaged multiple times,
then each data set acquisition was performed on different days to include variations that
occur in between imaging sessions. Each data set consists of two reference sequences
and several interleaved sequences. Both will be described in the following.
July 7, 2020 3/16A reference sequence is a dynamic 2D MRI sequence of so-called navigator frames. A
schematic depiction can be found in Fig 1. The navigator frames picture an image plane,
in which the respiratory motion is visible. In our case, we used a slice in the sagittal
orientation that intersects the target organ - the liver - and shows vessel cross-sections,
because their spatial distribution describes the breathing state well. This sequence is
the reference for the 4D reconstruction. The reference contains a natural succession of
different breathing patterns, like shallow or deep, thoracic or abdominal breathing, and
is thus physiologically and profoundly meaningful. One reference sequence was acquired
at the beginning and one at the end of each session. A reference sequence comprises 513
images (time points) covering a time of 102 seconds (about 20 breathing cycles).
Fig 1. Schematic depiction of a reference sequence. A reference sequence shows
a physiologically meaningful breathing curve and consists only of navigator frames that
were imaged at the same slice position.
Each interleaved sequence consists of equal parts of data frames and navigator
frames (between 150 and 200 each), see Fig 2. The former are sorted into the 4D MRI
sequences based on information extracted from the latter. Data slices and navigator
slices were imaged alternatingly, facilitating the interleaved character of the sequence.
The navigator slices are positioned exactly as in the reference sequence, rendering
temporal reconstruction possible. The data slice sweeps over the target organ in 4 mm
gaps during acquisition (see Fig 3), rendering spatial reconstruction possible. For each
slice position of the reconstructed volume one interleaved sequences is acquired. The
total number of interleaved sequences per subject ranges between 38 and 57 (mean =
46.68), depending on the size of the subjects’ target organ to capture its whole volume.
Thus, the total acquisition time for a subject ranged between 40 min and 80 min,
excluding time for imaging localizers, determining navigator position and setting up the
interleaved sequences. The total acquisition time is the time it took to capture all MRI
images necessary for 4D MRI reconstruction, i.e., reference sequences and interleaved
sequences. In the use case this acquisition would be made during planning before the
actual intervention. The imaging of localizers, determining the navigator position and
setting up the interleaved sequences took roughly 15 min per subject.
The acquisition time can be halved when using matching criteria that do not depend
on a navigator slice. The total acquisition time can be further reduced by optimizing
the acquisition scheme, allowing in-time breathing instructions for the subject for more
efficient use of the acquisition time. During the intervention itself, only a surrogate, e.g.,
a navigator frame, has to be acquired in real-time as a query to the reconstructed 4D
MRI or to a breathing model that was derived from the 4D MRI. All acquired MRI
sequences used for 4D reconstruction, and a detailed acquisition protocol are publicly
July 7, 2020 4/16available [19].
Fig 2. Schematic depiction of an interleaved sequence. An interleaved
sequence consists of navigator frames and data frames that were imaged alternatingly.
It shows a different breathing curve than the navigator sequence but contains similar
breathing patterns.
Fig 3. Schematic depiction of slice positions capturing the target volume.
Slices are in sagittal orientation. The position of the navigator slice is the same for all
sequences per subject. The slice positions for the data frames are distinct and
correspond to different interleaved sequences from the 1’st to the N’th. Interleaved
sequences are acquired from right to left.
4D MRI reconstruction
Our method and the baseline method use the reference sequence as grounds for the
temporal reconstruction of a 4D MRI sequence showing a physiologically meaningful
course of breathing states. The general scheme of the reconstruction process is depicted
in Fig 4. For each time point in the reference sequence, i.e., for each frame, a volume is
reconstructed. First, the breathing state of the frame is determined. Second, in each
interleaved sequence, all data frames are found that match the breathing state, using a
matching criterion, see Fig 5. Third, the found frames are averaged (binned) to one slice
July 7, 2020 5/16to improve the SNR (signal-to-noise ratio). Fourth, the averaged slice is inserted
(sorted) into the volume at its designated position, which is known and unique for each
interleaved sequence. Doing this for all reference frames results in a continuous 4D MRI
sequence. The reconstructed FOV’s range from 255 mm x 320 mm x 152 mm to 228
mm (140 x 176 x 38 to 57 voxels) depending on the size of the target organ. In the next
section, the matching criterion is described in detail.
Fig 4. Scheme of 4D MRI reconstruction. For each time point in the reference
sequence, a volume is reconstructed. For that in each interleaved sequence, the data
slices are found that match the breathing state. They are then averaged and sorted into
a volume.
Fig 5. Scheme of finding data slices that match specific breathing state. On
the left hand, the reference sequence is depicted. The red bracket represents the third
breathing state. It is found in the interleaved sequence, depicted on the right, by
comparing the enclosing navigator slices.
Matching criterion
A matching criterion is used to find all data slices showing the reference breathing state
within an interleaved sequence. The respiratory state of a frame is determined by its
enclosing navigator frames. Hence, the matching criterion acts on pairs of navigator
frames that encase another frame (navigator or data frame); see brackets in Fig 5. It is
based on the displacement of tracked vessels within the navigator frames. Assume a
navigator frame nti at time point ti in the reference sequence that shows a reference
breathing state BSr . We want to find a data frame dtj with the same breathing state as
nti . To this end, the enclosing navigator frames of both dtj and nti are used. The
enclosing navigator frames of dtj are ntj−1 and ntj+1 and the enclosing frames of nti are
nti−1 and nti+1 . The vessel displacements from ntj−1 to nti−1 and from ntj+1 to nti+1
are calculated. When the sum of all vessel displacements for two pairs of navigator
July 7, 2020 6/16frames is under a certain threshold, then the two enclosed frames are assumed to be a
match, i.e., to show the same breathing state. The threshold is the only parameter of
the method. It determines the maximally allowed displacements for two frames to be
counted as a match.
The vessel tracking is realized via template matching using OpenCV [20] and its
similarity measure TM CCOEFF NORMED (see equation 1).
0 0 0 0 0 0
P
x0 ,y 0 (T (x , y ) · I (x + x , y + y ))
R(x, y) = qP (1)
0 (x0 , y 0 )2 · 0 (x + x0 , y + y 0 )2
P
0
x ,y 0 T 0
x ,y 0 I
where
T0 (x0 , y 0 ) = T (x0 , y 0 ) − 1/(w · h) · x00 ,y00 T (x00 , y 00 )
P
(2)
I0 (x + x0 , y + y 0 ) = I (x + x0 , y + y 0 ) − 1/(w · h) · x00 ,y00 I (x + x00 , y + y 00 )
P
Here T0 is the template T minus its mean pixel intensity, and I0 is an image patch
with the same size as the template. Its pixel values are also shifted by minus the patches
mean pixel intensity. w and h are the width and height of the template and the patch.
R is the resulting image of the template matching. Each entry R(x, y) contains the
similarity value of the template to the source image at position (x, y)
The templates are manually defined for each tracked vessel cross-section in the
reference sequence. To this end, a user identifies trackable vessels in one slice of the
reference sequence prior to the 4D reconstruction, which takes only a few seconds. In
our case, trackable means that the vessel cross-section or cluster of cross-sections will be
visible in most navigator frames throughout the whole navigator sequence and that the
cross-section has a high contrast to the surrounding tissue as well as a high signal to
noise ratio. This is mostly not the case for small cross-sections but true for larger ones.
Template updates and search region
One of the challenges for the template matching is the out-of-plane motion of the vessel
cross-sections in the navigator frames. In these cases, the searched-for regions are
changing their appearance throughout breathing; hence, they are difficult to find using
fixed templates.
To increase robustness against the out-of-plane motion, we propose to apply
template updates within the reference sequence. In Fig 6, one can see how the
appearance of a vessel cross-section can change during a breathing cycle. The method
starts with the templates that were defined manually on reference frame nt0 . Then, for
each following navigator frame nti that was captured at time point ti , the templates get
automatically updated, as follows: The positions of all tracked vessels in nti are found
with subpixel precision using the templates from time point ti−1 . Then a new set of
templates is cut from nti based on the position of the matched templates. The template
position is updated with floating-point precision. The updates ensure that changes in
the appearance of the tracked vessel are represented in the updated templates. The
subpixel precision in the updates is needed to avoid drift during the update.
Another concern of the reconstruction approach is speed. In its original form, the
method matches each template against each navigator frame, resulting in a substantial
computational burden. We propose to speed up the vessel tracking by exploiting spatial
coherence between temporally adjacent navigator frames. The underlying assumption is
that the next searched-for match is in a small spatial neighborhood around the
previously found match, which is the case due to fast and continuous acquisition.
Therefore, we only use a small neighborhood around the last matched template position
as a search area.
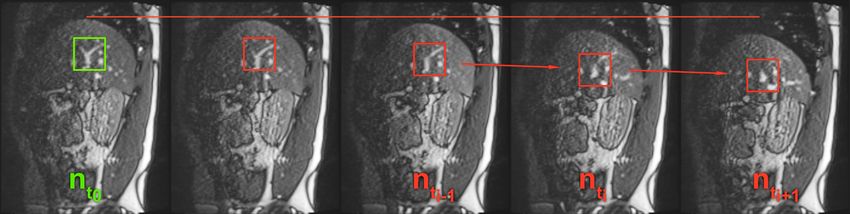
July 7, 2020 7/16Fig 6. Out-of-plane motion and template updates. The figure shows a series of
navigator slices. The green rectangle denotes a typical ROI that was manually
determined as a template. In the red rectangles, one can see how the vessel cross-section
changes its appearance during the breathing cycle. For viewing purposes only, the
images gradation curve was altered globally to enhance contrast.
Moreover, we automatically detect breathing states that cannot be reconstructed
entirely and use that knowledge to inform where (temporally and spatially) the 4D
sequence is incomplete. This information is essential for the later application, because of
the visual feedback that can be provided to the physician in real-time when the motion
information is insufficient to fuse the planning data to the interventional data.
Evaluation
We compare our method with the baseline method of Siebenthal et al. through
reconstruction rate and image quality. We define the reconstruction rate as the
percentage of the number of slices in the volume that could be reconstructed by the
method. Note that this does not account for false positives or false negatives because
the ground truth is not available to us. We also investigate how the acquisition order of
the reference sequence and interleaved sequence influences the method’s ability to find
matching data frames. We evaluate the point of false positives indirectly using a
qualitative assessment of both approaches. The image quality is assessed in a
double-blind study with interventional radiologists.
Reconstruction rate
We compare the reconstruction rate of both methods for different parameterizations.
This is possible because the baseline method uses the same parameters in its matching
criterion. When a subject was imaged multiple times, the reconstruction rates of its
respective data sets were averaged for the statistical analysis to avoid possible biases.
We tested the parameters shown in Table 1. We tested the threshold, for the values 0.5,
1, and 2. Evaluating different thresholds from a quantitative point-of-view allows us to
judge which method will be more suitable for different applications that differ in the
kind of trade-off between precision and coverage that is preferable in the application.
With lower (stricter) thresholds, the coverage goes down and the precision increases.
With higher thresholds, the coverage increases and the precision decreases. We tested
two similarity measures from OpenCV, namely TM CCOEFF NORMED (see equation
1) and TM CCORR NORMED (see equation 3), and we tested the influence of the
chosen reference sequence, ref. 1 and ref. 2, where ref. 1 is acquired before and ref. 2 is
acquired after the interleaved sequences.
0 0 0 0
P
x0 ,y 0 (T (x , y ) · I (x + x , y + y ))
R(x, y) = qP (3)
0 0 2 0 0 2
P
x0 ,y 0 T (x , y ) · x0 ,y 0 I (x + x , y + y )
July 7, 2020 8/16where T is the template, I is the image and R is the resulting image with the highest
intensity in position (x, y), where the similarity was the highest.
A four-factorial analysis of variance (ANOVA) was conducted to test for the effects
of the aforementioned factors on the reconstruction rate.
Table 1. Tested parameter values
Parameter Value
Threshold 0.5; 1; 2
Similarity measure TM CCORR NORMED; TM CCOEFF NORMED
Reference Sequence ref. 1; ref. 2
Reconstruction quality
We conducted a double-blind study with ten interventional radiologists to compare the
reconstruction quality of both methods and to evaluate whether our method’s
reconstruction quality improves over the baseline. Participants were recruited from a
General Radiology clinic. Their professional experience ranged from 4 months to 20
years (median: 16 months, mean: 62 months).
The interviews were in no way invasive, and no data that would allow for participant
identification was included in the analysis. Thus, IRB approval was not requested for
the interviews. In all cases oral participation consent was obtained and recorded.
Each radiologist was shown a set of 48 slice image pairs. The images of a pair were
reconstructed from the same subject and breathing state showing the same anatomical
structure and having the same slice position and orientation. One slice in a pair was
sampled from a reconstruction of the baseline method. The other was sampled from a
reconstruction of our method. Slices of a reconstructed volume are depicted in Fig 7.
The radiologists had to decide which of the images in a pair shows the anatomy of the
target organ more faithfully, i.e., with fewer image artifacts. Participants did not see the
two slices from each pair simultaneously but could switch back and forth between them
as often as they wanted before picking one. Participants were asked to select the slice
they considered better. A neutral option was provided. For the evaluation of
reconstruction quality, the parameter set was chosen to be 1 px threshold and
TM CCOEFF NORMED as a similarity measure for both methods. Only those volumes
were considered for comparison, for which both methods had a reconstruction rate of at
least 80%. For each radiologist, 48 volume pairs were chosen randomly.
Furthermore, in both volumes, we automatically masked slices out (setting intensity
values to black), where either of the methods did not find a matching data frame. We
made both volumes identical in the amount and distribution of black slices. This was
done because it is likely that a reduced reconstruction rate for a volume would be
detrimental to its perceived reconstruction quality. Each slice pair was sampled at a
random orientation and position chosen within a range, such that the sampled slice
would show the target organ. Slices were sampled either in sagittal, coronal, or axial
orientation. Due to a software error, the number of slices for different planes was
slightly imbalanced: Overall, 100 slices were shown for the sagittal and axial orientation
each, and 280 slices were shown for the coronal orientation. For each of the 480 image
pairs shown to participants, we recorded which method was preferred, if either. For
data analysis, the two methods were appointed one ‘point’ each for every time they had
been preferred. For each neutral vote, both methods were appointed a half ‘point’. This
led to a dichotomous variable that allows for a direct comparison of the two methods’
scores. A one-sided binomial test was conducted (H0 : pour method ≤ 0.5,
H1 : pour method > 0.5).
July 7, 2020 9/16Fig 7. Axial, coronal and sagittal slices of a reconstructed volume. The
images gradation curve was altered globally to enhance contrast for better viewing only.
In the axial and coronal orientation, one can see that our method is capable of
reconstructing smooth and continuous volumes from sagittal slices.
Results
Table 2 shows the mean reconstruction rates for all parameter combinations. Our
method has a consistently higher reconstruction rate than the baseline (about twice as
high) for all parameter sets. Fig 8 and 9 show the respective distribution of
reconstruction rates. All underlying reconstruction rates per reconstructed 4D MRI and
all tested parameters are provided in S1 Supporting Information.
Table 2. Mean reconstruction rates [%] of our method and baseline
Reconstruction rates are given in percent reconstructed of a volume. Bold is the best
rates for each parameter set.
TM CCORR NORMED TM CCOEFF NORMED
threshold 2px 1px 0.5px 2px 1px 0.5px
baseline 24.58 15.95 9.94 41.78 24.10 12.74
ref. 1
our method 73.60 40.99 23.24 77.69 47.10 27
baseline 46.86 31.95 18.75 60.09 40.07 22.92
ref. 2
our method 79.67 56.89 36.78 82.18 58.53 37.34
baseline 35.72 23.95 14.34 50.93 32.08 17.83
avrg.
our method 76.63 48.94 30.01 79.93 52.82 32.17
The four-factorial ANOVA showed significant main effects for all four factors and
one significant interaction effect for the reconstruction method and the threshold used
(Table 3). This interaction effect describes that while our method performs better than
the baseline method at all threshold levels, it achieves more significant improvements at
higher thresholds (see also Fig 8 and 9).
On the tested data, it was also more robust against the chosen similarity measure
used for the template matching and also more robust against whether the reference
July 7, 2020 10/16Fig 8. Reconstruction rates for reference sequence one.
Fig 9. Reconstruction rates for reference sequence two.
Table 3. Main results of the ANOVA on the reconstruction rate.
Effect type Factor df F p
Reconstruction method 1 134.99positions. Reference sequence two (blue graphs) is acquired after all interleaved
sequences. Here both methods find more slices for the later slice positions.
The mean reconstruction time of our method is 24.19 seconds, with a standard
deviation of 6.82 seconds. The mean reconstruction time of the baseline is 73 seconds,
with a standard deviation of 21.81 seconds.
25 ref. 1, our
ref. 1, base
Average number of slice matches
ref. 2, our
20 ref. 2, base
15
10
5
0
0 5 10 15 20 25 30 35
Slice position
Fig 10. Correlation of slice position and number of slice matches. Red
graphs represent the average number of slice matches for the first reference sequence
(averaged over all subjects). Blue graphs correspond likewise to the second reference
sequence. Graphs with squares represent our method; graphs with crosses represent the
baseline method. Error bars represent standard deviation and are scaled by 0.1 for
better readability.
In the double-blind study, overall, participants selected our method in 156 trials, the
baseline method in 111 trials, and had no preference in 213 trials (see Fig 11).
Following our analysis method, this yielded 262.5 ‘points’ for our method and 217.5
‘points’ for the baseline method (p=0.02). All acquired data of the study is provided in
S2 Supporting Information.
The study shows that radiologists perceive the reconstruction quality of our method
as significantly better than the baseline method, although the effect seems to be small.
Discussion and conclusion
The particular acquisition scheme shows difficulties with changes in breathing patterns
that arise over a more extended period, like the typical flattening of the resting breath.
Slice positions to the left are imaged only at the end of acquisition time, whereas slices
to the right are only imaged at the beginning. As a consequence, if the reference
sequence was captured in the beginning, it can show breathing states that do not occur
later, when slice positions to the left are imaged. Deep breaths often can not be fully
reconstructed since image data of the left slice positions was not acquired for deep
breathing states. Generally speaking, the scheme has difficulties with breathing states
that are less frequent. This problem can be solved in changing the acquisition scheme.
Instead of first acquiring all slices in one position before moving on to the next slice
July 7, 2020 12/16Fig 11. Participant choice. The bars represent the number of times each option was
chosen out of 480 trials.
position, it is beneficial to move the slice position after each acquisition while keeping
the navigator position fixed. This rotating acquisition scheme could also be combined
with intermediate reference sequences. This would directly counter the problem with
flattening breath over time. Furthermore, with the new scheme, it is feasible to give a
few commands, so the subject can take a few more deep breaths in the beginning before
starting to relax more.
The rotating acquisition scheme was used by Siebenthal et al. on a 1.5T Philips
Intera whole-body MRI system [14]. However, Siemens MRI machines do not allow this
kind of scheme. A solution to the problem that is independent of the scanner used is to
use external respiratory signals instead of navigator frames. Preiswerk et al. [21] had
correlated 1D MR compatible ultrasound with 2D and multiplanar MRI. This allows for
the continuous rotating acquisition of the data slices on any MRI machine. Celicanin et
al. [22] propose a simultaneous multislice (SMS) imaging technique that allows for the
simultaneous acquisition of navigator and data frames, increasing the temporal
coherence of navigator and data frame. Barth et al. [23] give a current overview of
parallel imaging and SMS imaging techniques. These would integrate well with the
rotational acquisition scheme when using body array coils. No body array coil is used in
our experiment to ensure a line of sight for external marker tracking. However, when
external marker tracking is not needed, a body array coil can readily be used in
conjunction with our method to have better image contrast and possible faster imaging
with aforementioned SMS techniques applied. When flat, flexible array coils with an
opening for operation become available, those benefits, i.e, higher SNR, faster
acquisition and line of sight, could be combined.
Regarding the acquisition time, the aforementioned changes to the acquisition
scheme would half the acquisition time in our case to between 20 and 40 min.
Regarding the reconstruction rate, because of the lack of ground truth, it is not
possible to account for false negatives and false positives in the evaluation. Based on
this fact, the reconstruction rate of both methods will possibly be higher than measured
in this study. This is because, in our test data, the number of reconstructable slice
positions in each volume is lower than the number of slices in a volume, resulting from
the acquisition scheme mentioned above.
An open issue arises when vessel cross-sections in the navigator frame are not
continually visible. This frequently happens to depend on blood flow. To solve this, one
could detect outliers in the template matching step and omit those for the calculation of
July 7, 2020 13/16the summed displacement.
We decided to use MRI data of healthy volunteers for the development and
evaluation of the method. For a proof of concept of our method, this eliminates possible
adverse effects of liver diseases on the respiration of the patient, making the evaluation
environment more controlled. However, in future work, it has to be evaluated if typical
diseases targeted by this method, like liver carcinoma, affect the method. This could be
especially the case if the disease impairs the respiration of the patient. If the patient’s
breathing shows no or few repetitions of patterns, this would be a challenge for the
method because whilst allowing for irregular breathing, it assumes that patterns are
recurring over time.
In its presented form, our method relies on a manual step in which the ROIs around
the vessel cross-sections are defined. In a real clinical setting, this is intended to be
done offline after the planning MRI session and before the date of the intervention on a
suitable computer, not directly on the MRI machine. Even though this manual
interaction is minimal and takes less than a minute to perform, it could and should be
automated in future work. This could be solved as a classification problem in image
space using the temporal information of the reference sequence as supporting
information.
In our evaluation of the visual reconstruction quality, we only compare our method
relative to the baseline. The provided neutral option does not differentiate between
equally good and equally bad or unusable, and no absolute data was gathered. Hence,
our analysis does not show whether the reconstructions are good enough for a given task
or not. The analysis only indicates that our method’s reconstruction quality improves
over the baseline.
In summary, our results clearly show that template updates are an effective and
efficient means to increase reconstruction rates and image quality of the reconstruction
result for template-based 4D MRI reconstruction methods. We reported that employing
search regions significantly reduces reconstruction time. The results suggest that our
method is preferable compared to the baseline. This is regardless of the application’s
favorable trade-off between precision and coverage because, in all cases, reconstruction
rates are higher than the baseline.
Supporting information
S1 Supporting Information. Reconstruction rates. Reconstruction results of
the experiments for all 4D MRI reconstructions and tested parameters.
S2 Supporting Information. Study results. Participants choices in the image
quality study.
Acknowledgments
We gratefully acknowledge the Research Campus STIMULATE Solution Centre for
Image Guided Local Therapies for providing the MRI scanner for our study and Cindy
Lübeck for operating the scanner.
References
1. Merchavy S, Luckman J, Guindy M, Segev Y, Khafif A. 4D MRI for the
Localization of Parathyroid Adenoma: A Novel Method in Evolution.
July 7, 2020 14/16Otolaryngology–Head and Neck Surgery. 2016;154(3):446–448.
doi:10.1177/0194599815618199.
2. Han F, Zhou Z, Du D, Gao Y, Rashid S, Cao M, et al. Respiratory
motion-resolved, self-gated 4D-MRI using Rotating Cartesian K-space (ROCK):
Initial clinical experience on an MRI-guided radiotherapy system. Radiotherapy
and Oncology. 2018;127(3):467 – 473.
doi:https://doi.org/10.1016/j.radonc.2018.04.029.
3. Colvill E, Booth J, Nill S, Fast M, Bedford J, Oelfke U, et al. A dosimetric
comparison of real-time adaptive and non-adaptive radiotherapy: a
multi-institutional study encompassing robotic, gimbaled, multileaf collimator
and couch tracking. Radiotherapy and Oncology. 2016;119(1):159–165.
4. Kim YC, Lebel RM, Wu Z, Ward SLD, Khoo MC, Nayak KS. Real-time 3D
magnetic resonance imaging of the pharyngeal airway in sleep apnea. Magnetic
resonance in medicine. 2014;71(4):1501–1510.
5. Bled E, Hassen WB, Pourtau L, Mellet P, Lanz T, Schüler D, et al. Real-time 3D
MRI of contrast agents in whole living mice. Contrast media & molecular
imaging. 2011;6(4):275–281.
6. Giger A, Stadelmann M, Preiswerk F, Jud C, De Luca V, Celicanin Z, et al.
Ultrasound-driven 4D MRI. Physics in Medicine & Biology. 2018;63(14):145015.
7. Deng Z, Pang J, Yang W, Yue Y, Sharif B, Tuli R, et al. 4D MRI using 3D radial
sampling with respiratory self-gating to characterize temporal phase-resolved
respiratory motion in the abdomen. Magnetic resonance in medicine.
2016;75(4):1574.
8. Han F, Zhou Z, Cao M, Yang Y, Sheng K, Hu P. Respiratory motion-resolved,
self-gated 4D-MRI using rotating cartesian k-space (ROCK). Medical physics.
2017;44(4):1359–1368.
9. Stemkens B, Tijssen RH, de Senneville BD, Heerkens HD, Van Vulpen M,
Lagendijk JJ, et al. Optimizing 4-dimensional magnetic resonance imaging data
sampling for respiratory motion analysis of pancreatic tumors. International
Journal of Radiation Oncology* Biology* Physics. 2015;91(3):571–578.
10. Rank CM, Heußer T, Buzan MT, Wetscherek A, Freitag MT, Dinkel J, et al. 4D
respiratory motion-compensated image reconstruction of free-breathing radial MR
data with very high undersampling. Magnetic resonance in medicine.
2017;77(3):1170–1183.
11. Mickevicius NJ, Paulson ES. Investigation of undersampling and reconstruction
algorithm dependence on respiratory correlated 4D-MRI for online MR-guided
radiation therapy. Physics in Medicine & Biology. 2017;62(8):2910.
12. Pang J, Yang W, Bi X, Fenchel M, Deng Z, Chen Y, et al. 4D-MRI with Iterative
Motion Correction and Averaging Improves Image SNR and Reduces Streaking
Artifacts without Compromising Tumor Motion Trajectory. International Journal
of Radiation Oncology• Biology• Physics. 2016;96(2):S62–S63.
13. von Siebenthal M, Cattin P, Gamper U, Lomax A, Székely G. 4D MR imaging
using internal respiratory gating. In: International Conference on Medical Image
Computing and Computer-Assisted Intervention. Springer; 2005. p. 336–343.
July 7, 2020 15/1614. von Siebenthal M, Szekely G, Gamper U, Boesiger P, Lomax A, Cattin P. 4D
MR imaging of respiratory organ motion and its variability. Physics in Medicine
& Biology. 2007;52(6):1547.
15. Cai J, Chang Z, Wang Z, Paul Segars W, Yin FF. Four-dimensional magnetic
resonance imaging (4D-MRI) using image-based respiratory surrogate: a
feasibility study. Medical physics. 2011;38(12):6384–6394.
16. Lee D, Kim S, Palta J, Lewis B, Keall P, Kim T. A retrospective 4D-MRI based
on 2D diaphragm profiles for lung cancer patients. Journal of medical imaging
and radiation oncology. 2019;.
17. Tong Y, Udupa JK, Ciesielski KC, Wu C, McDonough JM, Mong DA, et al.
Retrospective 4D MR image construction from free-breathing slice Acquisitions:
A novel graph-based approach. Medical image analysis. 2017;35:345–359.
18. Romaguera LV, Olofsson N, Plantefève R, Lugez E, De Guise J, Kadoury S.
Automatic self-gated 4D-MRI construction from free-breathing 2D acquisitions
applied on liver images. International Journal of Computer Assisted Radiology
and Surgery. 2019; p. 1–12.
19. Gulamhussene G, Joeres F, Rak M, Lübeck C, Pech M, Hansen C. 2D MRI liver
slices with navigator frames. A test data set for image based 4D MRI
reconstruction;. Available from:
https://doi.org/10.24352/UB.OVGU-2019-093.
20. Bradski G. The OpenCV Library. Dr Dobb’s Journal of Software Tools. 2000;.
21. Preiswerk F, Toews M, Cheng CC, Chiou JyG, Mei CS, Schaefer LF, et al.
Hybrid MRI-Ultrasound acquisitions, and scannerless real-time imaging.
Magnetic resonance in medicine. 2017;78(3):897–908.
22. Celicanin Z, Bieri O, Preiswerk F, Cattin P, Scheffler K, Santini F. Simultaneous
acquisition of image and navigator slices using CAIPIRINHA for 4D MRI.
Magnetic resonance in medicine. 2015;73(2):669–676.
23. Barth M, Breuer F, Koopmans PJ, Norris DG, Poser BA. Simultaneous multislice
(SMS) imaging techniques. Magnetic resonance in medicine. 2016;75(1):63–81.
July 7, 2020 16/16You can also read