VIRTUAL MACHINES VERSUS CONTAINERS - HOW IBM WEBSPHERE HYBRID EDITION WITH RED HAT OPENSHIFT CAN LOWER SERVER COSTS AND IMPROVE RESPONSE TIME
←
→
Page content transcription
If your browser does not render page correctly, please read the page content below

February 2021

                     Virtual Machines versus containers
           How IBM WebSphere Hybrid Edition with Red Hat OpenShift can
                                  lower server
                       costs and improve response time

IBM IT Economics Consulting & Research                              © 2021 IBM Corporation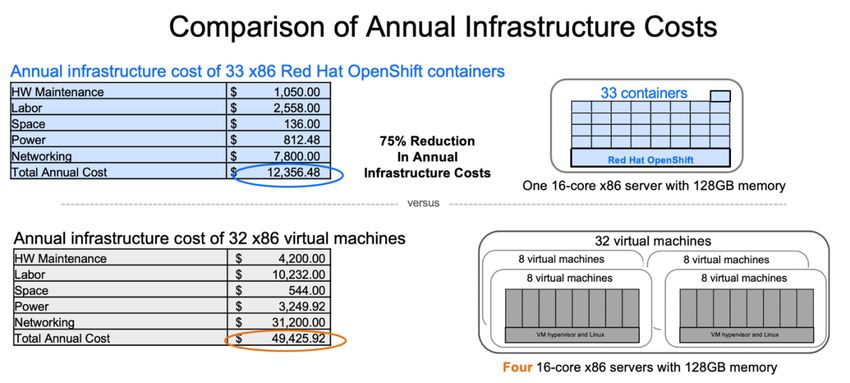
Get more for less
         IT organizations frequently seek to lower cost and to create higher efficiencies. Virtual machine
         deployment of applications has improved efficiency over native server deployment, and moving to
         containers can bring even more value.

         IBM tests show that transaction workloads on x86 can be delivered at over four times the throughput
         and in half the response time using a Red Hat® OpenShift® environment versus a classically deployed
         virtual machine environment.1 In this paper we examine resource requirements for virtual machines and
         containers, and the impact of these technologies in real data center environments.

         The case for containers
         Several factors contribute to underutilization of resources in an x86 server infrastructure when using
         virtual machines. Containers, in place of virtual machines, can address those challenges.

         “One-size-fits-all” servers
         To facilitate server deployment, many IT organizations use just a few “t-shirt” size x86 server
         configurations to support all their workloads. The benefit of this approach is that it simplifies the
         procurement process and makes server deployment and maintenance easier. All servers conform to a
         limited variety of profiles, so staff can more efficiently patch, repair and replace hardware as needed. The
         downside is that not all customer applications perform the same. Due to individual workload
         characteristics, some require more CPU or I/O resources while others may be more memory intensive.

         x86 CPU utilization levels
         Most applications on x86 servers run at very low CPU average utilizations. Measurements of 7,485 virtual
         machines from IT Economics assessments of four large enterprise customer environments found that the
         majority of workloads peak at less than a single 2 GHz x86 core2, resulting in underused CPU driving the
         need for additional servers to satisfy workload requirements.

         1
           IBM tests were performed to replicate conditions in observed customer environments for transaction workloads running in virtual machines versus Red Hat OpenShift containers
         on x86 servers. Workloads were run to simulate a variance in CPU demand with a peak-to-average ratio of 7 to 1 on 16-core Cascade Lake x86 servers configured with 128 GB
         memory as well as a separate server for Control Plane functionality. Software included RHEL, x86 hypervisor, OpenShift containers, and an OLTP application driven by JMeter. The
         OCP environment required 15,536 MHz to deliver a total of 2,676 TPS collectively over 33 containers with a per-container average of 81 TPS and a response time of 3 milliseconds
         and a CPU consumption of 5.81 MHz per TPS. Using identical workloads 8 VMs required 3,911 MHz to deliver a total of 627 TPS with a per VM average of 78 TPS and a response
         time of 6.4 milliseconds and CPU consumption of 6.24 MHz per TPS.
         2
          Utilization samples were taken from 7,485 virtual machines running on 15,558 x86 cores in four large enterprise accounts to measure actual consumed MHz. Sample period
         durations varied from five minutes to 30 minutes. Time-series values were normalized to a five minute duration using a standard normal distribution. Average utilization was
         calculated as the average of all of the time-series samples for each virtual machine and the peak utilization was defined as the 95th percentile highest value measured. 63% of
         virtual machines measured had a peak/average ratio greater than 7 to 1 and 30% of virtual machines had a peak/average ratio greater than 13 to 1. For additional information on
         x86 workload analysis contact the IBM IT Economics team, IT.Economics@us.ibm.com.

                                                                                                 2

IBM IT Economics Consulting & Research                                                                                                                                                © 2021 IBM Corporation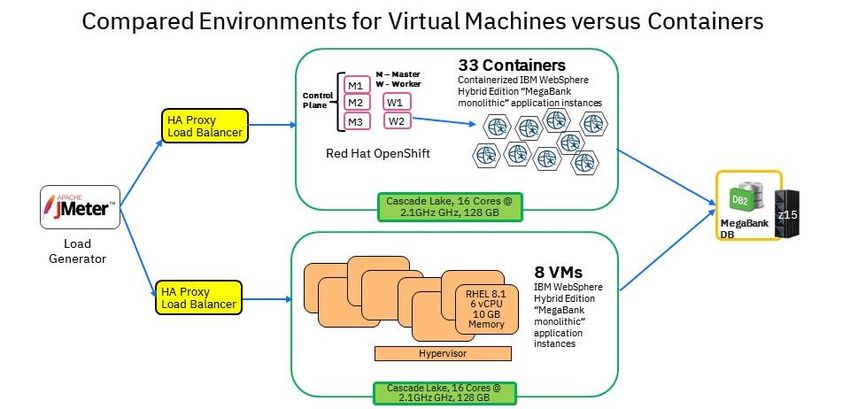
Workload variance
         Not only do workloads have low peak CPU utilization, they also have highly variable CPU peak-to-average
         ratios. Measurements from the same 7,485 virtual machines referenced above found that while some of
         the measured applications show extreme variability with 13-to-1 or greater peak-to-average ratios, on
         average the measured applications showed a 7-to-1 or greater peak-to-average ratio.2 For example, the
         peak CPU utilization might be 91% but the average CPU utilization is only 7%.

         For an application with a peak-to-average ratio of 7 to 1 the best possible CPU utilization would be 1/7 or
         just less than 15%. We say best possible because that would assume that the peak is 100% of the available
         capacity of the machine. Many users run their servers more conservatively to peak at less than 50% of the
         available capacity of the machine. Peaking at half the available capacity is sometimes due to systems
         limitations, but more often to provide for high-availability failover and disaster recovery.

         Linux workloads
         Linux® brings openness, flexibility and savings, and thus continues to be a strategic operating system for
         the IT industry. Linux was originally designed to ‘own’ the server as a UNIX® OS. In particular when it
         comes to memory, the Linux operating system attempts to effectively use all the memory available to it.
         The result is that it locks up memory resources that could be made available to other virtual machines
         when it is not needed, for example during virtual machine idle periods.

         Hypervisor impacts
         Common rules of thumb used to manage hypervisor performance also contribute to low utilization. Three
         rules in particular tend to limit utilization: CPU overcommit ratios, hypervisor host limits, and memory
         overcommit limits. Conventional capacity planning suggests using no more than 4:1 for virtual to real CPU
         overcommit. The second rule, hypervisor host limits, is to allocate no more than one virtual machine per
         real CPU on the host. The third rule, for memory overcommit, is that no more than 75% to 80% real
         memory should be used by virtual machines. The purpose of the memory overcommit rule is to leave
         sufficient margin for the movement of virtual machines among hosts.

         All of these factors cause applications running in virtual machines to exhaust host memory resources
         before effectively using available host CPU resources resulting in low average CPU utilization at the real
         server level.

         Red Hat OpenShift containers3, on the other hand, can share memory resources and instead of being
         memory limited, are more likely to be CPU limited. This is a positive outcome since it means that
         applications running in this environment can effectively use all of the CPU resources available in the server
         resulting in high average CPU utilization. The ability to freely use CPU resource decreases the number of
         wasted cores and servers, resulting in reduced infrastructure, fewer software licenses, and fewer
         management resources.
         Comparing containers to virtual machines
         In order to determine the actual benefits of containers versus virtual machines we compared a client
         simulated banking application transaction suite running IBM WebSphere® Hybrid Edition in an x86
         virtualized environment using Red Hat OpenShift containers versus virtual machines.

         x86 configuration

         3
             https://www.openshift.com/products/container-platform

                                                                     3

IBM IT Economics Consulting & Research                                                                                © 2021 IBM Corporation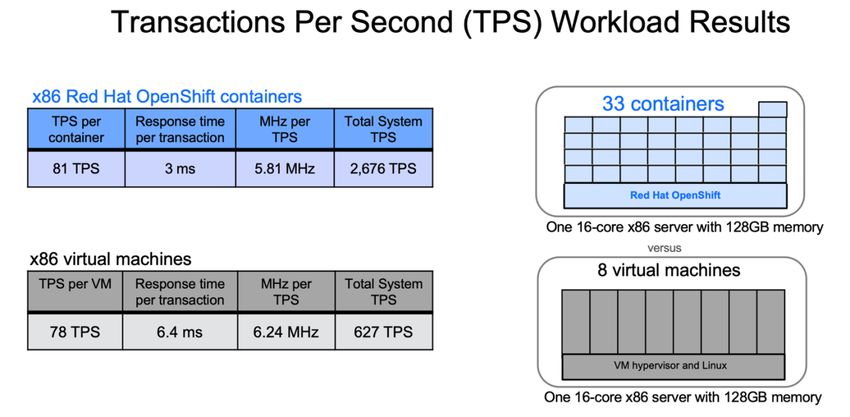
Both hypervisor hosts were compared against the resources available on a 2.1 GHz Cascade Lake x86
         server with 16 cores and 128 GB of memory. JMeter drove workload for both client simulated banking
         transaction processing solutions on x86. The backend database was hosted on an IBM z15™ for both
         environments (see figure 1).

            Figure 1: Overview of test environment with JMeter driving client simulated banking solution on x86 with backend
            database on IBM z15

         For the hypervisor environment we made the following assumptions based on the three CPU overcommit
         ratio, hypervisor host limit, and memory overcommit limit rules observed in client environments.
         • CPU Overcommit Ratio (OCR) of 4 virtual CPUs to 1 real CPU
         • Hypervisor limit of 1 virtual machine per real CPU
         • 1-for-1 virtual memory allocation to real memory AND 20% of memory is left free to facilitate the
           virtual machine movement

         Application activity
         The application load for the banking suite was designed to reflect the CPU variance of workload
         distribution activity observed in datacenters. The workloads were run to simulate a variance in CPU
         demand with a peak-to-average ratio (7 to 1).
         • Average utilization of 488 MHz on a 2 vCPU server (11% utilization) and a 7-to-1 peak-to-average ratio

         Although JMeter drove the same workloads to the virtual machines and container environments, testing
         found that CPU utilization with the virtual machines was significantly lower than with the containers due
         memory constraints in the VM environment. Without available memory, additional workloads (virtual
         machines) to improve CPU utilization could not be run within the existing configuration.

                                                                       4

IBM IT Economics Consulting & Research                                                                                         © 2021 IBM Corporation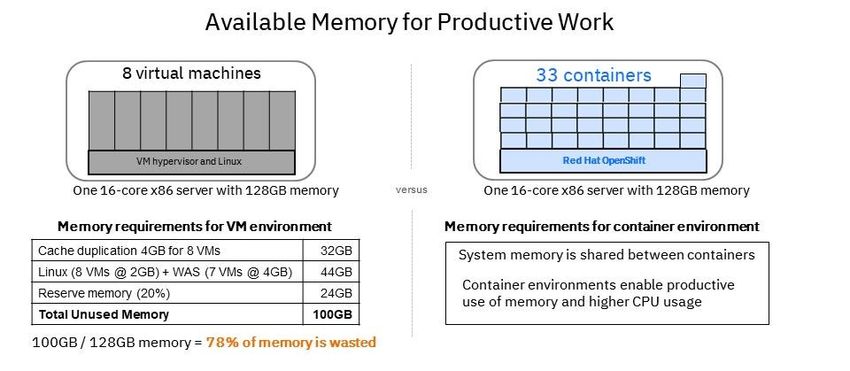
Conversely, testing found that in the container environment all of the resources were shared, freeing up
         memory for more productive use. With additional memory more application instances could be hosted,
         driving more CPU resource and resulting in more effective use of all resources within the existing
         configuration.

                          Figure 2: Comparison of available memory for productive work in virtual machines versus containers

         The Red Hat OpenShift container environment required 15,536 MHz to deliver a total of 2,676 TPS
         collectively over 33 containers with a per-container average of 81 TPS and a response time of 3
         milliseconds and a CPU consumption of 5.81 MHz per TPS. The same workloads in eight VMs required
         3,911 MHz to deliver a total of 627 TPS with a per VM average of 78 TPS and a response time of 6.4
         milliseconds and CPU consumption of 6.24 MHz per TPS.

         Observations
         Even with the virtual machines and containers driving nearly identical workloads, the same x86
         environment ran more containers than virtual machines enabling greater throughput.1 An added benefit
         was that the container environment also saw a reduction in response time by ½ as a result of lower
         network latency.1 Having over 4x more containers than virtual machines drives an increase of throughput
         by the same 4x factor.

         Financial impact
         The improved utilization and throughput reduces the amount of CPU and servers required to deliver the
         same workload, which translates into significantly lower infrastructure costs. To evaluate the financial
         impact, we examined annual infrastructure costs to run the same amount of workload throughput, that is,
         33 containers versus 32 virtual machines. The cost model found that transaction workloads running on x86
         can provide a 75% reduction in annual server maintenance, administration and facilities costs using a Red
         Hat OpenShift container environment versus a virtual
         machine environment.4
         4
           Annual server maintenance, administration and facilities costs include hardware maintenance, server labor, networking, floor space and energy costs for x86 servers running
         transaction workloads in virtual machines versus Red Hat OpenShift containers. Both virtual machine and container environments were run to simulate a variance in CPU demand
         with a peak-to-average ratio of 7 to 1 driving a total of 2,676 TPS over 33 containers and eight virtual machines. The Red Hat OpenShift environment was comprised of one 16-core

                                                                                                 5

IBM IT Economics Consulting & Research                                                                                                                                                © 2021 IBM Corporation
Figure 3: Results from transactions per second (TPS) for workloads in virtual machine and container environments
Cascade Lake x86 server running 33 containers. The virtual machine environment was comprised of four 16-core Cascade Lake x86 servers. The results were obtained under
laboratory conditions, not in an actual customer environment. IBM’s internal workload studies are not benchmark applications. Infrastructure costs are based on client data from IT
Economics assessments. x86 hardware pricing is based on IBM analysis of U.S. prices as of June 2020 from IDC. For more information contact IT.Economics@us.ibm.com.
6
IBM IT Economics Consulting & Research © 2021 IBM CorporationFigure 4: Comparison of annual infrastructure costs for 33 containers versus 32 virtual machines
Remove wasted resource
Containers can have a significant impact on the efficiency of your IT infrastructure. With access to shared
resources within a given environment, containers can leverage more memory and CPU, avoiding memory
constraints that can result in low CPU utilization. More effective use of server resources means decreased
system requirements, fewer servers, less upkeep and lower infrastructure costs.
Assess the benefits of a container strategy for your organization
For the many reasons explored in this paper, containers offer a variety of efficiency and cost-savings
benefits when compared to traditional VM-based application deployments.
If your organization is heading to the cloud, or simply evaluating how to optimize on-prem resources,
consider using containers for your workloads. Contact the IBM IT Economics team at
IT.Economics@us.ibm.com for more information on Red Hat OpenShift containers. Ask for a no-charge
hybrid cloud assessment to determine the most effective infrastructure for your data and cloud based
solutions.
7
IBM IT Economics Consulting & Research © 2021 IBM CorporationAbout the authors
Roger Rogers, is an IBM Executive IT Economics Consultant for the IBM IT Economics team
and works with clients worldwide to optimize their IT operations.
Susan Proietti Conti, PMP® is an IBM Executive Project Manager for the IBM IT Economics
team and helps clients leverage IT Economics to increase IT efficiencies and reduce costs.
8
IBM IT Economics Consulting & Research © 2021 IBM Corporation(C)
Copyright IBM Corporation 2021
IBM Corporation
New Orchard Road
Armonk, NY 10504
U.S.A.
02/21
IBM, the IBM logo, IBM Z, WebSphere and z15 are trademarks or registered trademarks of the International Business Machines Corporation.
A current list of IBM trademarks is available on the Web at https://www.ibm.com/legal/us/en/copytrade.shtml, and select third party trademarks that might be
referenced in this document is available at https://www.ibm.com/legal/us/en/copytrade.shtml#section_4.
Adobe, the Adobe logo, PostScript, and the PostScript logo are either registered trademarks or trademarks of Adobe Systems Incorporated in the United States, and/or
other countries.
Cell Broadband Engine is a trademark of Sony Computer Entertainment, Inc. in the United States, other countries, or both and is used under license therefrom.
InfiniBand and InfiniBand Trade Association are registered trademarks of the InfiniBand Trade Association.
Intel, Intel logo, Intel Inside, Intel Inside logo, Intel Centrino, Intel Centrino logo, Celeron, Intel Xeon, Intel SpeedStep, Itanium, and Pentium are trademarks or
registered trademarks of Intel Corporation or its subsidiaries in the United States and other countries.
Java and all Java-based trademarks and logos are trademarks or registered trademarks of Oracle and/or its affiliates.
The registered trademark Linux® is used pursuant to a sublicense from the Linux Foundation, the exclusive licensee of Linus Torvalds, owner of the mark on a world-
wide basis.
Microsoft, Windows, Windows NT, and the Windows logo are trademarks of Microsoft Corporation in the United States, other countries, or both.
OpenStack is a trademark of OpenStack LLC. The OpenStack trademark policy is available on the OpenStack website.
Red Hat®, JBoss®, OpenShift®, Fedora®, Hibernate®, Ansible®, CloudForms®, RHCA®, RHCE®, RHCSA®, Ceph®, and Gluster® are trademarks or registered trademarks of
Red Hat, Inc. or its subsidiaries in the United States and other countries.
RStudio®, the RStudio logo and Shiny® are registered trademarks of RStudio, Inc.
TEALEAF is a registered trademark of Tealeaf, an IBM Company.
Temenos, Transact and T24 are registered trademark of Temenos AG.
UNIX is a registered trademark of The Open Group in the United States and other countries.
Worklight is a trademark or registered trademark of Worklight, an IBM Company.
Zowe™, the Zowe™ logo and the Open Mainframe Project™ are trademarks of The Linux Foundation.
All statements regarding IBM’s future direction and intent are subject to change or withdrawal without notice, and represent goals and objectives only.
The information contained in this documentation is provided for informational purposes only. While efforts were made to verif y the completeness and accuracy of the
information contained in this documentation, it is provided “as is” without warranty of any kind, express or implied. In addi tion, this information is based on IBM’s
current product plans and strategy, which are subject to change by IBM without notice. IBM shall not be responsible for any damages arising out of the use of, or
otherwise related to, this documentation or any other documentation. Nothing contained in this documentation is intended to, nor shall have the effect of, creating
any warranties or representations from IBM (or its suppliers or licensors), or altering the terms and conditions of the applicable license agreement governing the use of
IBM software.
References in these materials to IBM products, programs, or services do not imply that they will be available in all countries in which IBM operates. Product release
dates and/or capabilities referenced in these materials may change at any time at IBM’s sole discretion based on market opportunities or other factors and are not
intended to be a commitment to future product or feature availability in any way.
No other publication, distribution or use is permitted without the prior written consent of IBM. Customers who want a "deep drill down" on IBM IT Economics
assessments should be directed to the IBM IT Economics Research & Consulting team under NDA. An NDA is required to explain IBM IT Economics methodologies,
processes and competitive comparison. You can contact the IBM IT Economics team by sending an email to it.economics@us.ibm.com
28036328-USEN-03
9
IBM IT Economics Consulting & Research © 2021 IBM CorporationYou can also read