Vulcan Energy Resources - Leeway
←
→
Page content transcription
If your browser does not render page correctly, please read the page content below

Vulcan Energy Resources
Australia | Basic Materials | MCap AUD 1,649.1m
11 August 2021                                                                               UPDATE

Li marketing started &                                                                        BUY (BUY)

broader access to                                                                             Target price
                                                                                              Current price
                                                                                              Up/downside
                                                                                                                        AUD 19.50 (16.50)
                                                                                                                        AUD 15.21
                                                                                                                        28.2%

institutional funds
What’s it all about?
The Australian exploration company Vulcan Energy Resources Ltd. has been on target
for becoming a leading supplier of battery grade lithium hydroxide, a material central to
vehicle electrification strategies of the automotive industry. Operations of extraction in
the lithium-rich geothermal brine of the Upper Rhine Valley in southern Germany and of
upgrading lithium to a high purity hydroxide (LiOH) will be combined with the production
of hydrogeothermal energy (renewable electricity). With a CO 2 footprint of "zero", the
project is predestined to mark the beginning of the decarbonization of the battery
industry. LG Energy Solution has secured annual supplies of up to 10 thousand t LiOH.
The strategic partnership of Renault Group and Vulcan Energy comprises a purchase
                                                                                              MAIN AUTHOR
agreement of up to 17 thousand t LiOH annually.
                                                                                              Oliver Drebing
Vulcan Energy provides a rare opportunity to benefit from the strongly growing lithium        o.drebing@alsterresearch.com
growth trajectory and, by the same token, to participate in a project directly located in     +4940309293-57
Germany, a heartland of automotive industry. Based on increasing prices of Li, we
upgrade estimates and increase PT to AUD 19.50 (old: AUD 16.50), new PT equivalent
to EUR 12.20, and reiterate our BUY recommendation. Upside 28%.

IMPORTANT. Please refer to the last page of this report for “Important disclosures”           alsterresearch.com
and analyst(s) certifications.                                                                This research is the product of AlsterResearch, which is authorized
                                                                                              and regulated by the BaFin in Germany.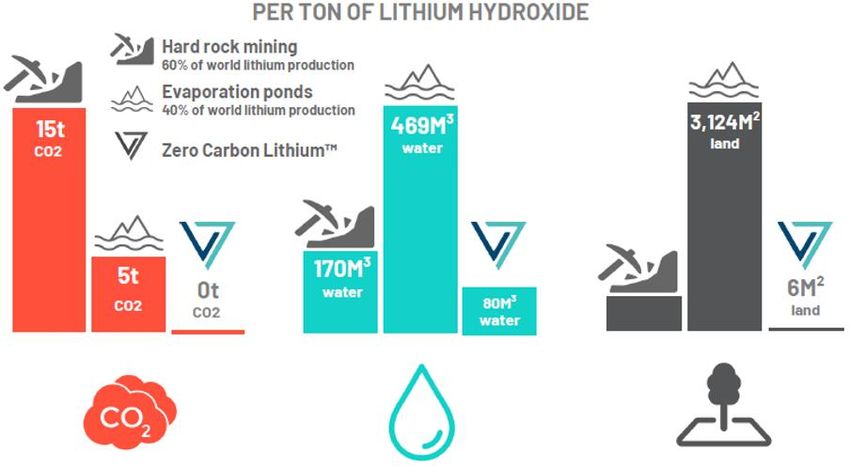
AlsterResearch
Page 2 of 20

Vulcan Energy Resources
Australia | Basic Materials | MCap AUD 1,649.1m | EV AUD 1,358.3m
                                          Target price      AUD 19.50 (16.50)               MAIN AUTHOR
BUY (BUY)                                                                                   Oliver Drebing
                                          Current price     AUD 15.21
                                          Up/downside       28.2%                           o.drebing@alsterresearch.com
                                                                                            +4940309293-57

Li marketing started & broader access to institutional funds
Vulcan has evolved to be the benchmark and thus preferred partner for stakeholders
to promote lithium production in Germany (car / battery industry, electricity utilities).
By assembling experts of geothermal engineering, process technology, battery
industry and various aspects of renewable/sustainable businesses, its competence
and network are unique. In July, LG Energy Solution secured annual supplies of up to
10 thousand t LiOH from Vulcan. The strategic partnership of Renault Group and
Vulcan Energy, announced in August, comprises a purchase agreement of up to 17
thousand t LiOH annually. Vulcan’s pilot plant has been operating, using live               Source: Company data, AlsterResearch
geothermal brine from existing wells for Direct Lithium Extraction and brine chemistry
test work. Ample cash (position end of June 2021: AUD 114.7m) gives the additional          High/low 52 weeks                       15.31 / 00.52
leeway with which the management is able to act opportunistically, thus to accelerate       Price/Book Ratio                                 4.3x
the process further.
                                                                                            Ticker / Symbols
With completion of the listing process, by the first half of 2022, trading of Vulcan        ISIN                                   AU0000066086
shares on the Frankfurt Stock Exchange will have elevated from open market into             WKN                                         A2PV3A
regulated market (Prime Standard). This will broaden access to institutional funds.         Bloomberg                                    VUL:AU
Vulcan has also started sounding out for a separate listing of its German operations
(Vulcan Energie Ressourcen). Experienced chemicals executive Markus Ritzauer will           Changes in estimates
be CFO of Vulcan’s German operations, effective from 1 September. Already spun-off                                         Sales     EBIT        EPS
into its subsidiary Kuniko are Vulcan’s non-core battery metals assets located in            2022         old               00.0       -7.8     -0.04
Norway. Expected date for quotation of Kuniko on ASX is 23 August. Advancement of                         ∆                    –          –         –
                                                                                             2023         old               00.0     -10.0      -0.20
the Zero Carbon Lithium™ Project is not dependent on securing further external funds
                                                                                                          ∆                    –          –         –
before the stage is set for the final investment decision (FID).                             2024         old               31.8      11.9      -0.16
                                                                                                          ∆                 5.3%    14.2%        n.m.
Vulcan Energy provides the prospect of lithium-ion batteries “made in Germany” that
enable automakers to comply with climate targets. Thus investors have the rare              Key share data
opportunity to benefit from the lithium growth trajectory and, by the same token, to        Number of shares: (in m pcs)                      108.42
participate in a project located in Germany. Based on increasing prices of Li, we           Book value per share: (in AUD)                      3.50
upgrade estimates and increase PT to AUD 19.50 (old: AUD 16.50), new PT                     Ø trading volume: (12 months)                     40,000
equivalent to EUR 12.20, and reiterate our BUY recommendation.
                                                                                            Major shareholders
 Vulcan Energy                                                                              F. Wedin                                          12.1%
                           2020     2021E       2022E       2023E       2024E      2025E
 Resources in AUDm                                                                          HPPL Group (G. Rinehart)                           6.7%
 Sales                        0.0        0.0         0.0          0.0       33.5    245.4   G. Rezos                                           5.6%
 Growth yoy                    na         na          na           na    >100%     632.9%   J.L. Hancock                                       5.0%
 EBITDA                      -3.3       -4.2        -7.6         -2.7       50.9    254.1   Free Float                                        69.1%
 EBIT                        -3.6       -4.4        -7.8       -10.0        13.6    177.5
 Net profit                  -3.6       -3.0        -5.1       -26.9       -23.7     91.1   Company description
 Net debt (net cash)         -6.4   -114.7      -290.8      -379.7          19.9    385.9   The Australian exploration company
 Net debt/EBITDA            1.9x     27.4x       38.3x      140.4x          0.4x     1.5x   Vulcan Energy Resources Ltd. has been
 EPS recurring             -0.07      -0.03       -0.04        -0.20       -0.16     0.58   developing a project in the Upper Rhine
 DPS                        0.00       0.00        0.00         0.00        0.00     0.00   Valley in Germany that combines the
 Dividend yield            0.0%       0.0%        0.0%         0.0%        0.0%      0.0%   use of thermal water as an energy
 Gross profit margin           na         na          na           na    70.6%      76.4%   source (hydrogeothermal energy) with
 EBITDA margin                 na         na          na           na   151.9%     103.5%   the extraction of the lithium contained in
 EBIT margin                   na         na          na           na    40.8%      72.3%
                                                                                            the geothermal brine without polluting
 ROCE                    -40.5%      -3.6%       -2.0%        -0.6%        0.6%      6.9%
                                                                                            the environment with emissions, waste
 EV/EBITDA              -495.9x    -366.5x     -179.1x     -469.4x        32.8x      8.0x
 EV/EBIT                -456.5x    -347.5x     -175.0x     -126.9x      122.3x      11.5x
                                                                                            material or toxic substances. With a CO2
 PER                    -206.4x    -546.8x     -338.8x       -74.9x      -96.6x     26.4x   footprint of "zero", the project is
 FCF yield                -0.2%      -0.2%       -0.3%        -1.3%       -1.2%      3.3%   predestined to mark the beginning of the
 Source: Company data, AlsterResearch                                                       decarbonization of the battery industry.
                                                                                            End of financial year: 30. June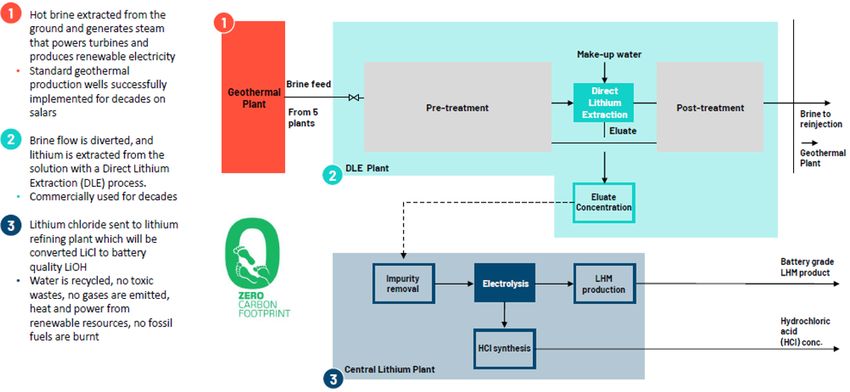
AlsterResearch
Page 3 of 20
Investment case in six charts
Germany: Electric Vehicles (EV) & Battery Electric Vehicles World market: Lithium demand
World market in thousands of tons of LCE
in thousand private vehicles and percentage of all new private vehicles
Jan 20 - Jul 21
1,000 1,000 50%
75 Demand (consumption plus stockpiling due to lead time)
40.1%
40%
Growth rate 800
60 800 40%
28.4%
26.6% 39%
22.0% 30%
45 650
21.7%
17.6% 17.4% 15.6% 600 30%
15.9% 500
20% 30%
30 14.0% 12.2%
11.4%
23% 425
8.6% 25%
3.0% 400 23% 20%
15 10%
298 305
270 18%
220
0 0% 198 10%
200 175 10%
01/2020 03/2020 05/2020 07/2020 09/2020 11/2020 01/2021 03/2021 05/2021 07/2021
11%
2%
new EV in Germany, BEV und PHEV (Plug-In-Hybrid Electric Vehicles)
new BEV (Battery Electric Vehicles) in Germany 0 0%
%-share of EV & all Hybrid, incl. Range Extended EV, new Cars
%-share of EV, new Cars 2015 2016 2017 2018 2019 2020 2021e 2022e 2023e 2024e 2025e
%-share of BEV, new Cars
Source: Kraftfahrtbundesamt Source: Albemarle (graphic December 2019), Austral. Gov. (Resources and Energy Quarterly Sep 18 to Mar
21), Data processing: SRH AlsterResearch
World market: Structure of Li supply Environmental Footprint
Source: Albemarle (graphic December 2019), Note on VUL/Vulcan Energy Resources: SRH AlsterResearch Source: Vulcan Energy Resources
Europe: Lithium-ion battery cell factories Pricing performance Lithium
30
26.2
Li carbonate battery grade (China ex works) thousand
USD/t
Li hydroxide battery grade (China ex works) thousand
20 USD/t
13.7
10
5.6
0
6/17
9/17
12/17
3/18
6/18
9/18
12/18
3/19
6/19
9/19
12/19
3/20
6/20
9/20
12/20
3/21
6/21
Source: Fraunhofer ISI (January 2020) Source: Deutsche Rohstoffagentur (Preismonitor, data LC prices), Data processing LiOH prices: SRH AlsterResearchAlsterResearch
Page 4 of 20
Company background
Product
Battery grade lithium hydroxide from brine sources in Germany – the Australian
exploration company has been on target for becoming a leading supplier of a
material that is central to vehicle electrification strategies of the automotive
industry.
Vulcan’s Zero Carbon LithiumTM Project – it rather is a portfolio of projects than just
one single – combines operations of extraction in the lithium-rich geothermal brine
of the Upper Rhine Valley, of upgrading lithium to a high purity hydroxide (LiOH) as
well as the production of hydrogeothermal energy (renewable electricity). Thermal
water will be used as energy source, and thus the extraction of lithium contained in
the brine will run without polluting the environment with emissions, waste material
or toxic substances. With a CO2 footprint of "zero", the project is predestined to mark
the beginning of the decarbonization of the battery industry.
In Vulcan's project areas, a staged development will implement a process
technology proven effective for more than 20 years in industrial lithium carbonate
production, which is known as Direct Lithium Extraction (DLE). Vulcan’s first DLE
pilot plant has been operating (announced in April 2021), using live geothermal brine
from existing wells. Vulcan is partnering with DuPont Water Solutions to assist
Vulcan with input and brine chemistry test work during the project’s Definitive
Feasibility Study (DFS).
Estimated resources of Vulcan’s Upper Rhine Valley Project have reached a total of
approx. 15.85 million t LCE in JORC-compliant terms (Inferred and Indicated Mineral
Resource, probable Mineral Reserve: 1.12 million t LCE). A portion of 3.62 million t
LCE has been classified as Indicated status. This puts Vulcan Energy Resources at
the very top of the rankings for the peer group of exploration projects in Europe – all
of which are based on hard rock deposits.
Upper Rhine Valley resource estimate
(*)
MoU Area Taro Taro Ortenau Ortenau Upper Rhine Valley
indicated indicated inferred indicated inferred indicated + inferred
3
Total Volume of Brine Aquifer km 8,322 8,419 15,924 17,001 117,974
Average Porositiy 9.000 10.227 9.400 12.600 9.500
Average concentration mg/l 181 181 181 181 181
total elemental Li mg 13,556,538 15,584,136 27,092,171 38,772,481 202,856,293
total elemental Li kt 136 156 271 388 2,029
Lithium carbonate - LCE kt 722 830 1,442 2,064 10,798 15,855
thereof indicated kt 722 830 2,064 3,615
inferred kt 1,442 10,798 12,240
Lithium hydroxide kt 820 942 1,638 2,344 12,264 18,007
Lithiumoxid kt 292 336 583 835 4,367 6,413
(*) MoU with German geothermal operators
Sources: Vulcan Energy Resources, SRH AlsterResearch
Lithium-ion batteries are classified based on the composition of the cathode and
anode material used. Market-ready innovations in nickel-cobalt-manganese
cathodes, in short: NMC cathodes, currently determine the market momentum.
Within this group, low-cost nickel that is readily available in good quantities (here:
"N") is replacing manganese (here: "M") and cobalt (here: “C”) to a large extent
Whereas the ratio of the first NMC generation was 1:1:1 (NMC 111), the new NMC
622 cathode generation is currently proving increasingly popular. Technically, this
requires the use of lithium hydroxide (LiOH) instead of lithium carbonate (Li2CO3),
insofar as cathode synthesis using lithium carbonate requires high temperatures,
which in turn are incompatible with a nickel content of 60% and above (vs. 40%
cobalt and manganese). Furthermore, the energy density (or specific energy, energy
per mass) of lithium hydroxide exceeds that of lithium carbonate. According toAlsterResearch
Page 5 of 20
Albemarle's estimate, LiOH production from hard rock deposits will have increased
tenfold by 2025 and will account for 80% of lithium production from hard rock
deposits (2019: 35%). LiOH production from brine is forecast to treble, meaning that
its share of lithium production from brine will remain at 20%.
Due to the Pre-Feasibility Study (PFS), Vulcan’s project reaches unparalleled
dimension with an envisaged annual LiOH-production target of 39.4 thousand t
(34.7 thousand t LCE p.a.).
Volume yield estimate Upper Rhine Valley (Taro, Ortenau)
Taro North (B1) Taro South (B2) Ortenau (C1) Ortenau (C2, C3) Taro & Ortenau
number of wells (doublets) 3 2 3 6 14
Flow rate per well 3 3,153,600 3,784,320 3,153,600 3,153,600
m /a
l/d 8,640,000 10,368,000 8,640,000 8,640,000
Approach: 8,760 h/anno l/h 360,000 432,000 360,000 360,000
l/s 100.000 120.000 100.000 100.000
average concentration mg/l 181 181 181 181
Day factor (7,842 h of 8,760 h) 0.90 0.90 0.90 0.90
DLE plant recovery 0.90 0.90 0.90 0.90
Lithium refinery plant recovery 0.99 0.99 0.99 0.99
Share VUL mg/l 100% 100% 100% 100%
Li/s mg 43,126 34,501 43,126 86,253
Li/h kg 155.25 124.20 155.25 310.51
Li/d kg 3,726 2,981 3,726 7,452
Li/a kg 1,360,031 1,088,025 1,360,031 2,720,063
Li/a t 1,360 1,088 1,360 2,720 6,528
Lithium carbonate LCE/a t 7,239 5,791 7,239 14,478 34,748
Lithium hydroxide/a t 8,222 6,578 8,222 16,444 39,466
Source: SRH AlsterResearch
Simplified image of Zero Carbon LithiumTM Process
Growth
Advancement of the Zero Carbon LithiumTM Project is not dependent on securing
further external funds before the stage is set for the final investment decision (FID),
a juncture by which risk related discounts will have eased significantly. Even more,
ample size of institutional funds (cash position end of March 2021: AUD 117.4m,
around USD 91m) gives the additional leeway with which the management is now
able to act opportunistically, also to attract the ambitious and competent
professionals the project will need, and thus to accelerate the process further.AlsterResearch Page 6 of 20 Vulcan has grown through acquisitions of German geothermal consultancy and engineering businesses and, in summer of 2021, has an unparalleled surface and sub-surface geothermal development team in house (about 40 people) to execute deep geothermal projects. The agreement to acquire 100% of consultancy company GeoT (GeoThermal Engineering), Karlsruhe, was signed in February 2021. GeoT has been established and led to a world-leading consultancy for deep geothermal energy projects by Dr Horst Kreuter. 12 team members of GeoT will have joined Vulcan, forming the core of its energy business development team together with 25 team members of gec-co. The acquisition of geothermal surface company gec-co (Global Engineering Consulting-Company) with technical teams in Augsburg, Bremen and Karlsruhe was announced in April 2021. gec-co has been focused on surface installations and drilling for electricity and heating plant projects in the deep thermal energy sector, involving profound experience in mechanical engineering (energy, environmental, process technology). gec-co supports investors, local authorities and clients throughout permitting, construction and operating phase. Both companies allow Vulcan While Dr Horst Kreuter will coordinate public affairs and public relations of the Zero Carbon LithiumTM project, Thorsten Weimann, founder and managing director of gec-co, will be Chief Operating Officer of Vulcan in Germany, responsible for the combined geothermal energy and lithium operations. Vulcan’s in-house team for the development of lithium operations, comprising DLE (Direct Lithium Extraction) as well as the conversion of lithium chloride to lithium hydroxide in the Central Lithium Plant, currently consists of 8 world-leading experts of lithium chemistry and chemical engineering. Besides counting on its in-house expertise, Vulcan is collaborating with DuPont Water Solutions to test DLE solutions similar to those commercially mature products which are already used in lithium industry. DuPont has several DLE products and assists Vulcan with input and test work during Vulcan’s Zero Carbon LithiumTM project DFS. Implemented by a team of its engineers, DuPont has granted access to equipment and material (e.g. resin) at Vulcan’s first pilot plant. This input is made available at no cost to Vulcan provided the parties enter into a supply agreement for DLE products following the completion of the DFS. Customers Major automotive producing countries have to ramp up battery cell factory capacity within the coming years. The battery comprises as much as 30% to 40% of the vehicle cost. Ensuring that the demand for lithium-ion accumulators for the automotive industry is covered is a matter that has been assigned a high level of priority throughout Europe. Industrial policy ambitions are therefore aimed at establishing a consistently European supply chain. In Germany alone, there are plans to make investments running into the billions in factory complexes for battery cell production. In addition, industrial policy initiatives include the mining of the raw material lithium – which never occurs as a pure element in nature due to its high reactivity – and the processing of the ores/brines. The need for electric drive systems to have a tolerable carbon footprint in the production phase, too, is a key aspect, and one that has the very highest priority. The supply security argument is also a top priority. For industrial and security policy reasons, Europe has to manage to break away from its current 100% reliance on raw material supplies from South America or Asia. The Fraunhofer-Gesellschaft estimates European battery cell production to reach a capacity of 396 GWh/a by 2025 and of 576 GWh by 2030 (publication January 2020). Even higher capacity growth is expected by Ultima Media (part of Süddeutscher Verlag, publication March 2021). Ultima Media predicts that Europe will more than double its plant capacity share from 13% in 2020 to 33% by 2030 and reach a capacity of 950 GWh/a, while capacity in Asia is expected to rise to 1,620 GWh/a (projected share of capacity worldwide: 57%).
AlsterResearch
Page 7 of 20

In July 2021, LG Energy Solution secured annual supplies of up to 10 thousand t
LiOH from Vulcan. LG Energy Solution is the largest producer of lithium-ion batteries
for electric vehicles in the world and supplies its products to top global OEMs. The
strategic partnership of Renault Group and Vulcan Energy, announced in August,
comprises a purchase agreement of up to 17 thousand t LiOH annually.

Competition

Particularly in the south-west of Australia, the mineral spodumene (LiAlSi2O6) is
mined from hard rock deposits in the region’s pegmatite fields (pegmatites belong
to the group of magmatic dyke rocks). The majority of the quantities extracted are
shipped as concentrate for processing to China, where they cover 75% of the
country's lithium requirements; only China has the infrastructure required to break
large quantities of concentrate down using metallurgical processes. Established
production processes initially produce lithium carbonate (Li 2CO3). Lithium
carbonate is the feedstock used for the production of lithium hydroxide (LiOH), and
also for the production of other intermediates such as lithium chloride (LiCl).
Processing in the battery industry requires lithium carbonate purities of 99.5% or
more. The conversion factor LCE (Lithium Carbonate Equivalent), which is common
in international trade, refers to lithium carbonate.

Even more significant on a global scale are the deposits of the light metal lithium in
salt lakes in South America ("Lithium Triangle" in the Argentina-Bolivia-Chile border
region), North America (Nevada, Utah, Searless Lake and Salton Sea/California) and
China (Tibetan Plateau). Lithium carbonate and lithium hydroxide is produced from
lithium chloride which is extracted from the brines.

Other lithium deposits in Europe are hard rock deposits in pegmatite fields
containing spodumene, or in which lithium is bound in certain mixed crystals, such
as zinnwaldite and other mica. Another approach to lithium mining in Europe is the
mining of the mineral jadarite. The drawback regarding the extraction of lithium from
spodumene mined in Europe will be the fact that the concentrate will first of all have
to be transported for processing to China's large-scale spodumene conversion
plants – a considerable disadvantage in view of the climate policy benefits of
electromobility. There has been no industrial capacity for processing zinnwaldite to
date.

Various cost advantages owing to geological factors point to the economic viability
of Vulcan’s lithium project in the Upper Rhine Valley; in addition to the lithium
content and a high flow/production rate achieved there, the energy required for the
extraction process is significantly lower thanks to what is already a high starting
temperature of over 120°C. The most important aspect, however, which also
combines cost-effectiveness considerations with the aspect of minimising the
"footprint" in terms of the environmental impact, is the immediate proximity to
industrial customers. The transportation distance of a few hundred kilometres to
existing or planned battery factories and the industrial mobility cluster in the south-
west of Germany is a decisive argument that helps to underpin the advantages of
Vulcan’s battery grade lithium associated with the carbon footprint of the electric
drive versus the combustion engine. From 2026, EU regulation requires that lithium-
ion batteries will have to bear a carbon intensity performance class label and from
July 2027, must comply with maximum carbon footprint thresholds.

Key shareholders
                                                                   shares     % of issued
                                                                  (million)       capital
 Dr Francis Wedin             Managing Director & Founder, CEO       13.01         12.0%

 Hancock Prospecting Pty Ltd and Georgina Hope Rinehart               7.24          6.7%

 Gavin Rezos                  Chair                                   6.03          5.6%
 John Langley Hancock                                                 5.38          5.0%
 BNP Energy Transition Fund                                           1.54          1.4%
AlsterResearch
Page 8 of 20
Board
Dr Francis Wedin, Managing Director & Founder – CEO
Founder of Vulcan Zero Carbon LithiumTM Project, lithium industry
executive since 2014. Three discoveries of JORC Lithium Resources on two
continents
Gavin Rezos, Chair
Executive Chair/CEO of two ASX 300-companies. Investment banking
Director of HSBC
Dr Horst Kreuter, Board Advisor
Co-Founder of Vulcan Zero Carbon LithiumTM Project, successful
geothermal project development and permitting in Germany and worldwide
being CEO of Geothermal Group and GeoThermal Engineering (GeoT)
Annie Liu, Non-Executive Director
Battery expert. Former Tesla Head of Battery and Energy Supply Chain
Dr Heidi Grön, Non-Executive Director
Chemical engineer, since 2007 senior executive with Evonik, responsible
for Global product safety, impact assessment and strategy development
for sustainability as part of the EU Green Deal and management of Evonik’s
major investments
Josephine Bush, Non-Executive Director
Expert Renewable/Sustainable Businesses. Member of the EY Power and
Utilities Board. Former senior EY Global Renewables Partner
Ranya Alkadamani, Non-Executive Director
Communications strategist, Founder of Impact Group International
Julia Poliscanova – Board Advisor
Electromobility expert, member of the board of the Global Battery Alliance
Rob Ierace, CFO
Chartered Accountant and Chartered Secretary with over 20 years of
experience
Daniel Tydde, Company Secretary & In-House Legal Counsel
Corporate lawyer, experienced in corporate, commercial and finance areas,
including IPO’s, equity and debt capital raisings, regulatory compliance,
corporate governance et al.
Key Executives
Thorsten Weimann – Chief Operating Officer in Germany
Managing director of gec-co Global Engineering Consulting-Company,
expert in geothermal and drilling technology, with more than 25 years of
professional experience.
Dr Stephen Harrison – Chief Technical Operating
Diverse multi-industry background in electrochemistry and lithium
extraction, as CTO of Simbol Materials led to develop a process to extract
lithium from geothermal brine, recognised as lowest cost production
method to lithium hydroxide. CEO of Rakehill Technology, consulted
industry on various lithium extraction technologies
Vincent Ledoux Pedailles – Vice President – Business Development
Previously Executive Director at Infinity, also worked at IHS Markit, where
he led the lithium and battery materials research teamAlsterResearch
Page 9 of 20
SWOT Analysis
Strength
• Location: Close proximity to the European battery industry which is
currently being established, short transportation distance (carbon
footprint, 1st aspect)
• Largest JORC-compliant lithium resource in Europe (Inferred and Indicated
Mineral Resource)
• Carbon footprint, 2nd aspect: Lithium production using geothermal energy,
without polluting the environment with emissions, waste material or toxic
substances.
• Cash position of close to AUD 114 million sufficient for accelerated project
development, including extensive test work and development of pilot
plants. Advancement of the Zero Carbon LithiumTM Project is not
dependent on securing further external funds before the stage is set for the
final investment decision (FID), a juncture by which risk related discounts
will have eased significantly.
• Lithium is separated within a matter of hours, eliminating external
interference factors
• Lithium marketing has started: LG Energy Solution has secured annual
supplies of up to 10 thousand t LiOH from Vulcan, and the strategic
partnership of Renault Group and Vulcan Energy comprises a purchase
agreement of up to 17 thousand t LiOH annually.
Weaknesses
• Further funds required for project implementation have yet to be raised
• Investment lead time will take more than two years
Opportunities
• Headstart in the race to commercialize Lithium within Central Europe:
Preliminary Feasibility Study (PFS) brings about the leading and – for the
time being – a unique position
• Rapid growth in lithium demand among the European battery industry
• Contribution to an independent European lithium supply chain (supply
aspect, short transportation distances) creates an incentive for the battery
industry to pay a premium over the lithium reference price
• Low-cost asset: Opportunity for operating costs at the lower end/in the
lower quartile of the global peer group cost curve
• Income from electricity feed-in as a second source of revenue besides
lithium sales
Threats
• The reference price for lithium based on imports in China/Korea/ Japan
could come under pressure – as occurred in 2018 and 2019 – and put a
damper on investor sentiment
• Approval procedures, in particular legal action against authorisations
granted, could delay implementationAlsterResearch
Page 10 of 20
Valuation
By using a 40% risk weighting on Equity value, we set our price target at AUD 19.50
per share.
Key model assumptions:
• WACC. We model a weighted average cost of capital of 8.5%, consisting of
a 6.0% risk premium beta of 1.1x and 2.0% risk free rate.
• The forecast model is based on revenues at USD 16.90 thousand/t for
lithium hydroxide, which encompasses a potential price premium to
reference prices (25%). Our former model had been based on revenues of
USD 15.95 thousand/t for LiOH.
DCF (AUD m) Terminal
2021E 2022E 2023E 2024E 2025E 2026E 2027E 2028E
(except per share data and beta) value
NOPAT -3.9 -5.4 -7.0 9.6 124.3 355.3 532.0 625.4
Depreciation & Amort. 0.2 0.2 7.3 37.2 76.5 96.8 111.3 111.3
Change in working capital -0.1 0.0 0.0 -5.2 -18.3 -28.6 -19.3 -9.3
Chg. in long-term provisions 0.0 0.0 0.0 0.0 0.0 0.0 0.0 0.0
Capex -7.0 -96.5 -607.6 -1,017.0 -515.4 -108.4 -108.4 -108.4
Cash flow -10.8 -101.7 -607.3 -975.4 -332.8 315.0 515.5 618.9 9,676.7
Present value -10.9 -94.7 -521.1 -771.0 -242.5 211.6 319.1 353.1 5,509.7
WACC 8.4% 8.4% 8.5% 8.5% 8.5% 8.5% 8.5% 8.5% 8.5%
DCF per share derived from DCF avg. growth and earnings assumptions
Planning horizon avg. revenue growth (2021E - 2028E) n.a.%
Total present value 4,753.4 Terminal value growth (2028E - infinity) 2.0%
Mid-year adj. total present value 4,950.6 Terminal year ROCE 24.3%
Net debt / cash at start of year -114.7 Terminal year WACC 8.5%
Financial assets 2.6
Provisions and off b/s debt na Terminal WACC derived from
Equity value 5,067.9 Cost of borrowing (before taxes) 6.0%
No. of shares outstanding 158.3 Long-term tax rate 25.0%
Equity beta 1.10
Discounted cash flow / share 19.50 Unlevered beta (industry or company) 1.07
upside/(downside) 28.2% Target debt / equity 0.2
Relevered beta 1.19
Risk-free rate 2.0%
Equity risk premium 6.0%
Share price 15.21 Cost of equity 9.2%
Sensitivity analysis DCF
Long term growth Share of present value
0.0% 1.0% 2.0% 3.0% 4.0%
Change in WACC
2.0% 9.4 10.8 12.5 14.6 17.4 2021E - 2024E -29.4%
1.0% 11.5 13.2 15.5 18.4 22.4 2025E - 2028E 13.5%
(%-points)
0.0% 14.1 16.4 19.5 23.7 29.7 terminal value 115.9%
-1.0% 17.4 20.7 25.1 31.4 41.4
-2.0% 21.9 26.5 33.2 43.7 62.4
Source: AlsterResearchAlsterResearch
Page 11 of 20
• A cash position of close to AUD 114 million (just over USD 84 million) is
sufficient for accelerated project development in 2021 and beyond. AUD
50m (around USD 40m) will be used for project development, for permitting
and feasibility study costs (completion of Definitive Feasibility Study
scheduled for mid-2022). This includes extensive text work and the
development of pilot plants. AUD 30m (around USD 25m) will be allocated
for land access costs and the purchase of long lead drilling items in
Germany. Following the ramp-up phase (2022 to 2025), which will be
characterized by high capex, with a five-year payback period, we have
modelled surpluses in operational cash inflows until 2027e which would
cover capex of USD 1,865 million (AUD 2,400 million).
• By discounting our modelled cash flow projection, we have derived the
appropriate enterprise value (NPV) at AUD 4,753 million (mid-year
adjusted: AUD 4,951 million) and the equity value at AUD 5,068 million. We
then have put a 40% risk weighting on our valuation (ex net cash).
• The project’s advancement is not dependent on securing further external
funds before the stage is set for the final investment decision (FID), a
juncture by which risk related discounts will have eased significantly. Then,
further fundraising remains a key aspect of the implementation of the
Upper Rhine Valley project.
• Assuming further dilution (max. number of shares in our model: 158.3
million), which will occur in the course of the process involved in raising
the additional equity required, we derive AUD 32.00 (or EUR 20.00) as a
“fair” value per share based on the discounting model. At this juncture
(August 2021), we have used a risk related discount of 0.40x (Equity value
ex net cash), which has brought us to an appropriate valuation per share of
AUD 19.50 (or EUR 12.20). Valuation of such a project (or even a portfolio
of projects) is not exact science, let there be the possibility of a delayed
implementation in course of approval procedures, in particular legal action.
• Two geothermal engineering companies that were acquired, GeoT
(announced February 2021) and gec-co (April 2021), are already generating
revenues with external customers. For now, our model omits this cash
contribution.
• Our cash flow projection ends 2054e.
Source: AlsterResearchAlsterResearch
Page 12 of 20
Due to the fact that companies rarely bear sufficient resemblance to peers in terms
of geographical exposure, size or competitive strength and in order to adjust for the
pitfalls of weak long-term visibility, an Adjusted Free Cash Flow analysis (Adjusted
FCF) has been conducted.
The adjusted Free Cash Flow Yield results in a fair value of AUD 15.90 per share
based on 2025 estimates. Hence, our DCF based fair value calculation is supported
by our FCF yield methodology.
The main driver of this model is the level of return available to a controlling investor,
influenced by the cost of that investors’ capital (opportunity costs) and the purchase
price – in this case the enterprise value of the company. Here, the adjusted FCF yield
is used as a proxy for the required return and is defined as EBITDA less minority
interest, taxes and investments required to maintain existing assets (maintenance
capex).
FCF yield in AUD m 2021E 2022E 2023E 2024E 2025E
EBITDA -4.2 -7.6 -2.7 50.9 254.1
- Maintenance capex 0.2 0.2 5.9 35.8 70.0
- Minorities 0.0 0.0 0.0 0.0 0.0
- tax expenses -0.4 -2.2 -11.5 -10.1 39.0
= Adjusted Free Cash Flow -4.0 -5.6 2.9 25.2 145.1
Actual Market Cap 1,649.1 1,649.1 1,649.1 1,649.1 1,649.1
+ Net debt (cash) -114.7 -290.8 -379.7 19.9 385.9
+ Pension provisions 0.0 0.0 0.0 0.0 0.0
+ Off B/S financing 0.0 0.0 0.0 0.0 0.0
- Financial assets 2.6 2.6 2.6 2.6 2.6
- Acc. dividend payments 0.0 0.0 0.0 0.0 0.0
EV Reconciliations -117.3 -293.3 -382.2 17.3 383.3
= Actual EV' 1,531.8 1,355.8 1,266.9 1,666.4 2,032.4
Adjusted RW_FCF yield -0.3% -0.4% 0.2% 1.5% 7.1%
base hurdle rate 6.0% 6.0% 6.0% 6.0% 6.0%
ESG adjustment 1.0% 1.0% 1.0% 1.0% 1.0%
adjusted hurdle rate 5.0% 5.0% 5.0% 5.0% 5.0%
Fair EV -80.3 -111.7 58.8 503.7 2,901.3
- EV Reconciliations -117.3 -293.3 -382.2 17.3 383.3
Fair Market Cap 36.9 181.7 441.0 486.3 2,518.0
No. of shares (million) 108.4 113.2 132.5 150.3 158.3
Fair value per share in AUD 0.34 1.60 3.33 3.24 15.90
Premium (-) / discount (+) -97.8% -89.0% -73.3% -70.5% 52.7%
Sensitivity analysis FV
3.0% -0.2 0.9 3.6 5.5 28.1
Adjusted 4.0% 0.2 1.4 3.4 4.1 20.5
hurdle 5.0% 0.3 1.6 3.3 3.2 15.9
rate 6.0% 0.5 1.8 3.3 2.7 12.8
7.0% 0.6 1.9 3.2 2.3 10.7
Source: Company data; AlsterResearch
Simply put, the model assumes that investors require companies to generate a
minimum return on the investor’s purchase price. The required after-tax return
equals the model’s hurdle rate of 6%. Anything less suggests the stock is expensive;
anything more suggests the stock is cheap. ESG adjustments might be applicable,
based on the overall Leeway ESG Score. A high score indicates high awareness for
environmental, social or governance issues and thus might lower the overall risk
an investment in the company might carry. A low score on the contrary might
increase the risk of an investment and might therefore trigger a higher required
hurdle rate.AlsterResearch
Page 13 of 20
Financials in six charts
Sales vs. EBITDA margin development EPS, DPS in AUD & yoy EPS growth
250 180% 0,60 100%
160% 0,50 90%
200 140% 80%
0,40
120% 70%
150 0,30
100% 60%
0,20
80% 50%
100 0,10
60% 40%
0,00
50 40% 30%
19 20 21E 22E 23E 24E 25E
20% -0,10 20%
0 0% -0,20 10%
19 20 21E 22E 23E 24E 25E -0,30 0%
Sales (€m) EBITDA margin (%) EPS DPS EPS growth
ROCE vs. WACC (pre tax) Net debt and net debt/EBITDA
20% 600 2,50x
10% 500
0% 400 2,00x
19 20 21E 22E 23E 24E 25E
300
-10%
200 1,50x
-20%
100
-30%
0 1,00x
-40% 19 20 21E 22E 23E 24E 25E
-100
-50%
-200 0,50x
-60% -300
-70% -400 0,00x
ROCE WACC pre tax Net debt (€m) Net debt / EBITDA (x)
Capex & chgn in w/c requirements in AUDm Free Cash Flow in AUDm
1200 0
19 20 21E 22E 23E 24E 25E
1000 -200
800
-400
600
-600
400
-800
200
0 -1.000
19 20 21E 22E 23E 24E 25E
Capex Change in w/c
-1.200
Source: Company data; AlsterResearchAlsterResearch Page 14 of 20 Financials Profit and loss (EUR m) 2020 2021E 2022E 2023E 2024E 2025E Sales 0.0 0.0 0.0 0.0 33.5 245.4 Sales growth na na na na >100% 632.9% Cost of sales 0.0 0.0 0.0 0.0 9.8 57.9 Gross profit 0.0 0.0 0.0 0.0 23.6 187.5 SG&A expenses 3.4 4.8 7.8 10.0 10.0 10.0 Research and development 0.0 0.0 0.0 0.0 0.0 0.0 Other operating expenses (income) -0.1 -0.4 0.0 0.0 0.0 0.0 EBITDA -3.3 -4.2 -7.6 -2.7 50.9 254.1 Depreciation 0.3 0.2 0.2 5.9 35.8 75.2 EBITA -3.6 -4.4 -7.8 -8.6 15.0 178.9 Amortisation of goodwill and intangible assets 0.0 0.0 0.0 1.4 1.4 1.4 EBIT -3.6 -4.4 -7.8 -10.0 13.6 177.5 Financial result 0.0 1.0 0.5 -28.4 -47.5 -47.5 Recurring pretax income from continuing operations -3.6 -3.4 -7.3 -38.4 -33.8 130.1 Extraordinary income/loss 0.0 0.0 0.0 0.0 0.0 0.0 Earnings before taxes -3.6 -3.4 -7.3 -38.4 -33.8 130.1 Taxes 0.0 -0.4 -2.2 -11.5 -10.1 39.0 Net income from continuing operations -3.6 -3.0 -5.1 -26.9 -23.7 91.1 Result from discontinued operations (net of tax) 0.0 0.0 0.0 0.0 0.0 0.0 Net income -3.6 -3.0 -5.1 -26.9 -23.7 91.1 Minority interest 0.0 0.0 0.0 0.0 0.0 0.0 Net profit (reported) -3.6 -3.0 -5.1 -26.9 -23.7 91.1 Average number of shares 48.23 108.42 113.24 132.54 150.29 158.32 EPS reported -0.07 -0.03 -0.04 -0.20 -0.16 0.58 Profit and loss (common size) 2020 2021E 2022E 2023E 2024E 2025E Sales na na na na 100% 100% Cost of sales na na na na 29% 24% Gross profit na na na na 71% 76% SG&A expenses na na na na 30% 4% Research and development na na na na 0% 0% Other operating expenses (income) na na na na 0% 0% EBITDA na na na na 152% 104% Depreciation na na na na 107% 31% EBITA na na na na 45% 73% Amortisation of goodwill and intangible assets na na na na 4% 1% EBIT na na na na 41% 72% Financial result na na na na -142% -19% Recurring pretax income from continuing operations na na na na -101% 53% Extraordinary income/loss na na na na 0% 0% Earnings before taxes na na na na -101% 53% Taxes na na na na -30% 16% Net income from continuing operations na na na na -71% 37% Result from discontinued operations (net of tax) na na na na 0% 0% Net income na na na na -71% 37% Minority interest na na na na 0% 0% Net profit (reported) na na na na -71% 37% Source: Company data; AlsterResearch
AlsterResearch
Page 15 of 20

 Balance sheet (AUD m)                                       2020   2021E   2022E    2023E     2024E     2025E
 Intangible assets (exl. Goodwill)                            0.0     5.7     7.1      7.0        6.9       6.8
 Goodwill                                                     0.0     0.0     0.0      0.0        0.0       0.0
 Property, plant and equipment                                0.0     1.1    96.0    696.4    1,676.2   2,115.1
 Financial assets                                             2.6     2.6     2.6      2.6        2.6       2.6
 FIXED ASSETS                                                 2.6     9.4   105.6    706.0    1,685.7   2,124.5
 Inventories                                                  0.0     0.0     0.0      0.0        5.8      25.0
 Accounts receivable                                          0.1     0.0     0.0      0.0        1.4      10.1
 Other current assets                                         0.0     0.0     0.0      0.0        0.0       0.0
 Liquid assets                                                6.4   114.7   290.8    861.9      779.4     413.4
 Deferred taxes                                               0.0     0.0     0.0      0.0        0.0       0.0
 Deferred charges and prepaid expenses                        0.0     0.0     0.0      0.0        0.0       0.0
 CURRENT ASSETS                                               6.5   114.7   290.8    861.9     786.6     448.5
 TOTAL ASSETS                                                 9.1   124.1   396.4   1,567.9   2,472.3   2,573.0
 SHAREHOLDERS EQUITY                                          8.9   124.1   396.4   1,085.6   1,671.0   1,762.1
 MINORITY INTEREST                                            0.0     0.0     0.0       0.0       0.0       0.0
 Long-term debt                                               0.0     0.0     0.0     482.2     799.3     799.3
 Provisions for pensions and similar obligations              0.0     0.0     0.0       0.0       0.0       0.0
 Other provisions                                             0.0     0.0     0.0       0.0       0.0       0.0
 Non-current liabilities                                      0.0     0.0     0.0     482.2     799.3     799.3
 short-term liabilities to banks                              0.0     0.0     0.0       0.0       0.0       0.0
 Accounts payable                                             0.2     0.0     0.0       0.0       2.0      11.6
 Advance payments received on orders                          0.0     0.0     0.0       0.0       0.0       0.0
 Other liabilities (incl. from lease and rental contracts)    0.0     0.0     0.0       0.0       0.0       0.0
 Deferred taxes                                               0.0     0.0     0.0       0.0       0.0       0.0
 Deferred income                                              0.0     0.0     0.0       0.0       0.0       0.0
 Current liabilities                                          0.2     0.0     0.0       0.0       2.0     11.6
 TOTAL LIABILITIES AND SHAREHOLDERS EQUITY                    9.1   124.1   396.4   1,567.9   2,472.3   2,573.0

 Balance sheet (common size)                                 2020   2021E   2022E    2023E     2024E     2025E
 Intangible assets (excl. Goodwill)                           0%      5%      2%        0%        0%        0%
 Goodwill                                                     0%      0%      0%        0%        0%        0%
 Property, plant and equipment                                0%      1%     24%       44%       68%       82%
 Financial assets                                            28%      2%      1%        0%        0%        0%
 FIXED ASSETS                                                28%      8%     27%       45%       68%       83%
 Inventories                                                  0%      0%      0%        0%        0%        1%
 Accounts receivable                                          1%      0%      0%        0%        0%        0%
 Other current assets                                         0%      0%      0%        0%        0%        0%
 Liquid assets                                               71%     92%     73%       55%       32%       16%
 Deferred taxes                                               0%      0%      0%        0%        0%        0%
 Deferred charges and prepaid expenses                        0%      0%      0%        0%        0%        0%
 CURRENT ASSETS                                              72%     92%     73%       55%       32%       17%
 TOTAL ASSETS                                                100%   100%    100%     100%      100%      100%
 SHAREHOLDERS EQUITY                                         98%    100%    100%       69%       68%       68%
 MINORITY INTEREST                                            0%      0%      0%        0%        0%        0%
 Long-term debt                                               0%      0%      0%       31%       32%       31%
 Provisions for pensions and similar obligations              0%      0%      0%        0%        0%        0%
 Other provisions                                             0%      0%      0%        0%        0%        0%
 Non-current liabilities                                      0%      0%      0%       31%       32%       31%
 short-term liabilities to banks                              0%      0%      0%        0%        0%        0%
 Accounts payable                                             2%      0%      0%        0%        0%        0%
 Advance payments received on orders                          0%      0%      0%        0%        0%        0%
 Other liabilities (incl. from lease and rental contracts)    0%      0%      0%        0%        0%        0%
 Deferred taxes                                               0%      0%      0%        0%        0%        0%
 Deferred income                                              0%      0%      0%        0%        0%        0%
 Current liabilities                                          2%      0%      0%        0%        0%        0%
 TOTAL LIABILITIES AND SHAREHOLDERS EQUITY                   100%   100%    100%     100%      100%      100%
 Source: Company data; AlsterResearch
AlsterResearch
Page 16 of 20

 Cash flow statement (AUD m)                       2020    2021E     2022E      2023E       2024E       2025E
 Net profit/loss                                   -1.4       -3.0      -5.1      -26.9        -23.7       91.1
 Depreciation of fixed assets (incl. leases)        0.0        0.2       0.2        5.9         35.8       75.2
 Amortisation of goodwill                           0.0        0.0       0.0        0.0           0.0        0.0
 Amortisation of intangible assets                  0.0        0.0       0.0        1.4           1.4        1.4
 Others                                             0.1        0.0       0.0        0.0           0.0        0.0
 Cash flow from operations before changes in w/c   -1.3       -2.8      -4.9      -19.6         13.6     167.6
  Increase/decrease in inventory                    0.0        0.0       0.0        0.0          -5.8     -19.1
  Increase/decrease in accounts receivable          0.0        0.1       0.0        0.0          -1.4       -8.7
  Increase/decrease in accounts payable             0.0       -0.2       0.0        0.0           2.0        9.6
  Increase/decrease in other w/c positions          0.0        0.0       0.0        0.0           0.0        0.0
 Increase/decrease in working capital               0.0       -0.1       0.0        0.0          -5.2     -18.3
 Cash flow from operating activities               -1.3      -2.9       -4.9     -19.6            8.3    149.4
 CAPEX                                             -1.2       -7.0     -96.5    -607.6     -1,017.0     -515.4
 Payments for acquisitions                          0.0        0.0       0.0        0.0           0.0        0.0
 Financial investments                              0.0        0.0       0.0        0.0           0.0        0.0
 Income from asset disposals                        0.0        0.0       0.0        0.0           0.0        0.0
 Cash flow from investing activities               -1.2      -7.0     -96.5     -607.6    -1,017.0      -515.4
 Cash flow before financing                        -2.6       -9.9   -101.4     -627.2     -1,008.6     -366.0
 Increase/decrease in debt position                 0.0        0.0       0.0     482.2        317.1          0.0
 Purchase of own shares                             0.0        0.0       0.0        0.0           0.0        0.0
 Capital measures                                   5.6     118.2     277.5      716.1        609.1          0.0
 Dividends paid                                     0.0        0.0       0.0        0.0           0.0        0.0
 Others                                             0.0        0.0       0.0        0.0           0.0        0.0
 Effects of exchange rate changes on cash          -0.0        0.0       0.0        0.0           0.0        0.0
 Cash flow from financing activities                5.6     118.2     277.5    1,198.3        926.2          0.0
 Increase/decrease in liquid assets                 3.1     108.3     176.1      571.1         -82.5    -366.0
 Liquid assets at end of period                     6.4     114.7     290.8      861.9        779.4      413.4
 Source: Company data; AlsterResearch

 Regional sales split (AUDm)                       2020    2021E     2022E      2023E        2024E        2025E
 Domestic                                            0.0      0.0       0.0        0.0         33.5        245.4
 Europe (ex domestic)                                0.0      0.0       0.0        0.0          0.0          0.0
 The Americas                                        0.0      0.0       0.0        0.0          0.0          0.0
 Asia                                                0.0      0.0       0.0        0.0          0.0          0.0
 Rest of World                                       0.0      0.0       0.0        0.0          0.0          0.0
 Total sales                                         0.0      0.0       0.0        0.0         33.5        245.4

 Regional sales split (common size)                2020    2021E     2022E      2023E        2024E        2025E
 Domestic                                            na       na        na         na       100.0%       100.0%
 Europe (ex domestic)                                na       na        na         na          0.0%         0.0%
 The Americas                                        na       na        na         na          0.0%         0.0%
 Asia                                                na       na        na         na          0.0%         0.0%
 Rest of World                                       na       na        na         na          0.0%         0.0%
 Total sales                                         na       na        na         na         100%         100%
Source: Company data; AlsterResearch
AlsterResearch
Page 17 of 20

 Ratios                                   2020    2021E     2022E       2023E      2024E     2025E
 Per share data
 Earnings per share reported              -0.07     -0.03     -0.04      -0.20       -0.16     0.58
 Cash flow per share                      -0.03     -0.03     -0.04      -0.19       -0.18     0.50
 Book value per share                      0.18      1.14      3.50       8.19      11.12     11.13
 Dividend per share                        0.00      0.00      0.00       0.00        0.00     0.00
 Valuation
 P/E                                    -206.4x   -546.8x   -338.8x      -74.9x     -96.6x    26.4x
 P/CF                                   -453.3x   -528.3x   -338.8x      -79.1x     -83.1x    30.3x
 P/BV                                     82.5x     13.3x      4.3x        1.9x       1.4x     1.4x
 Dividend yield (%)                        0.0%      0.0%      0.0%        0.0%       0.0%     0.0%
 FCF yield (%)                            -0.2%     -0.2%     -0.3%       -1.3%      -1.2%     3.3%
 EV/Sales                                    na        na        na          na      49.8x     8.3x
 EV/EBITDA                              -495.9x   -366.5x   -179.1x    -469.4x       32.8x     8.0x
 EV/EBIT                                -456.5x   -347.5x   -175.0x    -126.9x     122.3x     11.5x
 Income statement (AUDm)
 Sales                                      0.0       0.0       0.0        0.0       33.5     245.4
 yoy chg in %                                na        na        na         na     >100%     632.9%
 Gross profit                               0.0       0.0       0.0        0.0       23.6     187.5
 Gross margin in %                           na        na        na         na     70.6%      76.4%
 EBITDA                                    -3.3      -4.2      -7.6       -2.7       50.9     254.1
 EBITDA margin in %                          na        na        na         na    151.9%     103.5%
 EBIT                                      -3.6      -4.4      -7.8      -10.0       13.6     177.5
 EBIT margin in %                            na        na        na         na     40.8%      72.3%
 Net profit                                -3.6      -3.0      -5.1      -26.9      -23.7      91.1
 Cash flow statement (AUDm)
 CF from operations                        -1.3      -2.9       -4.9      -19.6        8.3     149.4
 Capex                                     -1.2      -7.0      -96.5    -607.6    -1,017.0    -515.4
 Maintenance Capex                          0.3       0.2        0.2        5.9       35.8      70.0
 Free cash flow                            -2.6      -9.9    -101.4     -627.2    -1,008.6    -366.0
 Balance sheet (AUDm)
 Intangible assets                          0.0       5.7       7.1        7.0        6.9        6.8
 Tangible assets                            0.0       1.1      96.0      696.4    1,676.2    2,115.1
 Shareholders' equity                       8.9     124.1     396.4    1,085.6    1,671.0    1,762.1
 Pension provisions                         0.0       0.0       0.0        0.0        0.0        0.0
 Liabilities and provisions                 0.0       0.0       0.0      482.2      799.3      799.3
 Net financial debt                        -6.4    -114.7    -290.8     -379.7       19.9      385.9
 w/c requirements                          -0.1       0.0       0.0        0.0        5.2       23.5
 Ratios
 ROE                                    -40.0%     -2.4%     -1.3%      -2.5%       -1.4%      5.2%
 ROCE                                   -40.5%     -3.6%     -2.0%      -0.6%        0.6%      6.9%
 Net gearing                            -72.3%    -92.5%    -73.3%     -35.0%        1.2%     21.9%
 Net debt / EBITDA                        1.9x     27.4x     38.3x     140.4x        0.4x      1.5x
 Source: Company data; AlsterResearch
AlsterResearch
Page 18 of 20

Conflict of interests
Disclosures regarding research publications of SRH AlsterResearch AG pursuant to section 85 of the German Securities Trading
Act (WpHG) and distributed in the UK under an EEA branch passport, subject to the FCA requirements on research
recommendation disclosures It is essential that any research recommendation is fairly presented and discloses interests of
indicates relevant conflicts of interest. Pursuant to section 85 of the German Securities Trading Act (WpHG) a research report has
to point out possible conflicts of interest in connection with the analyzed company. Further to this, under the FCA’s rules on
research recommendations, any conflicts of interest in connection with the recommendation must be disclosed. A conflict of
interest is presumed to exist in particular if SRH AlsterResearch AG

(1)       or its affiliate(s) (either in its own right or as part of a consortium) within the past twelve months, acquired the financial
          instruments of the analyzed company,

(2)       has entered into an agreement on the production of the research report with the analyzed company,

(3)       or its affiliate(s) has, within the past twelve months, been party to an agreement on the provision of investment banking
          services with the analyzed company or have received services or a promise of services under the term of such an
          agreement,

(4)       or its affiliate(s) holds a) 5% or more of the share capital of the analyzed company, or b) the analyzed company holds 5%
          or more of the share capital of SRH AlsterResearch AG or its affiliate(s),

(5)       or its affiliate(s) holds a net long (a) or a net short (b) position of 0.5% of the outstanding share capital of the analyzed
          company or derivatives thereof,

(6)       or its affiliate(s) is a market maker or liquidity provider in the financial instruments of the issuer,

(7)       or the analyst has any other significant financial interests relating to the analyzed company such as, for example,
          exercising mandates in the interest of the analyzed company or a significant conflict of interest with respect to the issuer,

(8)       The research report has been made available to the company prior to its publication. Thereafter, only factual changes
          have been made to the report.

Conflicts of interest that existed at the time when this research report was published:

Company                                                               Disclosure
Vulcan Energy Resources                                               2
AlsterResearch
Page 19 of 20
Important disclosures
1. General Information/Liabilities This research report has been produced for the The decision on the choice of the financial instruments analyzed in this document
information purposes of institutional investors only, and is not in any way a was solely made by SRH AlsterResearch AG. The opinions and estimates in this
personal recommendation, offer or solicitation to buy or sell the financial research report are subject to change without notice. It is within the discretion of
instruments mentioned herein. The document is confidential and is made SRH AlsterResearch AG whether and when it publishes an update to this research
available by SRH AlsterResearch AG, exclusively to selected recipients [in DE, GB, report, but in general updates are created on a regular basis, after 6 months at
FR, CH, US, UK, Scandinavia, and Benelux or, in individual cases, also in other the latest. A sensitivity analysis is included and published in company’s initial
countries]. A distribution to private investors in the sense of the German studies.
Securities Trading Act (WpHG) is excluded. It is not allowed to pass the research
report on to persons other than the intended recipient without the permission of 5. Date and time of first publication of the financial analysis
SRH AlsterResearch AG. Reproduction of this document, in whole or in part, is not 11-Aug-21 12:04 PM
permitted without prior permission SRH AlsterResearch AG. All rights reserved.
Under no circumstances shall SRH AlsterResearch AG, any of its employees 6. Risk information
involved in the preparation, have any liability for possible errors or • Stock exchange investments and investments in companies (shares) are
incompleteness of the information included in this research report – neither in always speculative and involve the risk of total loss.
relation to indirect or direct nor consequential damages. Liability for damages • This is particularly true in respect of investments in companies which are
arising either directly or as a consequence of the use of information, opinions and not established and/or small and have no established business or
estimates is also excluded. Past performance of a financial instrument is not corporate assets.
necessarily indicative of future performance. • Share prices may fluctuate significantly. This is particularly true for shares
with low liquidity (market breadth). Even small orders can have a significant
2. Responsibilities This research report was prepared by the research analyst impact on the share price.
named on the front page (the ʺProducerʺ). The Producer is solely responsible for • In the case of shares in narrow markets, it may also happen that there is no
the views and estimates expressed in this report. The report has been prepared or very little actual trading there and that published prices are not based on
independently. The content of the research report was not influenced by the actual trading but have only been provided by a stockbroker.
issuer of the analyzed financial instrument at any time. It may be possible that • In such markets a shareholder cannot expect to find a buyer for his shares
parts of the research report were handed out to the issuer for information at all and/or at reasonable prices. In such narrow markets there is a very
purposes prior to the publication without any major amendments high possibility of manipulating prices and in such markets there are often
being made thereafter. considerable price fluctuations.
• An investment in shares with low liquidity and low market capitalization is
3. Organizational Requirements SRH AlsterResearch AG took internal therefore highly speculative and represents a very high risk.
organizational and regulative precautions to avoid or accordingly disclose • There is no regulated market for unlisted shares and securities and a sale
possible conflicts of interest in connection with the preparation and distribution is not possible or only possible on an individual basis.
of the research report. All members of AlsterResearch AG involved in the
preparation of the research report are subject to internal compliance regulations. 7. Major Sources of Information Part of the information required for this research
No part of the Producer’s compensation is directly or indirectly related to the report was made available by the issuer of the financial instrument. Furthermore,
preparation of this financial analysis. In case a research analyst or a closely this report is based on publicly available sources (such as, for example,
related person is confronted with a conflict of interest, the research analyst is Bloomberg, Reuters, VWD-Trader and the relevant daily press) believed to be
restricted from covering this company. reliable. SRH AlsterResearch AG has checked the information for plausibility but
not for accuracy or completeness.
4. Information Concerning the Methods of Valuation/Update The determination
of the fair value per share, i.e. the price target, and the resultant rating is done on 8. Competent Supervisory Authority SRH AlsterResearch AG are under
the basis of the adjusted free cash flow (adj. FCF) method and on the basis of supervision of the BaFin – German Federal Financial Supervisory Authority
the discounted cash flow – DCF model. Furthermore, a peer group comparison is (Bundesanstalt für Finanzdienstleistungsaufsicht), Graurheindorfer Straße 108,
made. The adj. FCF method is based on the assumption that investors purchase 53117 Bonn and Marie-Curie-Straße 24 – 28, 60439 Frankfurt a.M. This
assets only at a price (enterprise value) at which the operating cash flow return document is distributed in the UK under a MiFID EEA branch passport and in
after taxes on this investment exceeds their opportunity costs in the form of a compliance with the applicable FCA requirements.
hurdle rate. The operating cash flow is calculated as EBITDA less maintenance
capex and taxes. Within the framework of the DCF approach, the future free cash 9. Specific Comments for Recipients Outside of Germany This research report
flows are calculated initially on the basis of a fictitious capital structure of 100% is subject to the law of the Federal Republic of Germany. The distribution of this
equity, i.e. interest and repayments on debt capital are not factored in initially. information to other states in particular to the USA, Canada, Australia and Japan
The adjustment towards the actual capital structure is done by discounting the may be restricted or prohibited by the laws applicable within this state.
calculated free cash flows with the weighted average cost of capital (WACC),
which takes into account both the cost of equity capital and the cost of debt. 10. Miscellaneous According to Article 4(1) No. i of the delegated regulation
After discounting, the calculated total enterprise value is reduced by the interest- 2016/958 supplementing regulation 596/2014 of the European Parliament,
bearing debt capital in order to arrive at the equity value. Detailed information on further information regarding investment recommendations of the last 12
the valuation principles and methods used and the underlying assumptions can months are published free of charge under https://www.alsterresearch.com.
be found at https://www.alsterresearch.com.
SRH AlsterResearch AG uses the following three-step rating system for the
analyzed companies:
• Buy: Sustainable upside potential of more than 10% within 12 months
• Sell: Sustainable downside potential of more than 10% within 12 months.
• Hold: Upside/downside potential is limited. No immediate catalyst visible.
NB: The ratings of SRH AlsterResearch AG are not based on a performance that
is expected to be “relative“ to the market.AlsterResearch
Page 20 of 20
Contacts
SRH AlsterResearch AG Research
Himmelstr. 9
22299 Hamburg OLIVER DREBING
Senior Analyst
Tel: +49 40 309 293-57
Tel: +49 40 309 293-52 E-Mail: o.drebing@alsterresearch.com
Fax: +49 40 556 330-54 HARALD HOF
E-Mail: info@alsterresearch.com Senior Analyst
Tel: +49 40 309 293-52
E-Mail: h.hof@alsterresearch.com
KARSTEN RAHLF, CFA
Senior Analyst
Tel: +49 40 309 293-54
E-Mail: k.rahlf@alsterresearch.com
KATHARINA SCHLÖTER
Analyst
Tel: +49 40 309 293-52
E-Mail: k.schloeter@alsterresearch.com
THOMAS WISSLER
Senior Analyst
Tel: +49 40 309 293-58
E-Mail: t.wissler@alsterresearch.com
DR. OLIVER WOJAHN, CFA
Senior Analyst
Tel: +49 40 309 293-58
E-Mail: o.wojahn@alsterresearch.com
ALEXANDER ZIENKOWICZ
Senior Analyst
Tel: +49 40 309 293-56
E-Mail: a.zienkowicz@alsterresearch.com
Sales
MARKUS KÖNIG-WEISS
Head of Sales
Tel: +49 40 309 293-52
E-Mail: mkw@alsterresearch.com
mwb fairtrade Wertpapierhandelsbank AG Equity Capital Markets / Trading
Rottenbucher Straße 28
KAI JORDAN
82166 Gräfelfing Member of the Board
Tel: +49 40 36 0995-22
E-Mail: kjordan@mwbfairtrade.com
Tel: +49 89 85852-0
Fax: +49 89 85852-505 ALEXANDER DEUSS
Head of Institutional Sales
E-Mail: info@mwbfairtrade.com Tel: +49 40 36 0995- 22
E-Mail: adeuss@mwbfairtrade.com
SASCHA GUENON
Head of Designated Sponsoring
Tel: +49 40 360 995 - 23
E-Mail: sguenon@mwbfairtrade.com
Our research can be found under RESEARCH HUB www.research-hub.de
BLOOMBERG www.bloomberg.com
FACTSET www.factset.com
THOMSON REUTERS / REFINITIV www.refinitiv.com
CAPITALIQ www.capitaliq.comYou can also read