WAKEFIELD PARK RACEWAY - ECONOMIC IMPACT ASSESSMENT BENALLA AUTO CLUB | SEPTEMBER 2020
←
→
Page content transcription
If your browser does not render page correctly, please read the page content below

WAKEFIELD PARK RACEWAY
ECONOMIC IMPACT ASSESSMENT

BENALLA AUTO CLUB | SEPTEMBER 2020

Neither Urban Enterprise Pty. Ltd. nor any member or
             employee of Urban Enterprise Pty. Ltd. takes responsibility in
DISCLAIMER
             any way whatsoever to any person or organisation (other
             than that for which this report has been prepared) in respect
             of the information set out in this report, including any errors
             or omissions therein. In the course of our preparation of this
             report, projections have been prepared on the basis of
             assumptions and methodology which have been described in
             the report. It is possible that some of the assumptions
             underlying the projections may change. Nevertheless, the
             professional judgement of the members and employees of
             Urban Enterprise Pty. Ltd. have been applied in making these
             assumptions, such that they constitute an understandable
             basis for estimates and projections. Beyond this, to the extent
             that the assumptions do not materialise, the estimates and
             projections of achievable results may vary.

             © Copyright, Urban Enterprise Pty Ltd, 2020
COPYRIGHT
             This work is copyright. Apart from any uses permitted under
             Copyright Act 1963, no part may be reproduced without
             written permission of Urban Enterprise Pty Ltd.

             L1 302-304 Barkly St, Brunswick VIC 3056
             +61 3 9482 3888         urbanenterprise.com.au
CONTENTS
EXECUTIVE SUMMARY                                                                             1
1. INTRODUCTION                                                                               3
1.1. ENGAGEMENT                                                                                3
1.2. BACKGROUND                                                                                3
1.3. METHODOLOGY                                                                               5
2. WAKEFIELD PARK RACEWAY PROFILE & CONTEXT                                                   6
2.1. INTRODUCTION                                                                              6
2.2. LOCATION                                                                                  6
2.3. TRACK AND FACILITIES                                                                      7
2.4. ACTIVITIES & EXPERIENCES                                                                  8
2.5. WPR EVENTS CALENDAR                                                                       9
3. ECONOMIC IMPACT ASSESSMENT                                                                 10
3.1. INTRODUCTION                                                                             10
3.2. ECONOMIC IMPACT OF WPR EVENTS IN 2019                                                    10
3.3. ECONOMIC IMPACT OF WPR REDEVELOPMENT                                                     11
APPENDICES                                                                                    13
APPENDIX A WAKEFIELD PARK EVENT, RACE TEAM AND SPECTATOR INFORMATION                          13
APPENDIX B RACE TEAM ENTRANTS                                                                 18

FIGURES
F1. CONCEPT PLAN & SECTIONS, WPR REDEVELOPMENT                                                 4
F2. ECONOMIC IMPACT AREA, GOULBURN REGION                                                      5
F3. LOCATION OF WAKEFIELD PARK RACEWAY                                                         6
F4. WAKEFIELD PARK RACEWAY, CIRCUIT AND ON-SITE FACILITIES                                     7
F5. SPECTATOR ORIGIN                                                                          14
F6. WAKEFIELD PARK RACEWAY SPECTATORS - TRAVEL GROUP                                          15
F7. WAKEFIELD PARK RACEWAY - SPECTATORS STAYING OVERNIGHT                                     15
F8. OVERNIGHT LOCATION OF SPECTATORS                                                          16
F9. RACE TEAMS STAYING OVERNIGHT                                                              20
F10. LOCATION OF OVERNIGHT VISITORS                                                           20

TABLES
T1. EVENTS AT WAKEFIELD PARK RACEWAY, 2019                                                     9
T2. ECONOMIC IMPACT OF EVENTS HELD AT WPR, GOULBURN REGION, 2019                              10
T3. ECONOMIC IMPACT, CONSTRUCTION PHASE, WPR REDEVELOPMENT                                    11
T4. ECONOMIC IMPACT, OPERATIONAL PHASE, WPR REDEVELOPMENT                                     12
T5. SUMMARY OF ECONOMIC IMPACTS, WPR REDEVELOPMENT                                            12
T6. ITEMISED SPECTATOR EXPENDITURE (PER PERSON) – WAKEFIELD PARK RACEWAY                      16
T7. SPECTATOR EXPENDITURE BY LOCATION ON TRIP                                                 16
T8. SPECTATOR EXPENDITURE BY ITEM AND LOCATION                                                17
T9. ITEMISED RACE TEAM EXPENDITURE (PER TEAM) – OVERNIGHT VISITORS - WAKEFIELD PARK RACEWAY   21
T10. LOCATION OF RACE TEAM EXPENDITURE – OVERNIGHT VISITORS - WAKEFIELD PARK RACEWAY          21
T11. ITEMISED RACE TEAM EXPENDITURE (PER TEAM) – DAYTRIP VISITORS – WAKEFIELD PARK RACEWAY    22
T12. LOCATION OF RACE TEAM EXPENDITURE – DAYTRIP VISITORS – WAKEFIELD PARK RACEWAY            22
T13. ITEMISED RACE TEAM EXPENDITURE (PER TEAM) – ALL VISITORS - WAKEFIELD PARK RACEWAY        23
T14. LOCATION OF RACE TEAM EXPENDITURE (PER TEAM) – ALL VISITORS – WAKEFIELD PARK RACEWAY     23

ACRONYMS

FTE                   Full Time Equivalent
I-O                   Input-Output
WPR                   Wakefield Park Raceway

GLOSSARY OF TERMS
                      As output increases, so too does employment, and wages
                      and salaries paid to local employees. A portion of this
Consumption Impacts   additional income to households is used for consumption in
                      the local economy which leads to further increases in
                      demand and output region.

Direct Impacts        Direct output or value of development or construction
                      activity.

Employment            Represents the number of people employed by businesses /
                      organisations in each of the industry sectors in a defined
                      region. Employment data presented in this report is
                      destination of work data. That is, no inference is made as to
                      where people in a defined region reside. This employment
                      represents total numbers of employees without any
                      conversions to full-time equivalence. Retail jobs for instance
                      represent typical employment profiles for that sector, i.e.
                      some full time, some part time and some casual.

Industrial Impacts    The increased output generated by servicing industry
                      sectors in response to the direct change in output and
                      demand.

Output                Represents the gross revenue generated by businesses /
                      organisations in each of the industry sectors in a defined
                      region. Gross revenue is also referred to as total sales or
                      total income.

Value-Added           Represents the marginal economic value that is added by
                      each industry sector in a defined region. Value-Added can be
                      calculated by subtracting local expenditure and expenditure
                      on regional imports from the output generated by an
                      industry sector, or alternatively, by adding the Wages &
                      Salaries paid to local employees, the gross operating surplus
                      and taxes on products and production. Value-Added by
                      industry sector is the major element in the calculation of
                      Gross Regional Product / Gross State Product / Gross
                      Domestic Product.
EXECUTIVE SUMMARY
OVERVIEW

The purpose of this assessment is to:
•    Assess and quantify the economic impact of Wakefield Park Raceway’s (WPR) event calendar in 2019; and
•    Identify and estimate the economic impacts and benefits of the proposed redevelopment of WPRs facilities,
     which include an upgrade to its pit lane and corporate facilities.

EVENTS HELD AT WPR IN 2019

•    In 2019, WPR was occupied on 291 days (or 80% of the year).
•    WPR attracted an estimated 35,300 visitors in 2019, which included a mix of private track users, race entrants
     and competitors, spectators and accompanying travellers.
•    On average, WPR attracts 121 visitors per event, with peak visitation occurring in the months that include
     marquee events (February, March, May, September and October)
Events held at WPR in 2019 generated a total economic output in the order of $16.95 million to the Goulburn
regional economy. This includes $9.73 million in direct output and $7.22 million in indirect output.
In addition, events held at WPR in 2019 generated and supported a total of 82 (FTE) jobs in the Goulburn region,
including 58 direct jobs and 24 indirect jobs.

REDEVELOPMENT PROPOSAL & EXPECTED ECONOMIC IMPACTS AND BENEFITS

Currently, the facilities at WPR are not of a quality that satisfies user expectations and is not keeping pace with
competing Raceway’s such as Sydney Motorsport Park. In order to create a more attractive experience for users,
a complete redevelopment of the administration, off-track and spectator facilities is proposed. The $4.79 million
redevelopment proposal (construction cost) includes new corporate and spectator facilities, with a new
administration/amenities building.
Improved facilities at WPR will not only help secure the Raceway’s existing calendar of events, but it will create
opportunities to attract a more diverse range of clients, events and private hire days, in-turn attracting more visitors
and expenditure to the Goulburn region.
The upgrade will significantly improve the overall facilities that are offered at WPR, making it a more attractive
destination for events and private users.
The proposed redevelopment will deliver the following economic benefits:
•    Construction – A direct construction investment of $4.79 million will stimulate the regional construction
     industry and deliver direct and indirect output and employment (jobs) to the Goulburn regional economy
     during the construction period; and
•    Operational – Once the redevelopment is complete and operational, WPR will have the capacity and capability
     to attract a more diverse range of clients, events and visitors to the Raceway and the Goulburn region, in turn
     delivering additional output and employment (jobs) to the regional economy.

Wakefield Park Economic Impact Assessment                                                                            1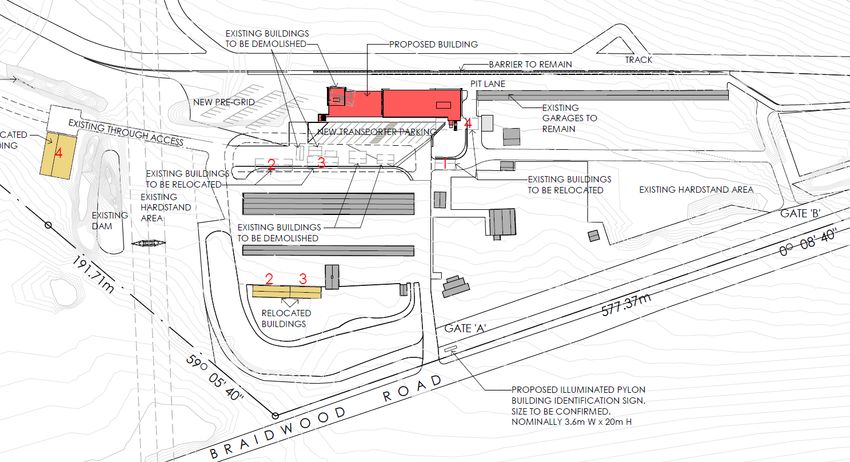
ECONOMIC IMPACT OF THE REDEVELOPMENT PROPOSAL

Construction Phase
The construction phase is estimated to generate a total economic output in the order of $10.38 million, including
$4.79 million in direct and $5.59 million in indirect output. Further, the investment will support a total of 26 jobs,
including 10 direct and 16 indirect jobs.
Operational Phase
Once the redevelopment is complete and operational, it is estimated that will attract an additional 3,500 visitors
per annum. It is important to note that this will not increase the number of people that attend events or peak
visitation to WPR, but rather the number of smaller events and private hire days held at WPR may increase.
The additional visitor expenditure is estimated to deliver an annual economic output in the order of $1.69 million
and support 8 (FTE) jobs. This includes $0.96 million in direct output and $0.73 million in indirect output.
Table S1: Summary of Economic Impacts, WPR Redevelopment

                                                   Direct Impact            Indirect Impact     Total

                             Output ($m)           $4.79                    $5.59               $10.38
 CONSTRUCTION
                             Employment (jobs)     10                       16                  26
 (construction period)
                             Value-added ($m)      $1.51                    $2.37               $3.88

                             Output ($m)           0.96                     0.73                1.69
 OPERATIONAL
                             Employment (jobs)     6                        2                   8
 (ongoing)
                             Value-added ($m)      0.39                     0.35                0.74

Source: Urban Enterprise, 2020

CONCLUSION

WPR is as a critical economic asset for the Goulburn region. It attracts a significant number of users, competitors
and spectators from outside of the region to visit the Raceway for competitive, corporate and casual events. The
overwhelming majority of visitor expenditure is spent in the Goulburn region, indicating that businesses in the
Goulburn region are the largest beneficiaries of visitation to WPR.
The off-track and spectator facilities at WPR are outdated and are failing to keep pace with competing Raceway’s
such as Sydney Motorsport Park. The proposed redevelopment at WPR is required to improve the competitiveness
and attractiveness of the facility and satisfy user and visitor expectations. Importantly, the redevelopment of the
Raceway will ensure the current calendar of events at WPR is secured and the annual economic benefits delivered
to the Goulburn economy are maintained.

Wakefield Park Economic Impact Assessment                                                                          2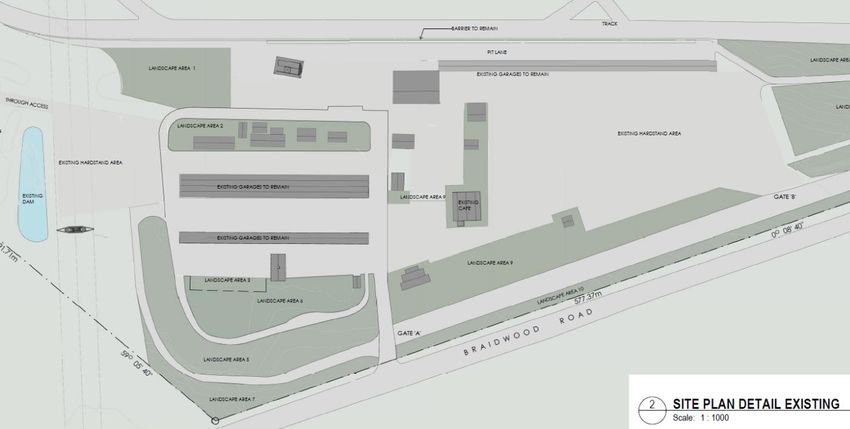
1. INTRODUCTION

1.1. ENGAGEMENT
The purpose of this assessment is to:
•    Assess and quantify the economic impact of Wakefield Park Raceway’s (WPR) event calendar in 2019; and
•    Identify and estimate the economic impacts and benefits of the proposed redevelopment of WPRs facilities,
     which include an upgrade to its pit lane and corporate facilities.

1.2. BACKGROUND
Wakefield Park Raceway (WPR) is located at 4770 Braidwood Road, Tirrannaville NSW; approximately 12
kilometres south of Goulburn.
WPR hosts a significant number of annual events that vary in terms of the scale of users and visitors. Events range
from club-level events (e.g. car club sprints, historic meetings, motorcycle ride days) to larger, marquee events
such as state championship racing events. The circuit is also an important testing facility for racing drivers/riders
and teams, as well as a venue for car manufacturers who host drive days for customers and clients.
Collectively, the competitive, casual and corporate events held at WPR attract a significant number of visitors
throughout the year and include a broad mix of race teams, private users, spectators and accompanying travellers
from across Australia. The operations of WPR and the attraction of race teams and spectators provides significant
ongoing economic benefits to the regional and state economy.
Despite the significant number of events held at WPR, the facilities are outdated and are not keeping pace with
competing Raceway’s such as Sydney Motorsport Park. In order to create a more attractive experience for users,
a complete redevelopment of the administration, off-track and spectator facilities is proposed. Improved facilities
at WPR will not only secure the Raceway’s existing calendar of events, but it will create opportunities to attract
more events and private hire days, in-turn attracting more visitors and expenditure to the Goulburn region.
The proposed site plane and sketches are shown in Figure 1 (overleaf). The upgrades will include a complete
redevelopment of the corporate and spectator facilities, with construction of a new 2 storey multi-purpose pit lane
building.
The proposed redevelopment will include:
•    A new 2 storey multi-purpose pit lane building;
•    The relocation of some of the current uses (including the medical centre, offices, control tower, ticket/sales
     office, media centre) together with new corporate and function spaces; and
•    Continuation of the existing accommodation, including cabins and camping area.
The estimated cost to deliver the redevelopment is $4.79 million.
The upgrade will significantly improve the overall facilities that are offered at WPR, making it a more attractive
destination for motorsport events and private users. This proposal is expected to strengthen WPR’s role as a
premier Raceway in regional NSW and increase the economic contribution that its events and operations deliver
to the Goulburn regional economy.

Wakefield Park Economic Impact Assessment                                                                         3
F1. CONCEPT PLAN & SECTIONS, WPR REDEVELOPMENT Source: Leffler Simes Architects, 2020 Wakefield Park Economic Impact Assessment 4
1.3. METHODOLOGY
This assessment estimates the current economic impact of WPR and assesses the additional benefits that the
proposed redevelopment would deliver during the construction period and once the redevelopment is complete
and operational.
To calculate economic impacts, the Input-Output (I-O) method of analysis has been adopted. The I-O method is a
common form of economic modelling that is based on the interdependencies and relationship between industry
sectors, and is widely used across the public and private sector to estimate the direct and flow-on impacts of a
project or activity to an economy.
Economic impacts are expressed in terms of output, employment (FTE jobs) and value-added to the Goulburn
regional economy, shown in Figure 2.

F2. ECONOMIC IMPACT AREA, GOULBURN REGION

Source: Goulburn-Mulwaree Local Government Area, compiled by Urban Enterprise 2020

Wakefield Park Economic Impact Assessment                                                                    5
2. WAKEFIELD PARK RACEWAY PROFILE & CONTEXT

2.1. INTRODUCTION
This section provides an overview of the Wakefield Park Raceway including the origin and history of the Raceway,
the location, track and facility characteristics, as well as an overview of events held at the Raceway in 2019.

2.2. LOCATION
Wakefield Park Raceway is located at 4770 Braidwood Road, Tirrannaville NSW; approximately 12 kilometres south
of Goulburn. The Raceway is strategically located, situated between the major towns and capital cities of Canberra,
Wollongong and Sydney.
The distances and approximate travel times (by car) are as follows:
•    Canberra - 96 km (1 hr);
•    Sydney - 203 km (2 hrs);
•    Wollongong - 168 km (1 hr 45 mins);
•    Moss Vale/Bowral - 95 km (1 hr).

F3. LOCATION OF WAKEFIELD PARK RACEWAY

Source: Urban Enterprise 2020, Google Maps (base map)

Wakefield Park Economic Impact Assessment                                                                       6
2.3. TRACK AND FACILITIES

HISTORY AND ORIGIN

The Raceway is located 12 km south of Goulburn, situated in the Southern Tablelands of New South Wales.
Goulburn has a rich motorsport history, as it was the location of the first Australian Grand Prix for motor cars in
January 1927.
The Wakefield Park circuit officially opened in November 1994 and was established in response to Sydney’s
significant population growth and continual urban encroachment threatening the existence of Amaroo Park and
Oran Park. As a result, the circuit was established in a rural area, whereby the threat of urban encroachment is
significantly reduced.
When the Raceway opened, the circuit was 2.2 kilometres in length and consisted of fluctuations in elevation. The
mix of technical corners and relatively short straights made it a circuit that tested driving ability and car setup.
Since the Raceway officially opened in 1994, Wakefield Park has hosted a wide range of events, including club
sprints, time attack events, manufacturer drive days, driver training programs, state championship race meetings,
PROCAR, Shannons Nationals, endurance races, Australian Superbikes and the V8 Supercars Development Series.
In 2000, several adjustments were made to the circuit, including re-structuring of the track to improve the driving
experience. The following year, Wakefield Park’s status was elevated from club-level motorsport attributed to two
major events taking place at the venue: The V8 Supercars Development Series and the PROCAR Series.
In 2007, the circuit was purchased by the Benalla Auto Club and continues to prosper as a facility focused around
competitor and spectator satisfaction.

F4. WAKEFIELD PARK RACEWAY, CIRCUIT AND ON- SITE FACILITIES

Source: Benalla Auto Club 2020

Wakefield Park Economic Impact Assessment                                                                        7
2.4. ACTIVITIES & EXPERIENCES
Wakefield Park offers a number of different driving experiences, which cater to a variety of driver/rider capabilities,
from amateurs wanting to test the performance of their road vehicle under controlled conditions, through to race
teams looking to use Wakefield Park’s technical layout to fine tune the setup of their race car.
The facility operates seven days a week, with a variety of events and uses being available to members of the public
and motorsport enthusiasts. The activities are heavily restricted to ensure they comply with the recent Prevention
Notice to ensure the impact on surrounding neighbours is minimised. Activities include:
•    Motor Vehicle Drive Days
•    Motorcycle Ride Days
•    Drift Days
•    Motor Vehicle Experiences
•    Motor Vehicle Training
•    Motor Vehicle Competitive Racing Events.

MOTOR VEHICLE EXPERIENCES

WPR offers a number of different motor vehicle experiences, catering for professionals and amateurs alike:
•    Test and Tune: preparation of motor vehicles, enabling competitors to gain practice on a race circuit.
•    Speed off the Streets: provides opportunities for motoring enthusiasts to test the capabilities of their vehicles
     under controlled conditions.
•    Motor Vehicle Guided Experiences: provides opportunities for the general public to drive a race-prepared
     vehicle around the circuit with professional guidance and instruction.
•    Educational Driver and Rider Programs: aimed at road users (learners, provisional and elderly drivers) to
     increase their skill levels in a safe environment for use on the public roads.
The circuit is also used by corporate clients including car manufacturers, who host motor vehicle experience days
for their customers, along with media organisations who use the venue to road test motor vehicles.
ACCOMMODATION
WPR has on-site accommodation which consists of six cabins, which can be booked on weekends or during the
week. There is also a camping area at the north-western corner of the site.
OTHER FACILITIES
In terms of other on-site amenity, the site has a café, media centre, corporate facilities, office space and medical
facility.
For anything else over and above the existing on-site facilities, spectators, visitors and competitors will travel to
Goulburn as these items are unavailable at Wakefield Park.

Wakefield Park Economic Impact Assessment                                                                           8
2.5. WPR EVENTS CALENDAR
In 2019 WPR was occupied on 291 days, meaning that the Raceway accommodated an event or private hire day
on 80% of days in the calendar year. Across the 291 days, WPR attracted an estimated 35,300 visitors which
included a mix of private track users, race entrants and competitors, spectators and accompanying travellers.
Table 1 summarises the number of days that WPR is occupied for each month of the 2019 calendar year, including
the total number of visitors for each month. On average, WPR attracts 121 visitors per event, with peak visitation
occurring in the months that include marquee events. The marquee events held at WPR in 2019 were:
• Australian Superbike Championship (Mar);
• Australian Super Trucks (Apr & Nov);
• Motorsport Australia NSW Motor Race Championship (Feb, May & Sept);
• Australian Motor Racing Series (Oct); and
• Historic Sports and Racing Car Association of NSW (Mar & Sept).
Given that these events attract the highest number of race teams, competitors and spectators, they deliver the
most significant economic benefits to the Goulburn region. This is a result of a combination of factors including:
• State and national events that attract competitors and spectators from across Australia; and
• Multi-day events that require visitors to stay overnight in the region, encouraging a greater length of stay and
higher yield (i.e. more expenditure incurred in the region).
Beyond the marquee events, WPR also hosts regional and state motorsport club events, private hire days and
driving school events. There is opportunity for WPR to attract a more diverse range of events and private hire days
through upgraded corporate facilities that attract corporate manufacturing clients that generally are quieter than
some of the current events.
T1. EVENTS AT WAKEFIELD PARK RACEWAY, 2019
Total persons who visited WPR Average visitors to
Month No. of occupied days at WPR (competitors, race teams, casual users, WPR per occupied
spectators & accompanying travellers) day
January 15 910 61
February 26 3,266 126
March 28 10,310 368
April 23 1,035 45
May 26 3,791 146
June 21 1,323 63
July 23 1,436 62
August 23 1,912 83
September 29 3,696 127
October 30 4,074 136
November 27 2,540 94
December 20 1,004 50
Total 291 35,297 121
Source: Wakefield Park Raceway, 2020
Wakefield Park Economic Impact Assessment 93. ECONOMIC IMPACT ASSESSMENT
3.1. INTRODUCTION
This section calculates the economic impact of events held at WPR in 2019 and estimates the short term and
ongoing benefits that will be delivered by the redevelopment proposal, including the construction phase and once
the redevelopment is complete and operational.
To calculate economic impacts, the Input-Output (I-O) method of analysis has been adopted. The I-O method is a
common form of economic modelling that is based on the interdependencies and relationship between industry
sectors, and is widely used across the public and private sector to estimate the direct and flow-on impacts of a
project or activity to an economy.
Economic impacts are expressed in terms of output, value-added and employment (FTE jobs) and apply to the
Goulburn regional economy. Economic terms used throughout this assessment are defined in Glossary of Terms
on the cover page.
3.2. ECONOMIC IMPACT OF WPR EVENTS IN 2019
To calculate the economic impact of WPR’s calendar of events in 2019, the following inputs to the economic model
have been adopted:
• Approximately 35,300 persons visited WPR in 2019, consisting of 47% race teams, competitors and/or track
users, and 53% spectators and/or accompanying travellers.
• Average expenditure of $346 per person per trip in the Goulburn region for race team members and
competitors.
• Average expenditure of $214 per person per trip in the Goulburn region for spectators or accompanying
travellers.
Expenditure figures were previously collected in 2017 at two separate events held at WPR. Information was
collected via intercept surveys and race team surveys. Respondents provided information relating to their trip to
WPR, including their origin, length of stay, and itemised expenditure incurred in the Goulburn region.
Expenditure figures have been indexed to reflect current day dollars (2020) and extrapolated across all events to
calculate the total expenditure incurred in the region. A complete summary of survey results is provided in Appendix
A and Appendix B.
Based on the adopted inputs, events held at WPR in 2019 generated a total economic output in the order of $16.95
million to the Goulburn regional economy. This includes $9.73 million in direct output and $7.22 million in indirect
output.
In addition, events held at WPR in 2019 added $7.96 million in value to the economy and supported 82 (FTE) jobs,
including 58 direct jobs and 24 indirect jobs.
T2. ECONOMIC IMPACT OF EVENTS HELD AT WPR, GOULBURN REGION, 2019
Impact Summary Direct Impact Industrial Impact Consumption Impact Total Impact
Economic Output ($M) $9.73 $4.15 $3.07 $16.95
Employment (Jobs) 58 12 12 82
Value-added ($M) $4.35 $1.80 $1.80 $7.96
Source: Urban Enterprise, 2020
Wakefield Park Economic Impact Assessment 103.3. ECONOMIC IMPACT OF WPR REDEVELOPMENT
The proposed redevelopment of WPR’s corporate, spectator and amenity facilities will deliver much needed
improvements to Raceway’s offering to users of the facility, including race teams, competitors and spectators.
The proposed redevelopment will deliver the following economic benefits:
• Construction – An investment of $4.79 million to deliver the redevelopment will stimulate the regional
construction industry and deliver direct and indirect output and employment (jobs) to the Goulburn regional
economy during the construction period; and
• Operational – Once the redevelopment is complete and operational, WPR will have the capacity and capability
to attract more events and visitors (including expenditure) to the Raceway and the Goulburn region, in turn
delivering additional output and employment (jobs) to the regional economy.
3.3.1. CONSTRUCTION PHASE
The construction phase is estimated to generate a total economic output in the order of $10.4 million, including
$4.79 million in direct and $5.6 million in indirect output. Further, the investment will support a total of 26 jobs,
including 10 direct and 16 indirect jobs.
T3. ECONOMIC IMPACT, CONSTRUCTION PHASE, WPR REDEVELOPMENT
Impact Summary Direct Impact Supply-Chain Impact Consumption Impact Total Impact
Output ($M) $4.79 $4.05 $1.55 $10.38
Employment (Jobs) 10 11 5 26
Value-added ($M) $1.51 $1.51 $0.86 $3.88
Source: Urban Enterprise, 2020
3.3.2. OPERATIONAL PHASE
Given that WPR is occupied for 291 days (80%) of the year, there are opportunities for WPR to attract more events
during the year, particularly during months with a below-average number of events, including December, January
and in the period between June and August.
To estimate the expected benefits during the operational phase, a number of assumptions have been adopted in
terms of the additional number of events that could be held at WPR.
The management team at WPR indicated that the redevelopment will create a much more attractive and
comfortable environment for users, in-turn WPR will be able to attract a more diverse range of events including
corporate manufacturing events that are generally are quieter events.
Based on information provided by WPR, it is assumed that once the redevelopment is complete, WPR could
realistically accommodate 10% more events, meaning that an additional 29 days would be occupied per annum.
The new annual events will reflect the improved facilities and will be mix of private hire days and corporate events,
meaning that peak and average visitation to the Raceway is unlikely to change.
Adopting the average visitation per event in 2019 (121 visitors), it is estimated that the redevelopment proposal
will attract an additional 3,500 visitors per annum spread across the additional 29 days occupied throughout the
year. The new visitors to WPR will attract and generate additional expenditure within the Goulburn region, providing
stimulus to the local economy.
The additional visitor expenditure is estimated to deliver an annual economic output in the order of $1.69 million
and support 8 (FTE) jobs. This includes $0.96 million in direct output and $0.73 million in indirect output, as shown
in Table 4 (overleaf).
Wakefield Park Economic Impact Assessment 11Please note that these impacts are additional to the current economic impacts delivered by the Raceway’s annual
calendar of events (see Table 2).
T4. ECONOMIC IMPACT, OPERATIONAL PHASE, WPR REDEVELOPMENT
Impact Summary Direct Impact Supply-Chain Impact Consumption Impact Total Impact
Output ($M) $0.96 $0.41 $0.32 $1.69
Employment (Jobs) 6 1 1 8
Value-added ($M) $0.39 $0.17 $0.18 $0.74
Source: Urban Enterprise, 2020
3.3.3. SUMMARY OF ECONOMIC IMPACTS
Table 5 summarises the estimated economic impacts that the redevelopment of WPR will deliver during the
construction phase and once the redevelopment is complete and operational. The notable construction investment
($4.79 million) will stimulate the local, regional and state construction industry, generating economic output and
jobs during the construction period. Further, the significantly improved facilities at the Raceway will allow WPR to
secure their marquee events, attract new and generally quieter events such as corporate events and private hire
days. This would result in additional economic output and jobs supported in the region through more visitation and
expenditure injected into the Goulburn economy.
T5. SUMMARY OF ECONOMIC IMPACTS, WPR REDEVELOPMENT
Direct Impact Indirect Impact Total
Output ($m) $4.79 $5.59 $10.38
CONSTRUCTION
Employment (jobs) 10 16 26
(construction period)
Value-added ($m) 1.51 2.37 $3.88
Output ($m) 0.96 0.73 1.69
OPERATIONAL
Employment (jobs) 6 2 8
(ongoing)
Value-added ($m) 0.39 0.35 0.74
Source: Urban Enterprise, 2020
WPR is recognised as a critical economic asset for the Goulburn region. It attracts a significant number of users,
competitors and spectators from outside of the region to visit the Raceway for competitive, corporate and casual
events. The overwhelming majority of visitor expenditure is spent in the Goulburn region, indicating that businesses
in the Goulburn region are the largest beneficiaries of visitation to WPR.
It is apparent that the off-track and spectator facilities at WPR are outdated and are failing to keep pace with
competing Raceway’s such as Sydney Motorsport Park. Clearly, the proposed redevelopment at WPR is required
to improve the attractiveness of the facility and satisfy user and visitor expectations. Importantly, the
redevelopment of the Raceway will ensure the current calendar of events at WPR are secured and the annual
economic benefits delivered to the Goulburn economy are maintained.
Wakefield Park Economic Impact Assessment 12APPENDICES APPENDIX A WAKEFIELD PARK EVENT, RACE TEAM AND SPECTATOR INFORMATION To understand the profile of spectators to the Raceway and to inform the economic impact modelling, intercept surveys were conducted at two separate events in 2017: • CAMS NSW State Championships; and • HSRCA Autumn Historic. The CAMS NSW State Championships is a bi-annual two-day event, typically held in February and August. The event attracts approximately 180 race team entrants and 400 spectators per event. The HSRCA Autumn Historic event is typically held in April over three days. The event attracts approximately 230 race team entrants and 550 spectators. The intercept survey was designed to understand spectator behaviour including: • Origin; • Travel group; • Overnight visitors; and • Expenditure by item and region. The intercept survey collected 50 respondents representing 92 spectators across the two events. The two events attracted a combined 950 spectators, therefore, the sample represents approximately 10% of total spectators to the event. This sample size provides a margin error of +/- 6% at the 95% confidence level, which is considered appropriate for a survey of this nature. KEY FINDINGS Based on the intercept survey results, spectators travelled from a variety of areas throughout New South Wales, ACT and Victoria to visit Wakefield Park Raceway, highlighting that the Raceway draws visitors from all over Australia. The majority of spectators travelled from the east coast of NSW including the Southern Highlands, Metropolitan Sydney, Central Coast and Newcastle. A small proportion of spectators travelled from Canberra, Wagga Wagga and Melbourne. The spectator’s origin is representative of the survey results; however, it is also common for Wakefield Park to attract spectators from Queensland and South Australia. The Raceway attracted a variety of travel groups including families, lone travellers, adult couples and friends and/or relatives. Over half of the spectators at Wakefield Park stayed overnight with the overwhelming majority choosing to stay overnight in Goulburn. On average, spectators spent $222 per trip to the Raceway. The most common and biggest expenses included accommodation, food and drink and travel/transport. Based on findings from the survey, an average of 93% of all spectator expenditure items were purchased in the Goulburn region, highlighting that businesses in the Goulburn region receive the greatest economic benefit from spectators at Wakefield Park Raceway. Wakefield Park Economic Impact Assessment 13
SUMMARY OF SPECTATOR SURVEY RESULTS

Origin
Based on the intercept survey results, spectators travelled from a variety of areas throughout NSW, ACT and
Victoria to visit Wakefield Park Raceway.
The majority of spectators travelled from the east coast of NSW including the Southern Highlands, Metropolitan
Sydney, Central Coast and Newcastle. A small proportion of spectators travelled from Canberra, Wagga Wagga
and Melbourne.
The distribution of spectator origin is provided below. The distribution shows that:
•     29% of spectators travelled from Metropolitan Sydney;
•     20% of spectators travelled from the Wollongong region;
•     16% of spectators travelled from the Newcastle region;
•     6% of spectators travelled from the ACT;
•     2% of spectators travelled from the Central Coast; and
•     10% travelled from other areas including Melbourne, Batemans Bay, Wagga Wagga, Young and Tamworth.

F5. SPECTATOR ORIGIN

Source: Intercept Survey for CAMS NSW State Championship and HSRCA Historic Autumn 2017
Note 1: Circles represent the locational catchment of spectator origin and do not relate to the size of the market.

Wakefield Park Economic Impact Assessment                                                                             14
Travel Group
The Raceway attracted a variety of travel groups. 34% of spectators were travelling alone, 30% were travelling as
an adult couple, 20% were travelling as friends and/or relatives and 16% were travelling in a family group.

F6. WAKEFIELD PARK RACEWAY SPECTATORS - TRAVEL GROUP

                                                           Travelling Alone
                 16%

                                     34%                   Adult Couple

         20%
                                                           Friends and/or
                                                           Relatives

                          30%                              Family Group (adult
                                                           couple with children)

Source: Intercept Survey for CAMS NSW State Championship and HSRCA Historic Autumn 2017

Overnight and Day Trip Spectators
56% of respondents stayed overnight and 44% visited the Raceway as a day trip only. Of the overnight spectators,
42% stayed 2 nights, 10% stayed one night and 4% stayed 3 nights.

F7. WAKEFIELD PARK RACEWAY - SPECTATORS STAYING OVERNIGHT

                               0%    10%          20%   30%        40%            50%

 No, this was a daytrip only                                                  44%

                   2 nights                                                 42%

                    1 night                 10%

                   3 nights         4%

Source: Intercept Survey for CAMS NSW State Championship and HSRCA Historic Autumn 2017

Wakefield Park Economic Impact Assessment                                                                     15
Figure 8 shows the location of spectators’ overnight stay. The overwhelming majority (93%) of overnight
spectators stayed in the township of Goulburn.
F8. OVERNIGHT LOCATION OF SPECTATORS
4% 4% Goulburn
Yass
93%
Wakefield (at
circuit)
Source: Intercept Survey for CAMS NSW State Championship and HSRCA Historic Autumn 2017
SPECTATOR EXPENDITURE
Itemised Spectator Expenditure
On average, spectators spent $222 per trip. The most common and biggest expenses for spectators consisted of
accommodation (27%), travel/transport (25%) and food and drink (28%).
Of the $222, 90% was purchased within the Goulburn region, 9% was purchased elsewhere in NSW and 3% was
purchased in Metropolitan Sydney.
T6. ITEMISED SPECTATOR EXPENDITURE (PER PERSON) – WAKEFIELD PARK RACEWAY
Expenditure Per Person ($) Proportion (%)
Travel/transport (including petrol) $55 25%
Accommodation $82 37%
Shopping (excluding groceries & alcohol) $9 4%
Food and drink - take away $30 13%
Food and drink - dining out (e.g. cafes, restaurants) $33 15%
Groceries (including alcohol) $5 2%
Attractions/activities/tours/entertainment $8 4%
Other $0 0%
TOTAL $222 100%
Source: Intercept Survey for CAMS NSW State Championship and HSRCA Historic Autumn 2017
T7. SPECTATOR EXPENDITURE BY LOCATION ON TRIP
Goulburn Metropolitan Elsewhere in Other State
Total
Region (%) Sydney (%) NSW (%) /Territory (%)
Expenditure per person $200 $3 $19 $0 $222
Proportion 90% 1% 9% 0% 100%
Source: Intercept Survey for CAMS NSW State Championship and HSRCA Historic Autumn 2017
Wakefield Park Economic Impact Assessment 16Itemised Spectator Expenditure by Location
Table 8 provides the proportion of expenditure, per item, spent in each of the identified regions. Based on survey
results, 93% of expenditure items were purchased in the Goulburn region. This included 100% of food and drink
(dining out), 99% of food and drink (take away), 98% of accommodation, 96% of shopping and 94% of groceries.
The key expenditure item purchased outside of the Goulburn region consisted of travel/transport. 31% of spectators
purchased this item elsewhere in NSW (31%).
On average, 93% of all spectator expenditure was purchased within the Goulburn region. This highlights that
businesses located in the Goulburn region receive the greatest economic benefit from spectators attending
Wakefield Park Raceway.
T8. SPECTATOR EXPENDITURE BY ITEM AND LOCATION
Goulburn Metropolitan Elsewhere in Other State
Region (%) Sydney (%) NSW (%) /Territory (%)
Travel/transport (including petrol) 64% 5% 31% 0%
Accommodation 98% 0% 2% 0%
Shopping (excluding groceries & alcohol) 96% 4% 0% 0%
Food and drink - take away 99% 0% 1% 0%
Food and drink - dining out (e.g. cafes,
100% 0% 0% 0%
restaurants)
Groceries (including alcohol) 94% 6% 0% 0%
Attractions/activities/tours/entertainment 100% 0% 0% 0%
Average 93% 2% 5% 0%
Source: Intercept Survey for CAMS NSW State Championship and HSRCA Historic Autumn 2017
Wakefield Park Economic Impact Assessment 17APPENDIX B RACE TEAM ENTRANTS To understand the profile of race teams at Wakefield Park Raceway and to inform the economic impact modelling, an online survey was distributed to race teams at three events: • CAMS NSW State Championships; • HSRCA Autumn Historic; and • Australian Superbikes Championship. The online survey was designed to understand race team behaviour including: • Origin; • Number of team members; • Overnight trips; and • Expenditure by item and location. The online survey collected 97 respondents. This sample size provides an error margin of +/- 6% at the 95% confidence level, which is considered appropriate for a survey of this nature. KEY FINDINGS Based on the online survey results, the average size of race teams competing at Wakefield Park is 3 people. Race teams travelled from a range of areas throughout NSW, ACT, Queensland, South Australia and Victoria to compete at Wakefield Park Raceway. The majority of race teams travelled from the east coast of NSW including Metropolitan Sydney and key Regional areas in NSW such as Wollongong, Southern Highlands, Central Coast and Newcastle. On average, 90% of race teams stayed overnight when competing at Wakefield Park. The average length of stay was 2.1 days and the majority (97%) of race teams stayed overnight in the township of Goulburn. On average, race teams spent an average of $1,425 per trip. Based on the average size of race teams, this equates to $443 per person. The most common and biggest expenses for race teams and competitors consisted of travel/transport (32%), accommodation (28%) and food and drink – take away (15%). Based on findings from the survey, an average of 73% of all race team expenditure items were purchased in the Goulburn region, highlighting that businesses in the Goulburn region receive the greatest economic benefit from competitors at Wakefield Park Raceway. Wakefield Park Economic Impact Assessment 18
SUMMARY OF RACE TEAM ENTRANT SURVEY RESULTS

This section summarises the results from the online race team survey distributed to competitors of the CAMS
NSW State Championships, HSRCA Historic Autumn event and the Australian Superbikes Championship.
Origin
Based on findings from the survey results, race teams travelled from a variety of areas throughout Australia to
compete at Wakefield Park Raceway. The majority of race teams travelled from the east coast of NSW including
the Southern Highlands, Metropolitan Sydney, Wollongong, Central Coast and Newcastle.
A proportion of race teams also travelled from Queensland, ACT, Victoria and South Australia. The origin of race
teams is shown below. The figure shows that:
•    64% of race teams travelled from Metropolitan Sydney, Newcastle, Central Coast, Wollongong and Southern
     Highlands;
•    11% of race teams travelled from Queensland;
•    8% of race teams travelled from Victoria;
•    7% of race teams travelled from Other NSW (regional);
•    5% of race teams travelled from the ACT;
•    3% of race teams travelled from South Australia; and
•    1% of race teams travelled from Tasmania.

Race Team Origin
Source: Intercept Survey for CAMS NSW State Championship / HSRCA Historic Autumn / Australian Superbikes Championship 2017
Note 1: Circles represent the locational catchment of race team origin and do not relate to the size of the market.

Wakefield Park Economic Impact Assessment                                                                              19
Overnight and Day Trip Race Team Visitors
90% of race teams stayed overnight and 10% visited the Raceway as a day trip only.
Of the race teams who stayed overnight, 56% stayed two nights, 23% stayed three nights, 6% stayed one night and
5% stayed four nights.
The average length of stay for race teams was 2.1 days.
F9. RACE TEAMS STAYING OVERNIGHT
5% Daytrip
10% only
6% 1 night
23%
2 nights
3 nights
56%
4 nights
Source: Online Race Team Survey for CAMS NSW State Championship / HSRCA Historic Autumn / Australian Superbikes Championship 2017
Figure 11 shows the location of race teams who stayed overnight. The majority (97%) stayed in the township of
Goulburn.
F10. LOCATION OF OVERNIGHT VISITORS
0% 20% 40% 60% 80% 100% 120%
Goulburn 97%
Other location in NSW 2%
Bowral / Mittagong 1%
Source: Online Race Team Survey for CAMS NSW State Championship / HSRCA Historic Autumn / Australian Superbikes Championship 2017
Wakefield Park Economic Impact Assessment 20RACE TEAM ENTRANT / COMPETITOR EXPENDITURE
Race Team Expenditure – Stayed Overnight
On average, race teams (overnight visitors) spent $1,597 per trip. Based on the average size of race teams, this
equates to $496 per person.
The most common and biggest expenses for race teams consisted of accommodation (32%), travel/transport
(27%) and food and drink (22%).
Of the $1,597, 72% was purchased within the Goulburn region and 28% was purchased outside of the Goulburn
region. Key expenditure items purchased within the Goulburn region included dining out (95%), accommodation
(93%), shopping (83%) and groceries (83%).
T9. ITEMISED RACE TEAM EXPENDITURE (PER TEAM) – OVERNIGHT VISITORS - WAKEFIELD PARK
RACEWAY
Within the Outside the
Total Proportion
Goulburn Region Goulburn Region
Travel/transport (including petrol) $302 $206 $509 32%
Accommodation $405 $32 $437 27%
Shopping (excluding groceries and
$55 $11 $66 4%
alcohol)
Food and drink - take away $74 $27 $101 6%
Food and drink - dining out (e.g. cafes,
$241 $13 $254 16%
restaurants)
Groceries (including alcohol) $80 $15 $95 6%
Attractions/activities/tours/entertainment $10 $1 $10 1%
Other supplies $21 $8 $29 2%
Other services $14 $10 $25 2%
Other $5 $64 $70 4%
TOTAL $1,209 $388 $1,597 100%
Source: Online Race Team Survey for CAMS NSW State Championship / HSRCA Historic Autumn / Australian Superbikes Championship 2017
T10. LOCATION OF RACE TEAM EXPENDITURE – OVERNIGHT VISITORS - WAKEFIELD PARK RACEWAY
Within the Goulburn Region Outside the Goulburn Region
Travel/transport (including petrol) 59% 41%
Accommodation 93% 7%
Shopping (excluding groceries and alcohol) 83% 17%
Food and drink - take away 73% 27%
Food and drink - dining out (e.g. cafes,
95% 5%
restaurants)
Groceries (including alcohol) 84% 16%
Attractions/activities/tours/entertainment 94% 6%
Other supplies 73% 27%
Other services 58% 42%
Other 7% 93%
AVERAGE 72% 28%
Source: Online Race Team Survey for CAMS NSW State Championship / HSRCA Historic Autumn / Australian Superbikes Championship 2017
Wakefield Park Economic Impact Assessment 21Race Team Expenditure – Day Trip Only
On average, race teams (day trip visitors) spent $364 per trip. Based on the average size of race teams, this equates
to $113 per person.
The most common and biggest expenses for race teams consisted of travel/transport (51%), other supplies (21%)
and food and drink – take away (12%).
Of the $364, 69% was purchased within the Goulburn region and 31% was purchased outside of the Goulburn
region. Key expenditure items purchased within the Goulburn region included dining out (100%), other services
(100%), other supplies (99%) and take away food and drink (88%).
T11. ITEMISED RACE TEAM EXPENDITURE (PER TEAM) – DAYTRIP VISITORS – WAKEFIELD PARK RACEWAY
Within Goulburn Outside the Goulburn Proportion
Total
Region Region (%)
Travel/Transport (including petrol) $80 $106 $186 51%
Accommodation $0 $0 $0 0%
Shopping (excluding groceries and alcohol) $10 $8 $18 5%
Food and drink - take away $38 $5 $43 12%
Food and drink - dining out $30 $0 $30 8%
Groceries (including alcohol) $0 $5 $5 1%
Attractions/ activities/ tours/ entertainment $0 $0 $0 0%
Other supplies $75 $1 $76 21%
Other services $5 $0 $5 1%
Other $0 $0 $0 0%
TOTAL $239 $125 $364 100%
Source: Online Race Team Survey for CAMS NSW State Championship / HSRCA Historic Autumn / Australian Superbikes Championship 2017
T12. LOCATION OF RACE TEAM EXPENDITURE – DAYTRIP VISITORS – WAKEFIELD PARK RACEWAY
Within Goulburn Region Outside the Goulburn Region
Travel/Transport (including petrol) 43% 57%
Accommodation 0% 0%
Shopping (excluding groceries and alcohol) 56% 44%
Food and drink - take away 88% 12%
Food and drink - dining out 100% 0%
Groceries (including alcohol) 0% 100%
Attractions/ activities/ tours/ entertainment 0% 0%
Other supplies 99% 1%
Other services 100% 0%
Other 0% 0%
Average 69% 31%
Source: Online Race Team Survey for CAMS NSW State Championship / HSRCA Historic Autumn / Australian Superbikes Championship 2017
Wakefield Park Economic Impact Assessment 22Race Team Expenditure – Overnight & Day Trip
This section assesses all race team expenditure, i.e. both race teams that visited for the day only and race teams
that stayed overnight.
On average, race teams spent $1,425 per trip. Based on the average size of race teams, this equates to $443 per
person.
The most common and biggest expenses for race teams and competitors consisted of travel/transport (32%),
accommodation (28%) and food and drink – take away (15%).
Of the $1,425, 73% was purchased within the Goulburn region and 27% was purchased outside of the Goulburn
region. Key expenditure items purchased within the Goulburn region included attractions and entertainment (96%),
dining out (95%), accommodation (93%) and groceries (84%).
T13. ITEMISED RACE TEAM EXPENDITURE (PER TEAM) – ALL VISITORS - WAKEFIELD PARK RACEWAY
Within Goulburn Outside the
Total Proportion
Region Goulburn Region
Travel/Transport (including petrol) $280 $195 $475 32%
Accommodation $363 $29 $392 27%
Shopping (excluding groceries and alcohol) $50 $11 $61 4%
Food and drink - take away $71 $25 $96 7%
Food and drink - dining out $219 $12 $231 16%
Groceries (including alcohol) $72 $14 $86 6%
Attractions/ activities/ tours/ entertainment $9 $1 $10 1%
Other supplies $27 $7 $34 2%
Other services $13 $9 $22 1%
Other $5 $58 $63 4%
Total $1,109 $361 $1,470 100%
Source: Online Race Team Survey for CAMS NSW State Championship / HSRCA Historic Autumn / Australian Superbikes Championship 2017
T14. LOCATION OF RACE TEAM EXPENDITURE (PER TEAM) – ALL VISITORS – WAKEFIELD PARK RACEWAY
Within Goulburn Region Outside the Goulburn Region
Travel/Transport (including petrol) 59% 41%
Accommodation 93% 7%
Shopping (excluding groceries and alcohol) 83% 17%
Food and drink - take away 74% 26%
Food and drink - dining out 95% 5%
Groceries (including alcohol) 84% 16%
Attractions/ activities/ tours/ entertainment 96% 4%
Other supplies 82% 18%
Other services 59% 41%
Other 7% 93%
Average 73% 27%
Source: Online Race Team Survey for CAMS NSW State Championship / HSRCA Historic Autumn / Australian Superbikes Championship 2017
Wakefield Park Economic Impact Assessment 23You can also read