WARNING SIGNS - THEDOWTHEORY.COM
←
→
Page content transcription
If your browser does not render page correctly, please read the page content below
l
                                                     st
                                         January 1 , 2021
Dow Theory for the 21st Century           Schannep Timing Indicator          COMPOSITE Indicator

                        Warning Signs
                                                                             Dow Jones: 30,606.48
Overview: The stock market is always looking ahead, usually in                S&P 500: 3,756.07
the 4-to-6-month range. We’re not sure what it sees. 2020                     NYSE: 14,524.80
produced more than enough drama: a worldwide epidemic, with
unexpected deaths totaling over 1.8 million worldwide (over 340,000 in the U.S, 1/10th of one
percent of our population, but still a disaster), a vaccine to “end it all” but that will not be a quick,
easy solution by any means. The pandemic will undoubtedly linger and the economy will improve,
though at a slower rate than the stock market wants. Almost all forecasters are expecting the
market to rise to at least 4,000 on the S&P500 by the end of 2021 (“Stock-market pros are having
a tough time imagining an S&P 500 slump in 2021” - MarketWatch 12/26/20).
l
st
January 1 , 2021
Perhaps the offsetting good news is that travel numbers from the Transportation Security
Administration (TSA) continue to increase, which should support the Dow Transportation average
advancing. This chart shows increases every day from the prior week’s same day. While there was
no overall growth during this vs last year’s same period, there has been a doubling over the last 6
months vs a decline in the prior Total Traveler Throughput. We all know there is no faster way to
travel coast-to-coast and in between, except to fly. Two Exchange Traded Funds that cover this
industry are the JETS (U.S. Global Jets) and IYT (Transportation Average).
TSA checkpoint travel numbers for 2020 and 2019
Manuel has done considerable work on “divergences,” by which he means days where the Dow
Industrials closed-up, whereas the Dow Transportation closed down and vice versa. His exhaustive
tests have shown that divergences do not necessarily result in declining prices but tend to be
harbingers of sideways movements for periods spanning several weeks.
The current technical picture seems to favor sideways movement or, at least, very mitigated
upward movement. In the last 22 trading days (ca. 1 trading month), there have been 6 days with
a divergence between the Dow Industrials and Dow Transportation. My tests tell me that the less
divergence, the more performance. Specifically, in order to have SOLID results I tested a break-
up system with lookback periods ranging from 10 to 40 days for both entries and exits inl
st
January 1 , 2021
increments of 2 days (10, 12, 14, 16, etc.). There were a total of 200 runs, creating quite an
exhaustive test.
I also performed a test based on direction (not on the total count of diverging days). When over
several days the Dow Transports have negative performance (as with our current situation)
whereas the Dow Industrials remains positive, such a divergence tends to foreshadow subpar
performance; not necessarily negative performance but diminished profits. So, any way we cut it,
divergence is a headwind for ascending prices. Caveat: Divergence does not entail an immediate
retreat of prices. There is usually a lag, so it does not necessarily jeopardize our Rule of 7 target.
Too many divergences piling up in a short period of time tend to signal, at the very least subpar
performance. This is our situation right now.
Last month, Manuel noted that small-cap stocks were much stronger than large-cap stocks. “This
may be indicative of a Bull market in good health, given that the first stocks that in most instances
begin to fall when a bull market tops are small-cap”. A current look shows this trend could be
changing.l
st
January 1 , 2021
Rule of 7 Update: You may remember that the “Rule of Seven” had a target from our May 2019
Letter for the market top to be 29,316 on the Dow Industrials, which was attained on February 12th
of this year. The actual high was 29,551,l
st
January 1 , 2021
Schannep TIMING ↓INDICATOR: This proprietary market timing Indicator is BUY
(GREEN) from 50% bought on 4/6/20 at the 22,679.99 level and 50% previous bought on 2/19/19
at the 25,891.32 level, for an average of 24,285.65. Momentum has been very positive the last two
months and the monetary status continues extraordinarily positive; therefore, this Indicator is also
still very positive.
The COMPOSITE Timing Indicator: This is our primary major-trend timing Indicator which
we follow in our real-money portfolio shown at the end of each Letter. It is also in a BUY
(GREEN) from 4/6/20 at the 24,022.57 average level from the Buys from the Schannep Timing
Indicator and the Dow Theory for the 21st Century Buys. With no Sell signal on either of the above
two Indicators, this Indicator is 100% invested. The portfolio stands over $115,000 above a year
ago and at a new record level, up 19.5% from last year’ January 1st.
On US interests rates: Hamilton wrote that the Dow Theory lends itself well to other markets,
not just stocks. One market particularly suited for the application of the Dow Theory is US bonds.
They sport nice trends that tend to persist and are not prone to false breakouts. Personally, we use
TLT and IEF as our proxies for long-term (20 years +) and medium-term (7-10 years) US interest
rates. While we are often reminded that US interest rates may go negative, the charts seem to
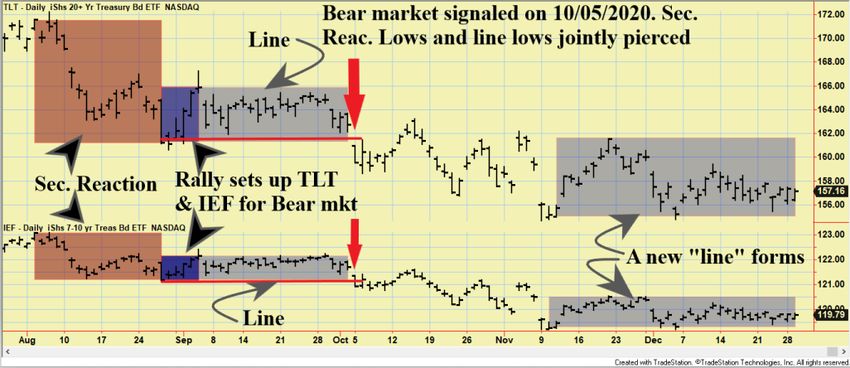
negate this possibility (at least for the next months) as on 10/05/20 a primary Bear market signal
was given which implies higher interest rates. The final Bull market highs were made on 8/04/20.
From that date both ETFs declined until 8/28/20. The decline qualified as a secondary reaction
(highlighted in brown in the charts below). Off the secondary reaction lows there was a rally that
ended on 9/03/20 (blue rectangles). That rally setup TLT and IEF for a Bear market signal.
Following the 9/3/20 rally highs both ETFs remained in no-man’s land for several weeks as
volatility contracted and formed a “line” (narrow range area, shown as light blue rectangles). On
10/5/20, TLT and IEF jointly broke downside both the secondary reaction and line closing lows,
which was certainly bearish. If you look at the charts below you will see that following the Bear
market signal there has been a succession of lower highs and lower lows. Not a bullish picture.
From 11/10/20 to date, a new “line” has formed. If it were jointly broken up, it would be the first
bullish indication in many months. A confirmed break-down would reconfirm the Bear market.l
st
January 1 , 2021
The BOTTOM LINE: There’s a reason that Up and Down have an alternative: Sideways. The
Fear & Greed Index and the American Association of Individual Investors Investor Sentiment
Index are not showing any particular enthusiasm one way or the other. And so sideways makes a
lot of sense to us. With the “target” so close and some signs of change to the downside showing
up, we are cautious, even as our Indicators show no caution ....yet.
We Wish you a Happy, Healthy, and Prosperous New Year!
Jack Schannep
Editor
Manuel Blay
Co-Editor
for TheDowTheory.com Team
Historically we have tracked the performance of one of my ACTUAL ROTH IRA
portfolios, fully following the Composite Timing Indicator’s signals which is currently
100% invested.
For longer-term results see The Composite Timing Indicator which we use for timing in our
Portfolio verses Buy and Hold. FYI, over the last 65 years Buy & Hold has grown at a 10.6%
annual rate whereas The Composite has grown at a 13.3% rate. The problem with showing this
real-money Portfolio is that it represents only what I am doing, which could be very different from
others. Subscribers use this letter for Market Timing, which could include shorting, going long,
even utilizing leveraged investments that could double or triple – in either direction. These results
have been monitored by several independent sources that track our performance such as Hulbert
Financial Digest, DowTheoryInvestments.com, CXO Advisory Group and TimerTrac.com.
This Letter concentrates on the big picture, the trend of the major stock market indexes which
usually influences the price direction of most individual stocks.l
st
January 1 , 2021
The Dow Theory is a form of technical analysis that relies on detecting trends in the stock market
to determine an investment strategy. The detection of these trends may be interpreted differently
by different analysts and the opinions expressed on this website may not be shared by other
individuals who apply the same principles of The Dow Theory. Past performance is not an
indication of future returns. It should not be assumed that any recommendations made will be
profitable or without the risk of loss or will equal the performance of the benchmark portfolio. All
investments involve the risk of potential investment losses as well as the potential for investment
gains. The performance of any portfolio or investment strategy should be viewed in the context of
the broad market and prevailing economic conditions.You can also read