When is Their Best Not Good Enough? - Matthew J. Marvin CLPE, CFWE Laboratory Director Ron Smith and Associates, Inc - Onin.com
←
→
Page content transcription
If your browser does not render page correctly, please read the page content below
When is Their Best Not Good
Enough?
Matthew J. Marvin CLPE, CFWE
Laboratory Director
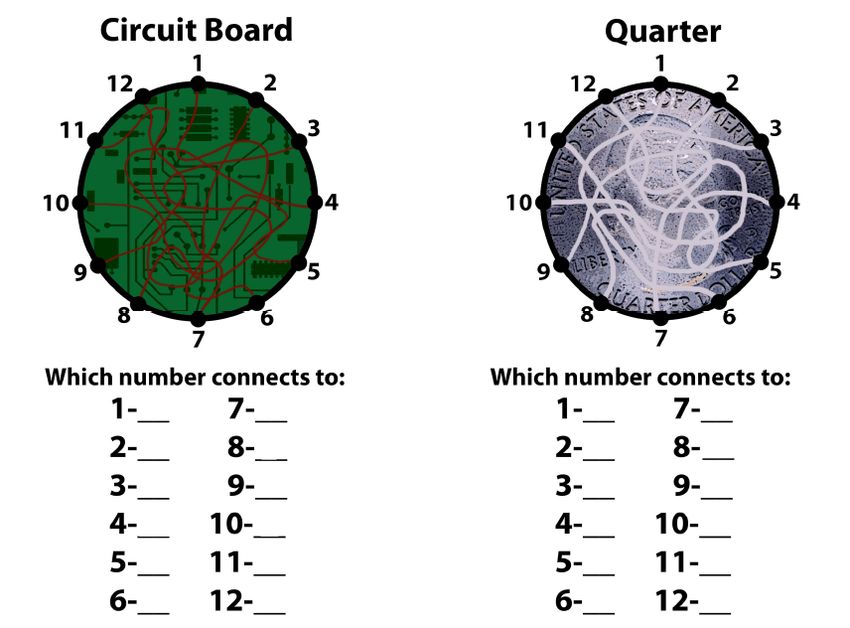
Ron Smith and Associates, Inc.Form Blindness • “Form-blindness is a combined physical and mental fault, an imperfection in the brain which causes the inability to interpret and correctly store what is actually focused on the human retina” – Byrd and Bertram, 2003. • “The inability to see minute differences in form regarding shapes, curves, angles and size.” – Michele Triplett’s Fingerprint Dictionary.
Measuring What Matters
• No correlation between ability to efficiently
  and accurately conduct comparisons and:
  – Age*
  – Level of Education
  – Area of Study*
  – Gender
  – Martial Status
  – Race*
  – Color Blindness
Measuring What Matters
• There is one correlating factor:

       FORM BLINDNESS
Byrd and Bertram, 2003 • “The problem that most agencies have with form-blindness testing is that there has never been any research to validate these testing procedures as accurate or reliable.”
Validation
1) Face Validity - theoretical, articles of existence, old ways of testing
2) Predictive Validity - how well it can be predicted using tests
3) Content Validity - does the content measure what it is supposed to
4) Construct Validity - performance measures on test are consistent with predictions
Face Validity
This was determined using existing written material with the following conclusions:
1) Literature contends that form blindness occurs in the brain, not the eye.
2) Literature claims that the majority of persons do not have form blindness.
3) Literature states that the ability to see minute differences in angles, shapes, and
   sizes is an ability not everyone possesses
Predictive Validity
How well can these tests predict success in a latent print examiner training program?

1) Byrd, Jon S. and Bertram, Dean J., “Form Blindness,” May/June 2003, 53(3)
   Journal of Forensic Identification, pp. 315-341
2) Bertram, Dean J., Carlan, Philip E., Byrd, Jon S., and White, Joseph L.,
   “Screening Potential Latent Fingerprint Examiner Trainees: The Viability of Form
   Blind Testing,” July /August 2010, 60(4) Journal of Forensic Identification, pp.
   460-476
Byrd, Jon S. and Bertram, Dean J.
         “Form Blindness,”
• 111 students participated in the study over
  the course of one year
• Each student was given two different pre-
  tests, both of which were form blindness tests
• Comparison test was given at the end of the
  training as the post-test.
• Found significant correlation between high
  scores on the pre-test and high scores on the
  post-test.
Bertram, Dean J., Carlan, Philip E., Byrd, Jon S., and White,
Joseph L.
Screening Potential Latent Fingerprint Examiner Trainees: The
Viability of Form Blind Testing
• 327 students participated in the study over a five-year period.
• Similar study design
• Students with fingerprint training scored 35% higher on the fingerprint
comparison post-test than those who were not trained.
• Students with lower scores on the form blindness pre-test scored
significantly lower on the fingerprint comparison test.
• Fingerprint comparison scores do not differ significantly along
demographic lines.
• Fingerprint comparison scores can be reliably predicted from form
blindness performance measures; ie test scores indicate an ability level.Content Validity Can the content of the test developed by RS&A determine the variability in visual acuity skills? RS&A Developed Visual Acuity Test #112: Test consists primarily of form blindness tests developed by RS&A in consultation with Dr. Itiel Dror. The only additional non-form blindness content to the test was a color-blind section based on the most common colors experienced in latent print processing.
RS&A Visual Acuity Test #112
• 1 hour to complete the test.
Scoring

•   Excellent = 90-100 points
•   Average = 80-89 points
•   Below Average = 70-79 points
•   Poor = 69 or less
RS&A Visual Acuity Test #112
             Given to 118 High School Students
   Check for Variability in Visual Acuity Skills

                     High School Validation Results (Test #112)

Score Range             Test Category           # of Incorrect Answers   #of Respondents

  100 - 90                Excellent                    0 to 10              18 (15%)

   89 - 80                Average                     11 to 18              43 (37%)

   79 - 70             Below Average                  19 to 30              39 (33%)

69 and below                Poor                        31 +                18 (15%)

                                                                           Total - 118
RS&A Visual Acuity Test #112
Given to 85 College Students Majoring in Forensic Science
who were told this would count for a grade.
College Validation Results (Test #112)
Score Range Test Category # of Incorrect Answers #of Respondents
100 - 90 Excellent 0 to 10 36 (42%)
89 - 80 Average 11 to 18 28 (33%)
79 - 70 Below Average 19 to 30 10 (12%)
69 and below Poor 31 + 11 (13%)
Total - 85
Both tests support that not all persons have an equal ability
to discern minute differences in angles, shapes, and sizes,
which are common elements in friction ridge comparisons.Construct Validity
Can the test being used predict success in a latent print training program?
• The same 85 college students were given a final comparison exam at the
completion of the course. The 85 students were told that the final comparison exam
would count for 1/3 of their final grade.
College Validation Results (Test #112)
Test #112 Score #of Respondents Final Comparison Score #of Respondents
100 - 90 36 (42%) 100 - 90 32 (38%)
89 - 80 28 (33%) 89 - 80 30 (35%)
79 - 70 10 (12%) 79 - 70 15 (18%)
69 and below 11 (13%) 69 and below 8 (9%)
Total - 85 Total - 85International Latent Print Examiner
Training Academy Results
RS&A Academy Validation Results (Test #112) (through 2019/20)
Score Range Test Category # of Incorrect Answers #of Respondents
100 - 90 Excellent 0 to 10 63 (76%)
89 - 80 Average 11 to 18 18 (22%)
79 - 70 Below Average 19 to 30 3 (2%)
69 and below Poor 31 + 0 (0%)
Total - 84Visual Acuity Comparison
VA Rank Final Comparison Score For Entire Academy For All Errors
Score Class Rank
Student # 51 91.5 16 99.5% 3
Student # 52 89 17 99.3% 8
Student # 53 88 19 98.8% 13
Student # 54 99.5 5 99.1% 17
Student # 55 85 21/23 97.3% 22/23
Student # 56 100 1 99% 7
Student # 57 98 7 98.3% 18
Student # 58 92 15 98.3% 11
Student # 59 93 14 96.4% 23
Student # 60 95 12 97.8% 18
Student # 61 94 13 98.4% 9
Student # 62 98 7 98.5% 9
Student # 63 100 1/23 99.6% 1/23
Student # 64 99 6 99% 6
Student # 65 87 20 98.5% 13
Student # 66 97 10 99.4% 5
Student # 67 97 10 98.4% 20
Student # 68 85 21/23 99.5% 2/23
Student # 69 98 7 98.5% 15
Student # 70 100 1 98.4% 12
Student # 71 89 17 98.4% 15
Student # 72 85 21/23 97.8 21/23
Student # 73 100 1 99.6 3Visual Acuity VA Rank Final Comparison Score For Entire Academy For All Errors Comparison Class Rank
Score
Student #20 72 9/9 91.4% 8/9
Student #48 77 9/10 98.9% 6/9
Student #50 75 10/10 Removed From Academy At Week 14 10/10Conclusions • The visual acuity test not only predicts how well a student will do in the program, but more importantly, it accurately predicts their visual ability level which is of the highest concern when training someone in a comparative science. • Visual Acuity is not the only factor that makes a good trainee or examiner. • Form Blindness does not appear to be something you have or don’t have, but rather can manifest in varying degrees. • There is a level of ability to distinguish forms below which an examiner is unable to overcome this deficiency despite their motivation or the motivation of the trainer.
References
1) Ashbaugh, David R., “Ridgeology” Journal of Forensic Identification, 41(2), January/February
   1991, p.16
2) Ashbaugh, David R., “Quantitative-Qualitative Friction Ridge Analysis: An Introduction to Basic
   and Advanced Ridgeology”, 1999, pp.103-108
3) Byford, William, “Recruiting and Testing Fingerprint Experts & Crime Scene Examiners: A
   Research and Development Project” Unpublished
4) Byrd, Jon S. and Bertram, Dean J., “Form Blindness,” May/June 2003, 53(3) Journal of Forensic
   Identification, pp. 315-341
5) Bertram, Dean J., Carlan, Philip E., Byrd, Jon S., and White, Joseph L., “Screening Potential
   Latent Fingerprint Examiner Trainees: The Viability of Form Blind Testing,” July /August 2010,
   60(4) Journal of Forensic Identification, pp. 460-476
6) Osborn, Albert S., “Form Blindness and Proof: Sight Defects in Relation to the Administration of
   Justice” Journal of the American Institute of Criminal Law and Criminology, Vol. 30, May-
   June,1939-March-April,1940, p.243
7) Osborn, Albert S., “Questioned Document Problems” 2nd ed. New York: Boyd Printing Co., 1946
8) Osborn, Albert S., “Questioned Documents” 2nd ed. New York: Boyd Printing Co., 1946
9) Wertheim, Pat A., “The Ability Equation” Journal of Forensic Identification, 46(2), March/April
   1996, p.149
Matthew J. Marvin, CLPE, CFWE
       Laboratory Director
  Ron Smith and Associates, Inc.
mmarvin@ronsmithandassociates.com
         601-626-1100
You can also read