Winter Outlook Report - Helping to inform the electricity industry and prepare for the winter ahead - National Grid ESO
←
→
Page content transcription
If your browser does not render page correctly, please read the page content below

Winter Outlook Report
Helping to inform the electricity industry
and prepare for the winter ahead

6 October 2022

Executive summary
                            Since last winter the world has                 standard1, although we expect there to                        (generation, storage, interconnection
                            fundamentally changed with the                  be days where we will need to utilise                         etc.) is available in line with
                            invasion of Ukraine by Russia. With this        many of the tools in our operational                          commitments secured under the
                            backdrop the ESO presents the Winter            toolkit, including use of system notices2.                    Capacity Market, we have also modelled
                            Outlook. Building on the Early View of                                                                        a scenario whereby the energy crisis in
                            Winter, this document presents a more           Given the scale of uncertainty and risks                      Europe results in electricity not being
                            detailed view focusing on the upcoming          associated with the current geopolitical                      available to import into Great Britain
                            winter in Great Britain. This Winter            situation we have developed a range of                        from continental Europe. This could be
                            Outlook covers the period from 31               new tools, including:                                         due to a combination of factors,
                            October 2022 to 31 March 2023. The                                                                            including a shortage of gas in Europe
                            data freeze date for this outlook was 22        ▪ Publishing an early view of winter to                       (which in turn limits power generation in
                            September 2022.                                   help the market understand risks                            Europe) and / or generation
                                                                                                                                          unavailability (e.g., due to a high level of
                            This Winter Outlook is developed in the         ▪ contracting to retain approximately
                                                                                                                                          outages across the French nuclear
                            context of unprecedented turmoil and              2GW of coal fired generation that
                                                                                                                                          fleet).
                            volatility in energy markets in Europe            would otherwise have closed
    Fintan Slye             and beyond and, as we stated earlier in                                                                       We have also considered the scenario
                                                                            ▪ and introducing an innovative
                            the year, shortfalls of gas in continental                                                                    where there is a shortfall of gas
                                                                              Demand Flexibility Service to
    Director, Electricity   Europe could have a range of knock-on
                                                                              incentivise customers to reduce
                                                                                                                                          available in Great Britain.
    System Operator         impacts in Britain. Therefore, in this
                                                                              consumption at periods when
                            Winter Outlook in addition to our Base
                                                                              margins are tight.
                            Case, we also set out scenarios to
                            illustrate the implications should some of      Notwithstanding the
                            those risks to security of energy               mitigation measures noted above, it
                            supplies materialise.                           is highly likely that the wholesale price
                                                                            of energy (both gas and electricity) will
                            Our central view remains, as set out
                                                                            remain very high throughout the winter
                            in the Base Case, that there will be
                                                                            outlook period3.
                            adequate margins (3.7GW / 6.3%)
                            through the winter to ensure Great              While our Base Case assumes that
                            Britain remains within the reliability          capacity across all providers
                                                                         1 The reliability standard is 3 hours Loss of Load Expectation (LOLE). Modelling shows the Base Case LOLE to be 0.2 hrs,
                                                                         well within the standard.
                                                                         2 These would include Electricity Margin Notices (EMNs), Capacity Market Notices (CMNs) etc.
                                                                         3 This will also lead to higher balancing costs as the costs of each required action are linked to the wholesale price of
                                                                         electricity as bid into the Balancing Mechanism or offered for trades on interconnectors.

2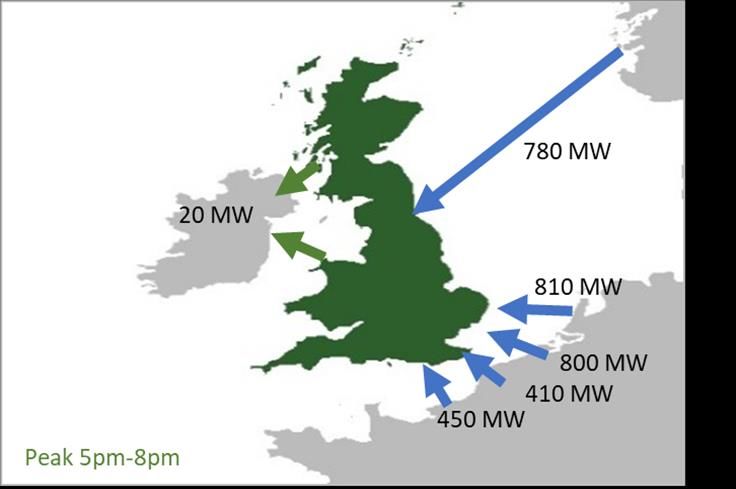
Executive summary

    Our first illustrative scenario examines what would happen if there were no electricity                                   deployed to minimise the disruption.
    imports from continental Europe4. In this scenario we would deploy our
    mitigation strategies – dispatching the retained coal units and our Demand Flexibility                                    Overall, this is likely to be a challenging winter for energy supply throughout Europe.
    Service. By securing 4GW 5 through these actions, we would maintain adequate                                              We have taken extensive measures to try to mitigate the impacts for British
    margins and mitigate impacts on customers.                                                                                consumers and expect that, under our base case, margins will be adequate.
                                                                                                                              Nevertheless, there remain scenarios, driven principally by factors outside of Great
    Our Demand Flexibility Service is new and innovative, and we have worked with                                             Britain which could impact upon British electricity supplies. Plans are in place to
    suppliers, aggregators, industry, Ofgem and BEIS on the design to ensure it is ready                                      ensure the impact is minimised and the overall security and integrity of
    for the winter and capable of delivering the required level of participation and                                          Britain’s energy systems are protected.
    response (2 GW+). It will launch on 1 November, and we are encouraging suppliers
    and aggregators to work with their customers to ensure the highest levels of                                              This document only covers the electricity outlook for the winter ahead; the Gas Winter
    engagement and participation. We see particular potential from commercial                                                 Outlook can be found here.
    organisations who can shift their load from peak hours and have had
    positive feedback from British companies on this.
                                                                                                                              For more information, you can email us at marketoutlook@nationalgrideso.com
    Without the Demand Flexibility Service, we would expect to see a reduction in
    margins. In this scenario on days when it was cold (therefore likely high demand), with
    low levels of wind (reduced available generation), there is the potential to need to
    interrupt supply to some customers for limited periods of time in a managed and
    controlled manner. However, we expect the mitigations outlined above to be effective.
    A second, more extreme scenario, looks at a hypothetical escalation of the energy
    crisis in Europe such that there is insufficient gas supply available in Great Britain
    (in addition to no electricity available to import from continental Europe as per above
    scenario). In the unlikely event that escalation of the situation in Europe means that
    insufficient gas supply were to be available in Great Britain this would further
    erode electricity supply margins6 potentially leading to interruptions to customers for
    periods. All possible mitigating strategies, including our new measures, would be

    4 The scenario assumes no electricity imports available from France, Netherlands and Belgium; 1.2 GW imports from Norway; 0.4 GW exports to Northern Ireland & Ireland.
    5 We expect the additional coal units to provide 2 GW and therefore the Demand Flexibility Service would need to provide 2 GW.
    6 Due to the curtailment of gas supplies to gas fired power stations in GB for example CCGTs etc.

3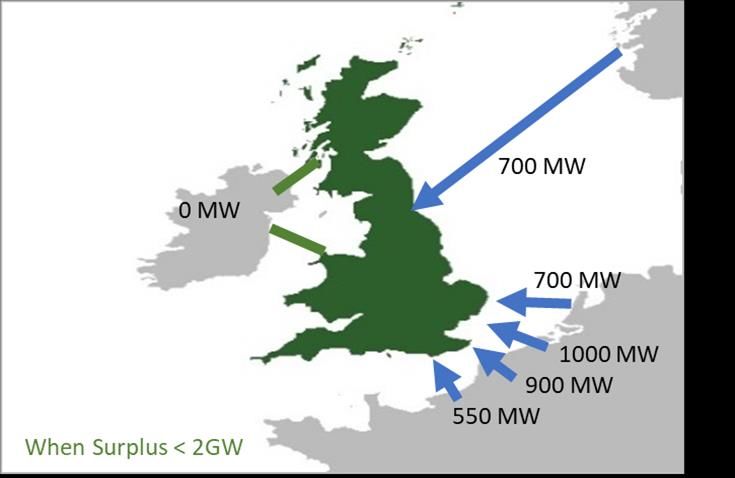
Contents

               Executive summary                   3
                                                   2
               Base case                           5
               Winter scenarios                    8
               Scenario 1                          9
               Scenario 2                          10
               Demand                              11
               Supply                              12
               Europe and interconnected markets   14
               Market prices                       18
               Appendices                          19
               Glossary                            21

4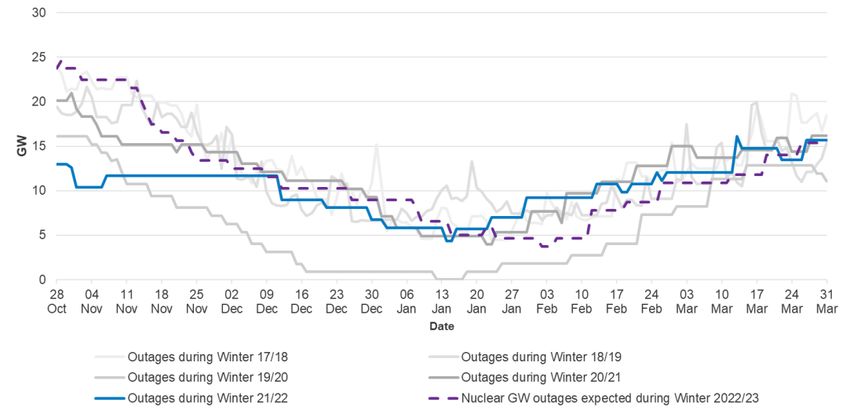
Base Case / System margins
      System margins are expected to be adequate in our Base Case.
      Notwithstanding this we expect there may be days when we need
      to use our operational tools.
      The de-rated margin of 3.7GW (6.3%) is similar to both our Early View of Winter and
      margins that we have had in recent years.
                   • The Base Case loss of load expectation (LOLE) is around 0.2 hours/year,
                     which is within Reliability Standard of three hours per year set by
                     Government.
                   • Our base case assumes electricity imports from Europe are available at times
                     when we need them to meet demand, delivering in line with their Capacity
                     Market agreements, and that there is no disruption to gas supplies.
                   • Our base case does not assume any material reduction of consumer demand
                     due to high energy prices. It does not include any of our mitigation measures
                     such as coal contracts or the Demand Flexibility Service as we would not                                               Figure 1. Supply margin in relation to generation capacity and demand
                     expect to deploy them here.
      The chart in Figure 2 shows the de-rated margins included in previous Winter Outlook
      Reports and highlights how this year’s de-rated margin is similar to those in some
      recent winters (e.g. 2015/16, 2016/17 and 2021/22).
      If there are some tight periods this winter, we may need to use our standard operational
      tools such as issuing Electricity Margin Notices (EMNs). Capacity Market Notices
      (CMNs) may also be issued. We expect there to be sufficient available supply to
      respond to these signals to meet demand.

                                                                                                                                               Figure 2. Historic de-rated margin forecasts made ahead of each winter in the
                                                                                                                                               Winter Outlook Report (i.e. not out-turns)1

5
    1 Includes   additional reserves (Supplemental Balancing Reserve and Demand Side Balancing Reserve – SBR and DSBR) of 2.4 GW and 3.5 GW procured in 2015/16 and 2016/17 respectively.
Base Case / Operational Surplus
    Our base case operational view shows sufficient
    operational surplus for each week of winter.

    This winter we expect
    • normalised weather corrected transmission system
      demand to be met in the Base Case before using any
      operational tools
    • Average Cold Spell (ACS) transmission demand to be
      met under our base case with utilisation of our
      operational tools (e.g. system notices)
    • normalised peak transmission demand to occur in mid
      December or early January, based on our latest forecasts
    • the minimum operational surplus is currently projected to
      be lowest in mid-December when these forecasts are
      combined with current generator submissions.

                                                                            Figure 3. Day-by-day view of operational surplus for winter 2022/23 (based on market data submissions from 22 September)
     How our assessments are developed
     As we get closer to winter, we move from an assessment that considers the winter as a whole, to one where we consider much greater temporal granularity on a week-by-week and
     day-by-day basis. This is our operational modelling. It includes actual plant outages, current weather patterns and price differentials that drive interconnector flows. It is based on
     transmission demand and generation, and therefore represents the perspective from our control room based on what the market is currently intending to provide (i.e. before use of our
     operational tools). Our operational modelling helps to identify when tight periods are most likely to occur, and to indicate when we may need to use our operational tools to manage
     margins. These periods do not necessarily occur at times of peak demand. This view will change throughout winter, based on weather and changes to plant outages.
     Our Base Case operational view assumes imports from Continental Europe in line with Capacity Market agreements. It also assumes 750MW exports to Ireland, which is based on
     long-term historic flows. However, we have observed that the flows on Irish interconnectors have become much more variable in recent years (see page 17) and could reverse
     direction in the event of tight periods in Great Britain, responding to market signals. Our Base Case operational view does not include potential market responses to higher demand or
     tighter conditions, such as power stations increasing their output levels for short periods. Nor does it include our mitigation measures for winter (i.e. the contingency coal contracts or
     the Demand Flexibility Service). During periods of low operational surplus, generators may be incentivised to reschedule planned outages by Capacity Market obligations or through
     revenue opportunity from higher market prices. ACS demand has historically always occurred between the first week in December and the first week in February, but never during the
     Christmas fortnight or on a weekend.

6
Base Case / Credible range
    We expect to have sufficient operational surplus throughout winter
    in our Base Case, even when we consider the expected natural
    variation of demand, wind and outages.
    This winter we expect                                                                      Did you know?

    • to have sufficient operational surplus throughout winter when routine tools such as      Figure 3 shows a particular view of generation and demand from which you can extract
      margin notices are used                                                                  a single view of operational surplus. However, a single view is not appropriate in
                                                                                               assessing the potential risk due to natural variation in demand, wind, outages etc.
    • tight margins to be likely throughout December to mid-January (excluding the Christmas
      period).                                                                                 The analysis behind Figure 4 considers a situation under typical conditions, using
                                                                                               average weather conditions for demand, average availability for conventional
                                                                                               generation and average wind conditions when margin is tight.
                                                                                               To explore the variation around this central view, we simulate many possible scenarios
                                                                                               for weather, demand, conventional generation availability, wind generation output and
                                                                                               interconnector availability and, for each of these scenarios, we calculate the daily
                                                                                               surplus time series across the entire winter for that scenario. We do not include any
                                                                                               actions that could be taken by the ESO.
                                                                                               Figure 4 shows the forecast of daily surplus under our Base Case, with the shaded
                                                                                               region representing the credible region within which the surplus can fluctuate. It is
                                                                                               important to note that, although on any given day the fluctuation can reach the lower
                                                                                               bound (or dip below it), it is not credible that surplus will remain at the lower bound level
                                                                                               for the entirety of the winter.
                                                                                               We look at a day-by-day analysis, finding the daily credible range of values for the
                                                                                               surplus. By "credible" we mean a 90% confidence bound for the day-by-day fluctuations
                                                                                               in surplus between 5% and 95%
                                                                                               The modelling here considers the natural variation of forced outages. Planned outages
                                                                                               are assumed to be in line with those declared through REMIT at the time of the data
                                                                                               freeze for this report. This modelling also assumes that, for continental interconnectors,
                                                                                               market forces will allow flow into GB of whatever interconnector capacity is available
    Figure 4. Range of outcomes for the daily operational surplus in our Base Case
    under different supply and demand conditions
                                                                                               after unplanned outages.

7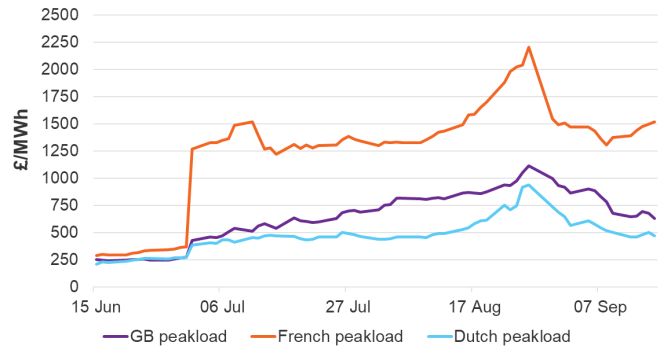
Winter scenarios
    In addition to our Base Case, we have set out two scenarios to illustrate the risks and uncertainties for winter. These scenarios
    are not forecasts and they do not indicate an expectation or likelihood of these situations materialising.

    Scenario 1: Reduced electricity imports from Europe                                    Scenario 2: Reduced electricity imports from Europe combined with insufficient
                                                                                           available gas supply in Great Britain

          Due to risks created by the invasion of Ukraine by Russia, we have modelled            We have also considered a situation where there is a shortfall of gas supply
          a scenario where the energy crisis in Europe results in electricity not being          available in Great Britain.
          available to import into Great Britain from continental Europe at times when
          we need it.                                                                            In addition to the assumptions of Scenario 1, we have chosen to model a two-week
                                                                                                 period in January in which around 10GW CCGTs are unavailable due to a gas
          This could be due to a combination of factors, including a shortage of gas in
          Europe (which in turn may limit power generation in Europe) and / or                   shortage. We continue to assume the additional coal units (around 2GW) are
          generation availability (e.g. due to a high level of outages across the French         available to dispatch by the ESO and the Demand Flexibility Service is deployed
          nuclear fleet).                                                                        (delivering around 2GW).
          This scenario assumes no electricity imports from France, Belgium and the              We have modelled this scenario to illustrate the impact on the electricity system if
          Netherlands for the whole winter. We continue to assume 1.2GW imports                  there is insufficient gas supply available in GB. For further details on the Gas
          from Norway, with a total of 0.4GW sustained exports to Northern Ireland
                                                                                                 Winter Outlook, please refer National Grid Gas Transmission’s 2022/23 Winter
          and Ireland.
                                                                                                 Outlook Report.
          In this scenario we would need to deploy our mitigation strategies, and so we
          assume the additional coal units (around 2GW) are available to dispatch by
          the ESO and the Demand Flexibility Service is deployed (delivering around
          2GW).

8
Scenario 1 / Reduced electricity imports from Europe
We expect to use coal contracts and our Demand Flexibility Service
to maintain adequate margins if imports from Europe are not
available when we need.
In this scenario we assume that we have no electricity interconnector imports from France,
Belgium and the Netherlands (these are assumed to provide a de-rated capacity of 3.9GW
in the Base Case). It is assumed that we import 1.2GW from Norway and export 0.4GW to
Northern Ireland and Ireland.
In this situation we would deploy both the contingency coal contracts (around 2GW) and the
Demand Flexibility Service (assumed around 2GW). This would result in a de-rated margin
of 3.3GW (5.7%) with an LOLE of 0.5 hours/year, broadly similar to our Base Case.
Without sufficient take-up of the Demand Flexibility Service, we would still expect margins1 Figure 5. Supply margin in relation to generation capacity and demand for Scenario 1
to be within the Reliability Standard of three hours LOLE per year. In this case, there may
be days when it was cold (therefore likely high demand), with low levels of wind (reduced
available generation), where there is the potential to need to interrupt supply to some
customers for limited periods of time in a managed and controlled manner. However, our
expectation is that our mitigation measures will be effective.
Credible range for surplus
Figure 6 shows the variation in operational surplus for Scenario 1. It uses the same
approach as outlined on page 8 to reflect the natural variation of demand, wind and
outages, for the assumptions set out for this scenario. It assumes contingency coal
contracts and the Demand Flexibility Service are deployed.
The tightest periods are from late November to January, where the daily margin often drops
below zero. This does not mean that there will be interruption to supply. It means that it is
more likely we will need to use our operational tools at these times (e.g. system notices). In
deploying both the contingency coal contracts and the Demand Flexibility Service, we
would expect to mitigate the risk of supply disruption to customers.
Figure 6. Range of outcomes for the daily operational surplus in Scenario 1 under
different supply and demand conditions
1 Assuming 0GW from the Demand Flexibility Service results in a de-rated margin of 2GW / 3.3% with an LOLE of 2.4 hours/year. The shift in margin is less than the 2GW from DFS due to the way wind (which is variable)
9 is represented as a single number through its Equivalent Firm Capacity (EFC) in the margin. The EFC value changes with system tightness even though we model its full variability in the LOLE calculation in the same way.Scenario 2 / Reduced electricity imports from Europe combined with
insufficient gas supply in Great Britain
If there is insufficient gas in GB for power generation combined with reduced
electricity imports from Europe then this could erode security of supply margins.
In this scenario we assume the same assumptions as Scenario 1, but with an additional
10GW CCGTs unavailable for a two-week period in January1. These assumptions have
been chosen to illustrate the potential impact on the electricity system if there was
insufficient gas supply in Great Britain.
As this scenario only considers a specific, limited time period within the winter, we can
only consider it using the modelling for our operational view. We are unable to provide a
de-rated margin or LOLE value for this scenario.
Credible range for surplus
Figure 7 shows the variation in operational surplus for Scenario 2. Coal contingency
contracts (around 2GW) and the Demand Flexibility Service (around 2GW) are both
assumed to be deployed.
The impact of this is evident from the large negative surplus on the chart. The
magnitude of this surplus is such that we would not expect there to be a sufficient
response from the rest of the market to prevent interruptions to consumer supplies.
Should this scenario happen, it may be necessary to initiate the planned, controlled and
temporary rota load shedding scheme under the Electricity Supply Emergency Code
(ESEC). In the unlikely event we were in this situation, it would mean that
some customers could be without power for pre-defined periods during a day –
generally this is assumed to be for 3 hour blocks. This would be necessary to ensure Figure 7. Range of outcomes for the daily operational surplus in Scenario 2 under different supply
the overall security and integrity of the electricity system across Great Britain. All and demand conditions
possible mitigating strategies would be deployed to minimise the disruption.
The extent of rota load shedding would depend on the number of CCGTs that are
unavailable and the duration for which there is insufficient gas to meet power station
demand.
10 1 We have arbitrarily assumed 9 – 23 January 2023Demand / Normal peak demand
Weather corrected peak demand for winter 2022/23 is expected to
be lower than the previous winter, but higher than winter 2020/21
which was affected by COVID-19 restrictions. Weather corrected
minimum demand is expected to be greater than last winter.
This winter we expect
• weather corrected peak transmission system demand (TSD) to be 45.3GW, based on
assumptions in Table 1.
• minimum demand under normal weather conditions to be 20.7GW (assuming no
interconnector exports overnight).
• triad avoidance of up to 0.8GW
Did you know?
The ESO is currently consulting with the energy industry on proposals for a new Demand
Flexibility Service to run between November 2022 and March 2023. This service will Figure 8. Historical and forecast normalised weekly peak winter demand1
incentivise consumers and businesses to reduce or reschedule their electricity use away
from peak times. The service will be offered by suppliers and aggregators to their
customers. Transmission connected power station demand 600MW
Base case interconnector exports to Ireland (at time of peak) 750MW
This could reduce peak demand below levels shown in the forecast in Figure 8 by up to
around 2GW. Embedded wind capacity 6.5GW
Embedded solar capacity 13.1GW
Pumped storage (at time of peak) 0GW
Table 1. Assumptions for weather corrected peak TSD demand
11
1 Data is adjusted for interconnector export, historical data is weather corrected, forecast uses normal weather.Supply / Overview
We currently expect sufficient levels of generation and interconnector
imports to meet demand throughout the winter under our base case.
This winter we expect Breakdown rates
• lower available generator capacity than last year, driven by reductions in nuclear The assumed breakdown rates are based on historic data to reflect how generators
and coal capacity available over the winter performed against their planned availability during peak demand periods over the
last three winters (see Table 2).
• generator reliability to be broadly in line with recent winters (Table 2)
For nuclear and biomass, the three-year rolling average has increased when last
• remaining coal-fired generation to potentially run more frequently due to high gas winter was accounted for. For wind generation, we assume an Equivalent Firm
prices (but for overall levels of coal generation to remain low due to continued Capacity (EFC) of 16%.
reductions in capacity levels)
Assumed Breakdown Rate
Additional coal fired generation
Power Station Fuel Type 21/22 22/23
At the request of the Department for Business, Energy and Industrial Strategy the
ESO has signed three contracts with EDF, DRAX and Uniper to provide additional Coal 11% 10%
coal generation this winter. Note, Figure 9 excludes this additional coal capacity. CCGT 6% 6%
Nuclear 9% 10%
These contracts will enable the ESO to directly instruct units at West Burton A,
OCGT 5% 7%
Ratcliffe and Drax to provide around 2GW additional de-rated capacity to support
the system this winter if required. Biomass 5% 6%
Hydro 9% 8%
These contracts are only intended to be used after all other commercial options.
Wind (EFC) 17% 16%
This could be in response to a generation shortfall over an extended period of time
Pumped storage 3% 3%
or a short-term margin issue.
Table 2. Breakdown rates by fuel type (based on a 3-year rolling average)
12Supply / Daily view
We currently expect sufficient levels of generation and interconnector
imports to meet demand throughout the winter under our base case.
Did you know?
Figure 9 shows a daily view of generation based on
generator submissions of availability which is different to
our calculation of de-rated margin for the winter on page 5.
Our generation forecasts are based on published
availability data broken down to a half-hourly profile, to
which we apply a breakdown rate for each fuel type, to
account for unexpected generator breakdowns, restrictions
or losses close to real-time.
Figure 9. Daily generation availability by fuel type (based on market submissions and
including breakdown rates)
13Europe and interconnected markets / Overview Winter 2021/22
We expect more exports across the interconnectors to continental
Europe from GB than in past winters.
This winter we expect
• forward prices, including peak prices, in GB to be below some of those in continental Europe
across parts of the winter period
• increased exports to Continental Europe across much of the winter period driven by price
differentials outside of times of system stress
• net imports from Norway across the NSL interconnector across the winter period, particularly at
peak
• imports into GB at peak times of tight margins or stress on the GB system. We don’t expect
interconnectors to be exporting to Europe if this would mean we were unable to meet GB Winter 2021/22
demand
• Moyle and EWIC typically export from GB to Northern Ireland and Ireland during peak times,
although at substantially less than maximum capacity due to high demand on the GB system.
When operational surplus is particularly tight, exports to Northern Ireland and Ireland are
expected to reduce to zero, and could even provide imports to GB.
Did you know?
Figure 10 shows last year's average interconnector flows at peak times, and during periods when
operational surplus was below 2GW. These, alongside the expected prices (see page 16) are
used to help inform our expectations for interconnector flows this year.
The new NSL interconnector was operating at restricted capacity for part of last winter, but is now
running at full capacity and is expected to import to GB – especially at times of tight margins.
Since last winter the ElecLink interconnector between GB and France has also come into service.
Figure 10. Historical flows on the interconnectors for winter 2021/22
14Europe and interconnected markets / Peak flows analysis
Our assumptions around peak flow of electricity on the
interconnectors depend on a number of factors.
1. Physical capabilities 2. Capacity Market
Interconnector capability will be affected by the outages set out in the table below. The Interconnectors have secured agreements in the Capacity Market (CM) in the T-31
ongoing IFA outage is a result of a fire last autumn that led to reduced capacity, it is auction for 2022/23 as set out in Figure 11 below. While we expect increased exports
expected to come back to full capacity by mid-December. this winter to continental Europe, at times of tight margins or stress in GB (e.g., when a
Capacity Market Notice was issued) we would expect to see flows into GB.
Since last winter the ElecLink interconnector between GB and France has also come into
service. Our Base Case assumes interconnectors deliver in line with their CM obligations. We
have also assessed the risks and uncertainties of reduced imports from Continental
Maximum Available capacity Europe through our first scenario.
Interconnector Planned outages
capacity during outage
21/10/21 – 30/10/22 1GW
IFA 2GW
31/10/22 – 15/12/22 1.5GW
IFA2 1GW n/a
BritNed 1GW n/a
Nemo Link 1GW n/a
EWIC 500MW n/a
Moyle 500MW n/a
NSL 1.4GW n/a
. ElecLink 1GW n/a
Table 3. Planned interconnector outages at time of analysis
Figure 11. Capacity Market agreements for interconnectors in Delivery Year 2022/23
15 1 Due to the suspension of the Capacity Market, a T-3 auction was run for delivery in 2022/23 rather than a T-4 auctionEurope and interconnected markets / Peak flows analysis
3. European forward prices 4. Network access constraints
• Electricity flows through the interconnectors are primarily driven by the price differentials • Transmission outages in the regions with interconnectors could cause power flow
between the markets. constraints resulting in disruption to interconnector flows, particularly in the South
East. This has already been challenging to manage over the summer.
• Quarter ahead forward prices for baseload electricity during winter 2022/23 in GB are
below those in the French and Dutch, but above those in the Belgian markets (see 5. Nuclear availability in France
Figure 12). We therefore expect exports across the interconnectors to France and the
Netherlands at times across the winter. • Figure 14 shows French nuclear outages for the winter ahead against historical
outages. While outages are high at the beginning of the winter period they are
• Figure 13 shows forward prices for peakload electricity during winter 2022/23, in which expected to drop to around 5GW (around 8% of capacity2) by January 2023.
GB prices are ahead of those in the Dutch market but significantly below prices in
France. This indicates we may see exports to France at peak times over the winter. • We expect these outage levels, combined with high French market prices, to lead to
However, should GB experience some tight/stress periods, we would expect GB prices exports to France across much of the winter.
to escalate and interconnectors to import in line with Capacity Market obligations.
• We don’t expect interconnectors to export to Europe if this would mean we were unable
to meet GB demand; they would import or float in this situation.
Figure 12. Winter 2022/23 electricity baseload Figure 13. Winter 2022/23 electricity peak forward prices 1 Figure 14. The impact on French nuclear capacity from planned outages in 2022/23 and
actual outages in recent years3
1 Figure 12 uses data from Bloomberg. Peak forward prices were only given for GB and France in Bloomberg, therefore Figure 13 uses data taken from Argus, which includes prices for the Netherlands.
Lower liquidity means no peakload forward prices were available for Belgium.
2 Total French nuclear capacity is 61.4GW this winter.
3 https://www.edf.fr/en/the-edf-group/who-we-are/activities/optimisation-and-trading/list-of-outages-and-messages/list-of-outages
16Europe and interconnected markets / Historic flows
Overview of European interconnectors Overview of Irish interconnectors
Based on forward prices for the 2022/23 winter products, we expect imports into GB at During peak times through winter 2022/23, we expect a similar proportion of exports to
peak times from Norway, the Netherlands and Belgium under normal network operating imports across the Moyle and EWIC interconnectors to Ireland. This may, however, be
conditions. We may see greater levels of export to France at peak times than in previous reversed during periods of high wind and system stress. Figure 16 shows examples of
years. Despite day ahead baseload prices in France exceeding GB prices on a number of where market conditions and weather variance affected flows last winter.
occasions last winter we saw only limited exports to France at peak last winter, as shown
in Figure 15.
Figure 16. Daily peak time flows across the Irish interconnectors in winter 2020/21 (positive MW
Last winter we saw imports at peak times values mean imports into GB)
throughout the winter, despite day ahead baseload
prices in France sometimes exceeding those in GB
Figure 15. Daily peak time flows across the continental interconnectors in winter 2021/22 (positive
MW values mean imports into GB)1
17 1 Figure 15 peak forward prices were not provided for weekend days so interpolation was used to predict these values. Flows are out-turn values.Market prices / Winter view
Forward wholesale electricity prices are significantly higher than
last year. In addition, tight margin days are likely to see significant
price spikes in the Balancing Mechanism.
This winter we expect
• forward prices in GB to be higher than last year across the winter period (Figure 17).
This is due to external pressures, particularly very high gas prices.
• days with tight margins to see spikes in the balancing mechanism. During periods of
tight system margins, energy prices increase to reflect the scarcity of the resource,
particularly when margin notices are issued.
Did you know?
Traditionally power plants have bid into the Balancing Mechanism at prices which largely
reflected the marginal cost of running the plant over that period. Capital and operational
costs are generally recouped over a longer period through forward markets and/or long-
term contracts.
Last winter saw significantly increased prices over the year before and this winter has
much higher market prices still, with baseload prices several times higher than last winter,
although having dropped by a third from a peak of over £800/MWh at the end of August. Figure 17 Historically traded quarter-ahead GB winter ahead forward electricity baseload
prices for Winter 2020/21, Winter 2021/22 and Winter 2022/23 taken from Argus1
We commissioned an independent review of the balancing market and have provided the
report to Ofgem. This is available here. We are also enhancing our market monitoring
activities this Winter.
18 1 The numbers shown in Figure 17 are historical traded prices not forecasts. Trading does not take place on weekends or bank holidays so these values have been interpolated.Appendix / Margin notices
Electricity Margin Notices (EMNs) and Capacity Market Notices There are a number of significant differences between the operational System Warning
(CMNs) are used to highlight to market participants when margins messages (such as EMNs) and Capacity Market Notices:
are looking tight ahead of real-time. They are intended to stimulate
1. Trigger - Capacity Market Notices are issued based on an automated system margin
a market response through, for example, additional generation calculation using data provided by market participants, whereas System Warnings are
being made available. They don’t indicate that demand will not be manually issued by the ESO control room using engineering judgement based on
met. experience and knowledge of managing the electricity transmission system.
2. Threshold - Capacity Market Notices are triggered where the buffer between available
• Electricity Margin Notices (EMNs) are one of our operational tools to manage generation and the total of forecast demand and Operating Margin falls below a
margins. They are based on operational margins which are calculated from threshold. The threshold is taken from the Capacity Market Rules. System Warnings
transmission system demand and transmission system capacity. are triggered by varying volumes, for example an EMN may be issued where ESO
expects to utilise a certain amount of its Operating Margin.
• Capacity Market Notices (CMNs) are issued automatically. They act as a notice
for providers with Capacity Market agreements to deliver in line with their CM 3. Constraints - The Capacity Market Notice calculation does not take account of any
obligations for the indicated settlement period(s). If the CMN remains in place, the transmission system constraints that may be preventing capacity from accessing the
providers who do not deliver in line with their obligations may be subject to network. System Warnings however do take such constraints into account.
penalties in accordance with the CM Rules. They are issued automatically and
are not considered as one of our operational tools. They are based on Capacity 4. Lead time - Capacity Market Notices are initially issued four hours ahead of when the
Market margins which are calculated from whole system demand and whole challenge is foreseen. System Warnings can be issued at any time but we would
system capacity (including Distributed Energy Resources (DER)). generally expect to issue a first EMN at the day ahead stage.
While having similar intentions in stimulating a market response for tight periods,
EMNs and CMNs should be considered as being part of two separate processes:
the operational processes used by our control room to operate the system in real-
time, and the CM penalty process. They serve different purposes, and are not part of For more information about margins and margin notices
the same sequential process.
https://www.nationalgrideso.com/news/everything-you-need-know-about-
The ESO is working with Ofgem to improve the communication of system notices. electricity-system-margins
This is an ongoing process and more detail will be published in due course.
19Appendix / Operational surplus analysis
Our operational surplus analysis represents the market’s current intentions (i.e. based on market submissions before we take
actions). This analysis is based on market submissions as of 22nd September.
It is a dynamic view that changes throughout winter and, as such, we will be providing regular updates at the ESO Operational
Transparency Forum. It provides insight on the periods when we may need to send market signals / use tools to ensure there is
enough generation on the system to meet demand and contingency requirements. The periods of tightest margins do not necessarily
occur at times of peak demand but rather when supply is lowest relative to demand.
How the operational surplus is calculated and used
• For the operational surplus analysis, we plan based on the operational data submitted to us. We are not just looking at the capacity provided via the Capacity Market (a
market tool that helps to set us up for winter), but also at the supply that is forecast to be available on a day-by-day basis. To do this we need to consider a more granular
view of the winter.
• We consider a daily view as we get closer to real-time and start assessing the daily views in August ahead of the Winter Outlook Report publication in October. The Winter
Outlook Report includes a daily view of margins for the winter, as well as information on the effects of variability and the likelihood of tight operational margins.
• The operational data includes information relating to planned plant outages, the impact of weather (e.g. on wind and demand) and flows on interconnectors. As generators
can also have unplanned outages, we also apply breakdown rates based on averages of the last 3 winters. In addition, we study the effects of variability of all relevant
factors, particularly weather, renewable resource and unplanned outages. The operational data may be different from the assumptions based on historic data / long-term
averages used for the winter view of margin.
• The operational surplus also considers grid constraints and largest loss requirements. In the central daily view we use a low wind scenario, so the grid constraints play only
a small part in the calculation. When we consider the credible range of values, grid constraints become more significant.
• The operational surplus helps us to identify when we might have tight periods. However, the operational data provided to us changes throughout the winter. There may be
some tight periods that are apparent a week in advance; others may not become apparent until much closer to real-time (e.g. day ahead or on the day itself).
• These assessments of security of supply are used to support decisions taken in operational timescales (e.g. whether to issue an EMN).
20Glossary
Average Cold Spell (ACS) Capacity Market Notice (CMN)
ACS methodology takes into consideration people’s changing behaviour due to the Based on Capacity Market margins which are calculated from whole system demand
variability in weather (e.g. more heating demand when it is colder) and the variability and whole system capacity. For more information about margins and margin notices
in weather dependent distributed generation (e.g. wind generation). These two see: https://www.nationalgrideso.com/news/everything-you-need-know-about-
elements combine have a significant effect on peak electricity demand. electricity-system-margins
Balancing Mechanism Combined Cycle Gas Turbine (CCGT)
The Balancing Mechanism is a tool which we use to balance electricity supply and A power station that uses the combustion of natural gas or liquid fuel to drive a gas
demand. It allows participants to set prices for which they will increase or decrease turbine generator to produce electricity. The exhaust gas from this process is used to
their output if requested by the ESO. All large generators must participate in the BM, produce steam in a heat recovery boiler. This steam then drives a turbine generator to
whereas it is optional for smaller generators. produce more electricity.
Balancing Mechanism Unit (BMU) Contingency coal contracts
A unit which participates in the Balancing Mechanism. At the request of the Department for Business, Energy and Industrial Strategy the ESO
Baseload electricity has signed three contracts with EDF, DRAX and Uniper to provide additional coal
generation this winter. More details can be found here:
A market product for a volume of energy across the whole day (the full 24hrs) or a
https://www.nationalgrideso.com/winter-operations
running pattern of being on all the time for power sources that are inflexible and
operate continuously, like nuclear. Demand flexibility service
Breakdown rates The ESO is currently consulting with the energy industry on proposals for a new
Demand Flexibility Service to run between November 2022 and March 2023. This
A calculated value to account for unexpected generator unit breakdowns,
service will incentivise consumers and businesses to reduce or reschedule their
restrictions or losses close to real time. Forecast breakdown rates are applied to the
electricity use away from peak times. The service will be offered by suppliers and
operational data provided to the ESO by generators. Rates are based on how
aggregators to their customers. More details can be found here:
generators performed on average by fuel type during peak demand periods (7am to
https://www.nationalgrideso.com/industry-information/balancing-services/demand-
7pm) over the last three winters.
flexibility
BritNed
Demand suppression
BritNed Development Limited is a joint venture between Dutch TenneT and British
The difference between our pre-Covid forecast demand levels and the actual demand
National Grid that operates the electricity link between Great Britain and the
seen on the system. We have not included any Covid-related demand suppression this
Netherlands. It is a bi-directional interconnector with a capacity of 1,000MW. You
winter.
can find out more at www.britned.com.
Capacity Market (CM)
The Capacity Market is designed to ensure security of electricity supply. It provides
a payment for reliable sources of capacity, alongside their electricity revenues,
ensuring they deliver energy when needed.
21Glossary
De-rated margin for electricity Equivalent Firm Capacity (EFC)
The sum of de-rated supply sources considered as being available during the time An assessment of the entire wind fleet’s contribution to capacity adequacy. It
of peak demand plus support from interconnection, minus the expected demand at represents how much of 100 per cent available conventional plant could theoretically
that time and basic reserve requirement. This can be presented as either an replace the entire wind fleet and leave security of supply unchanged.
absolute GW value or a percentage of demand (demand plus reserve). The formula Float / Floating
was revised in winter 2017/18 to include distribution system demand, and in winter
When an interconnector is neither importing nor exporting electricity.
18/19 to better account for interconnection. See our previous publications for further
details (https://www.nationalgrideso.com/research-publications/winter-outlook). Forward prices
Distributed Energy Resources (DER) The predetermined delivery price for a commodity, such as electricity or gas, as
decided by the buyer and the seller of the forward contract, to be paid at a
Resources connected to the distribution network which can generate or offtake
predetermined date in the future.
electricity.
Grid Code
East West Interconnector (EWIC)
The Grid Code details the technical requirements for connecting to and using the
A 500MW interconnector that links the electricity transmission systems of Ireland
National Electricity Transmission System (NETS).
and Great Britain. You can find out more at www.eirgridgroup.com/customer-and-
industry/. GW Gigawatt (GW)
ElecLink A measure of power. 1GW = 1,000,000,000 watts.
A 1000MW interconnector that links the electricity transmission systems of France Interconnector
and Great Britain. You can find out more at https://www.eleclink.co.uk/. Electricity interconnectors are transmission assets that connect the GB market to
Embedded generation Continental Europe and Ireland. They allow suppliers to trade electricity between these
markets.
Power generating stations/units that are not directly connected to the National Grid
electricity transmission network and for which we do not have metering Interconnexion France–Angleterre (IFA)
data/information. They have the effect of reducing the electricity demand on the A 2,000MW link between the French and British transmission systems. Ownership is
transmission system. shared between National Grid and Réseau de Transport d’Electricité (RTE). See more
Electricity Margin Notice (EMN) at https://www.ifa1interconnector.com/.
Based on operational margins which are calculated from transmission system Interconnexion France–Angleterre 2 (IFA2)
demand and transmission system capacity. For more information about margins and A 1,000MW link between the French and British transmission systems commissioned in
margin notices see: 2020. Ownership is shared between National Grid and Réseau de Transport
https://www.nationalgrideso.com/news/everything-you-need-know-about-electricity- d’Electricité (RTE). See more at https://www.ifa1interconnector.com/.
system-margins.
22Glossary
Load factors Normalised peak transmission demand
The amount of electricity generated by a plant or technology type across the year, The peak demand seen on the transmission system, forecast using long-term trends
expressed as a percentage of maximum possible generation. These are calculated and calculated with the effects of the weather and the day of the week removed as
by dividing the total electricity output across the year by the maximum possible appropriate. This takes into account the power used by generating stations when
generation for each plant or technology type. producing electricity (the ‘station load’) and interconnector exports.
Loss of Load Expectation (LOLE) Operational surplus
LOLE is the expected number of hours when demand is higher than available The difference between the level of demand (plus the reserve requirement) and
generation during the year before any mitigating /emergency actions are taken but generation expected to be available, modelled on a week-by-week or day-by-day basis.
after all system warnings and System Operator (SO) balancing contracts have been It includes both notified planned outages and assumed breakdown rates for each power
exhausted. It is important to note when interpreting this metric that a certain level of station type.
loss of load is not equivalent to the same amount of blackouts; in most cases, loss of Outage
load would be managed by actions without significant impacts on consumers. The
The annual planned maintenance period, which requires a complete shutdown, during
Reliability Standard set by the Government is an LOLE of 3 hours/year
which essential maintenance is carried out.
Minimum demand
Peakload electricity
The lowest demand on the transmission system. This typically occurs overnight. A market product for a volume of energy for delivery between 7am and 7pm on
Moyle weekdays.
A 500MW bi-directional interconnector between Northern Ireland and Scotland. You Pumped storage
can find out more at www.mutual-energy.com.
A system in which electricity is generated during periods of high demand by the use of
MW Megawatt (MW) water that has been pumped into a reservoir at a higher altitude during periods of low
A measure of power. 1MW = 1,000,000 watts. demand.
Nemo Link Reactive power
A 1GW HVDC sub-sea link between GB and Belgium. See more at The movement of energy across a network which is measured in MVAr. Different types
https://www.nemolink.co.uk/. of network assets and generators can generate or absorb reactive power. The flows of
North Sea Link (NSL) reactive power on a system affect voltage levels.
A 1.4GW HVDC sub-sea link from Norway to GB commissioned this October. See REMIT
more at https://www.northsealink.com/. REMIT data is information provided by market participants to comply with Article 4 of
Normalised transmission demand Regulation on Wholesale Energy Market Integrity and Transparency (REMIT)
Regulation (EU) 1227/2011.
The demand seen on the transmission system, forecast using long-term trends and
calculated with the effects of the weather and the day of the week removed as
appropriate. This takes into account the power used by generating stations when
producing electricity (the ‘station load’) and interconnector exports.
23Glossary
Renewables Triad avoidance
Electricity generation from renewable resources, which are naturally replenished, When demand side customers reduce the amount of energy they draw from the
such as sunlight or wind. transmission network, either by switching to distributed generation sources, using on-
Reserve requirement site generation or reducing their energy consumption. This is sometimes referred to as
customer demand management but we refer here to customer behaviour that occurs
To manage system frequency, and to respond to sudden changes in demand and
close to anticipated Triad periods, usually to reduce exposure to peak time charges.
supply, the ESO maintains positive and negative reserve to increase or decrease
supply and demand. This provides head room (positive reserve) and foot room Triads
(negative reserve) across all assets synchronised to the system. The three half-hourly settlement periods with the highest electricity transmission system
Rota load shedding demand. Triads can occur in any half-hour on any day between November and
February. They must be separated from each other by at least ten days. Typically, they
Scheduled disconnection and reconnection of electricity supplies in an electricity
take place on weekdays around 4.30 to 6pm.
supply emergency, as set out in the government’s Electricity Supply Emergency
Code (ESEC). Underlying demand
Seasonal normal weather Demand varies from day to day, depending on the weather and the day of week.
Underlying demand is a measure of how much demand there is once the effects of the
The average set of conditions we could reasonably expect to occur. We use industry
weather, the day of the week and distributed generation have been removed.
agreed seasonal normal weather conditions. These reflect recent changes in climate
conditions, rather than being a simple average of historic weather. Voltage
Short Term Operating Reserve (STOR) Unlike system frequency, voltage varies across different locations on the network,
depending on supply and demand for electricity, and the amount of reactive power in
At certain times of the day, we may need access to sources of extra power to help
that area. Broadly, when electricity demand falls, reactive power increases and this
manage actual demand on the system being greater than forecast or unforeseen
increases the likelihood of a high voltage occurrence.
generation unavailability. STOR provides this reserve.
Weather corrected demand
System Operator Transmission Code (STC)
The demand expected or out-turned with the impact of the weather removed. A 30-year
The System Operator Transmission Owner Code defines the relationship between
average of each relevant weather variable is constructed for each week of the year.
the Transmission Owners (TOs) and the ESO.
This is then applied to linear regression models to calculate what the demand would
Technical capability have been with this standardised weather.
The capacity of connected plant expected to be generating in the market, based on Western High Voltage (HVDC) Link (WLHVDC)
the Capacity Market auctions and another sources of market intelligence, but not
The Western Link uses DC technology to reinforce the UK transmission system and
taking any account of potential breakdown or outage.
move electricity across the country in very large volumes between Hunterston in
Transmission System Demand (TSD) Scotland and Deeside in North Wales.
Demand that the ESO sees at grid supply points, which are the connections to the Winter period
distribution networks.
The winter period is defined as 1 October to 31 March.
24Electricity System Operator legal notice Join our mailing list to receive email updates on
our Future of Energy documents.
Pursuant to its electricity transmission licence, National Grid Electricity System Operator
Limited is the system operator of the national electricity transmission system. For the www.nationalgrideso.com/research-publications/winter-outlook
purpose of this outlook document, the terms “we”, “our”, “us” etc. are used to refer to the
licensed entity, National Grid Electricity System Operator Limited. Email us with your views on the Winter Outlook Report at:
marketoutlook@nationalgrideso.com and we will get in touch.
National Grid Electricity System Operator Limited has prepared this outlook document
pursuant to its electricity transmission licence in good faith, and has endeavoured to
You can write to us at:
prepare this outlook document in a manner which is, as far as reasonably possible,
objective, using information collected and compiled from users of the electricity
transmission system together with its own forecasts of the future development of those Energy Insights
systems. Electricity System Operator
Faraday House
While National Grid Electricity System Operator Limited has not sought to mislead any Warwick Technology Park
person as to the contents of this outlook document and whilst such content represent its Gallows Hill
best view as at the time of publication, readers of this document should not place any Warwick
reliance on the contents of this outlook document.
CV34 6DA
The contents of this outlook document must be considered as illustrative only and no
warranty can be or is made as to the accuracy and completeness of such contents, nor
shall anything within this outlook document constitute an offer capable of acceptance or
form the basis of any contract. Other than in the event of fraudulent misstatement or
fraudulent misrepresentation, National Grid Electricity System Operator Limited does not
accept any responsibility for any use which is made of the information contained within
this outlook document.
25You can also read