Optimal Model of Horse Racing Competition Decision Management Based on Association Rules and Neural Network
←
→
Page content transcription
If your browser does not render page correctly, please read the page content below
Hindawi
Scientific Programming
Volume 2022, Article ID 4240244, 10 pages
https://doi.org/10.1155/2022/4240244

Research Article
Optimal Model of Horse Racing Competition Decision
Management Based on Association Rules and Neural Network

 Shuang Zhang
 Wuhan Business University, Wuhan, Hubei, China

 Correspondence should be addressed to Shuang Zhang; tiredhiker@wbu.edu.cn

 Received 28 December 2021; Revised 21 January 2022; Accepted 7 February 2022; Published 11 March 2022

 Academic Editor: Sheng Bin

 Copyright © 2022 Shuang Zhang. This is an open access article distributed under the Creative Commons Attribution License,
 which permits unrestricted use, distribution, and reproduction in any medium, provided the original work is properly cited.

 With the vigorous development of horse racing, people’s attention to horse racing has increased significantly. Some experts and
 scholars have conducted research on the decision-making management and predictive analysis methods of horse racing. Today,
 with the rapid development of information technology, the amount of data and data dimensions of horse racing competitions
 continue to explode. The increase in data scale and feature dimensions provides new challenges for competition management and
 competition prediction research. At present, traditional prediction algorithms can no longer meet the needs of horse racing
 situation prediction, but research has found that association rules and neural network algorithms provide a good solution to the
 classification and prediction problem. Based on the advantages of association rules and neural networks in analyzing data,
 according to the requirements of horse racing decision management, this paper adopts the B/S structure to realize the construction
 of the horse racing decision management optimization model from the three aspects of hierarchical structure, functional
 structure, and forecasting process. Combined with the horse racing decision management optimization model, based on a large
 number of experimental training data, the final conclusion is drawn: first, the factors that affect the horse racing performance are
 from large to small. The order of arrangement is: race schedule > age > gender > weight > rating > horse top three
 rate > jockey > weight load > harness > ranking > field nature > field > trainer; the second is the prediction and actual results of the
 neural network algorithm. The closest one, which is slightly higher than 90%, has the highest prediction accuracy; third, the
 average value of the horse racing performance prediction of this system during the review is only 2.01 s, and the misappraisal rate is
 0.12%, indicating that the application value of this system is significant; fourth, in the average time spent in the two seasons, the
 average time spent in the second season was reduced compared with the average time spent in the first season, with a maximum
 reduction of 0.984 s, indicating a slight improvement in the performance of the 2020 season. Using this system to predict horse
 racing, results can improve the optimization of horse racing decision management to a certain extent.

1. Introduction welfare and charity organizations, and the big tax collector of
 the country. It is the carrier of interpersonal communication
Modern horse racing is an outdoor sport that is popular with and an important entertainment method in people’s lives
all walks of life. It is a comprehensive industry integrating [3]. It is fashionable for people to participate in horse racing
sports, entertainment, gambling, and commerce. There are activities and to become a member of the horse club and
3.2 million competitions each year, and the total prize horse owner as a symbol of their identity and status.
money for horse racing in the world amounts to 360 billion With the tremendous improvement in people’s living
yuan [1]. At present, there are more than 70 countries and standards, horse-racing-related undertakings are also ad-
regions developing horse racing in the world. Horse racing vancing quickly and steadily. As one of the horse-racing-
in the United States, Britain, France, Australia, Japan, Hong related industries, the horse racing lottery has also received
Kong, and so on has developed well and has become one of national support and people’s attention. Driven by the horse
the most important industries in the country [2]. Horse racing lottery, more and more ordinary people participate in
racing is the link of economic activities, the pillar of public horse racing. Taking the UK as an example, the horse racing
2 Scientific Programming

industry has an output of more than 1 billion pounds and horse racing events and the service operation management
has developed into the second-largest sports industry after mode of Japanese horse racing events are analyzed from the
football. With the increasing popularity of the horse racing perspective of service [10]. Zhang and Liu proposed horses
industry, about 130 million people around the world par- are a unique match between two life forms of equestrian
ticipate in horse racing lottery guessing. People began to events, and the health of horses directly affects the event,
summarize general laws in various types of horse racing, which requires a very high level of organization and man-
trying to find a way to improve the level of winning and agement of our events [11]. Research by Quintana et al.
losing guessing [4]. Today, with the vigorous development of shows that among the participants of high-level equestrian
normalization, traditional horse racing prediction models competitions, the injury rate is also the highest, and
generally have low prediction accuracy and imperfect system equestrian competitions require skilled emergency medical
architecture design, which can no longer meet the needs of services [12]. Research by Fenner et al. pointed out that it is
horse racing management and competition outcome pre- necessary to establish a comprehensive long-term planning
diction. How to build a horse racing decision-making system for events, pursue the irreplaceability of the eques-
management model and apply scientific methods to solve trian event brand, develop the characteristic highlights of the
forecasting problems has become a problem that more equestrian event, and propose the establishment of a pro-
scholars and the public are concerned about. fessional talent training system [13]. Research by Sun and Li
 Information technology has played a huge role in pro- shows that in the context of equestrian sports, competitions
moting the development of horse racing. The advancement can promote and drive related consumption [14]. Padalino
of science and technology has not only promoted the ad- et al. explored the characteristics of the development of
vancement of horse racing but also has higher requirements large-scale sports events in Hong Kong, analysis of sports
for the decision-making management and performance development and management mechanisms, and the
prediction of horse racing [5]. Based on the research of a characteristics of horse racing to drive and promote the
large amount of data, this paper introduces association rules development of Hong Kong’s gaming industry and sports
and neural network algorithms to establish a horse racing culture [15]. Hoseini and Amani proposed an equestrian
competition decision-making management optimization event management system based on the B/S model to fa-
model. It provides decision-makers with powerful means cilitate event informatization [16].
and tools, provides an effective quantitative basis for making Information technology is the foundation and symbol of
reasonable training management decisions and training modern society. With the development of artificial intelli-
programs, and provides scientific predictions for public gence and big data, many experts use information tech-
participation in horse racing. nology to manage and predict sports events. In the research
 on the comprehensive evaluation and prediction of national
2. Related Work gold medal rankings in the Olympic Games, Xiao and others
 used tracking statistics + comprehensive eval-
Horse racing is a speed competition that tests humans to uation + comparative analysis + expert consultation on the
control and control horses. It is one of the main events of comprehensive evaluation of Olympic gold medal rankings
equestrian sports. Its forms are changeable, but the principles for the Olympic events in the world’s major competitions
are basically speed competitions. Horse racing is also a during the Olympic cycle from 1989 to 1992. Method of
worldwide traditional competition event [6]. According to prediction: based on the comprehensive and timely grasp of
textual research, horse riders were found in stone carvings of the strength level and development changes of the Olympic
the Neolithic Age, and as early as the beginning of the seventh events in various countries and regions, the strength pattern,
century BC, the four-horse driving sports event appeared in number of gold medals, and team rankings of the Olympic
the Olympic Games held in ancient Greece. Later, the project Games were predicted [17]. In the analysis of the strength of
was changed to human driving for competition [7]. In the the diving powers in the 2000 Sydney Olympics and the
beginning, horse racing was only used as a method and means study of gold medal predictions, Chen used the sports expert
to select good horses. Only the most prominent and out- method to analyze the strengths of the diving powers in the
standing horses on the racetrack can be used for breed 2000 Sydney Olympics and predicted the gold medal situ-
breeding. In modern times, with the continuous development ation of the Chinese diving team [18].
and prevalence of horse racing, organization, management, At present, the research and application of predictive
and competition have become more and more important management have penetrated into various research fields,
compared with ancient horse racing events, and the method is and the field of horse racing research is no exception.
more scientific and more advanced [8]. Predictions can be made in horse racing strategy research,
 With the continuous popularity of horse racing, many decision-making, coaches, athlete team construction,
scholars have conducted research on horse racing. Ghe- training programs, and so on. In recent years, different
zelsefloo proposed: based on the theory of service operation prediction algorithms have been widely used in nonlinear
management, transplant the theoretical knowledge of the prediction in various fields, such as BP neural network,
discipline system of service operation management into the wavelet neural network, support vector machine regression,
operation management of horse racing events [9]. Fenner and so on. Among them, association rules and neural
et al. emphasized that guided by model theory and method, networks have become the most successful prediction
the service operation management mode of Hong Kong methods in the field of horse racing because they are easy to

Scientific Programming 3

implement any complex nonlinear mapping function. data, there is incomplete and invalid information in the data.
Forecast through scientific methods; recognize the direction, By processing it at this layer, the integrity and correctness of
trend, and law of the development and change of things; and the data can be ensured. The data managed by the data
take effective measures to control the codevelopment, so as service layer mainly come from two aspects. On the one
to better optimize the management of horse racing hand, it is through data collection equipment, stored in the
decisions. data service layer and provided to users for use; on the other
 hand, it is basic information such as query requests received
3. Realization of Horse Racing Competition through the business logic layer. The basic data and his-
 torical information are stored in the database and trans-
 Decision Management Model mitted to the upper layer. At the same time, in order to
The purpose of horse racing decision management is to ensure the robustness of the database, the data service layer
accurately predict the development and changes in the horse also regularly backs up the database and files.
racing system, adjust the influence of other factors, and Data collection module: It includes game data collection
finally realize the optimization of horse racing decision and training data collection. The data obtained by the system
management [19]. Based on association rules and neural through the data acquisition subsystem can analyze the
network algorithms, this chapter realizes the establishment recent physical state, technical and tactical state, and overall
of a horse racing competition decision management opti- cooperation state of the horse and jockey, so as to formulate
mization model from three aspects: the level construction of corresponding training plans; at the same time, the data
horse racing competition decision management, functional acquisition module provides data for the prediction of the
structure, and competition prediction process. horse racing conditions studied in this paper support. In the
 horse racing decision-making management system, it is
 mainly completed by the staff and mobile devices to provide
3.1. Model Hierarchy. The horse racing decision-making accurate and timely basic information for the horse racing
management system adopts a four-layer architecture design. situation prediction to ensure the normal operation of the
From bottom to top, they are the horse racing data collection horse racing situation prediction system. Collectors record
layer, data service layer, system business logic layer, and user the trajectory of horse racing on the competition field
interface layer. Each layer of the system completes the through the mobile phone client. Since manual input will
corresponding function and will exchange data between produce some abnormal data, when using the collection
each layer; the hierarchical structure diagram is shown in layer data to predict the game conditions, it is necessary to
Figure 1. process the abnormal data to ensure data reliability.
 User interface layer: It provides users with an interface
into the horse racing decision management system, which
realizes the overall design of human-computer interaction, 3.2. Model Functional Structure. This paper combines the
operation logic, and beautiful interface of the horse racing key technology of demand analysis and horse racing decision
decision management and displays it to users in the form of a management model to design the prototype of a horse racing
graphical interface. When the user sends a request to the decision management optimization system. The system is
image system, the system first performs the request and data roughly divided into system management, personnel in-
analysis at the bottom layer and then transmits the calcu- formation management modules, data collection, event
lation result to the user interface layer to display it to the management, and points query. The system functions are
user. When a user sends a request to the system, the system shown in Figure 2.
first performs the request and data analysis at the bottom Data collection module: The main function of data
layer and then transmits the calculation result to the user collection is to collect data from horse racing or
interface layer to display it to the user. The design of the user training, which provides data support for the study of
interface display layer needs to comply with the principles of the horse racing decision management model in this
aesthetics, intuitiveness, and fault tolerance. Due to the article. It is divided into three modules: competition
needs of different users, the carrier devices of the user layer data collection, training data collection, and data
are not the same, mainly smartphones, desktop computers, statistics.
and portable notebooks.
 Business logic layer: It is the core part of the entire horse Event management module: The main function is to
racing decision-making management system, mainly for browse, release, and update events. Nonadministrator
business logic-related analysis and processing. By receiving users can browse the game. For a game that has ended,
the information of the user interface display layer and the user can view the score of each quarter of the game
performing business processing, the system command ser- and the final game status; for a game that has not
vice is completed on the basis of the data service layer, and started, the user can make an appointment to watch the
the business processing results are stored in the database and game and predict the game status.
returned to the user interface layer for display. Game prediction module: It consists of four functions:
 Data service layer: As the middle layer, it mainly data preprocessing, parameter optimization, model
manages the horse racing information management system training, and prediction. The data preprocessing, pa-
data effectively. Due to the huge amount of competition rameter optimization, and model training are part of
4 Scientific Programming

 User
 interface
 layer Event Information
 News Android
 Information query

 Business logic
 Input request Output result
 analysis
 PC
 Business
 logic general user Race query Event release
 layer

 Manage users Points query distribute news

 Web

 Data Database Database backup
 service
 layer Database Data backup File backup
 File server
 server server server
 Web

 Data
 acquisiti
 on Coach Horse racing Management
 module information information information IOS
 Figure 1: The system hierarchy diagram.

 Mobile Web

 Horse racing competition decision management system

 User Management Horse information
 Information
 Points query
 system

 Horse Racing Points Accumulated points Coach information
 Authority

 Referee
 Role management information
 Data collection

 Game data
 management

 Event release Race query
 Event

 Training data
 Match prediction
 Tournament update Statistical data

 Figure 2: System function module diagram.

 the system background administrators, and the game the two sides of the game. The user can clearly see the
 prediction is a user use function. The user selects a comparison of the relevant game data before the game
 game in the viewing schedule interface and clicks the between the two sides through the interface. Upon
 “Pre-match” hyperlink. After the server receives the clicking the “Predict” button, the system will make a
 request, it will feed back the data comparison between prediction by completing the following steps.
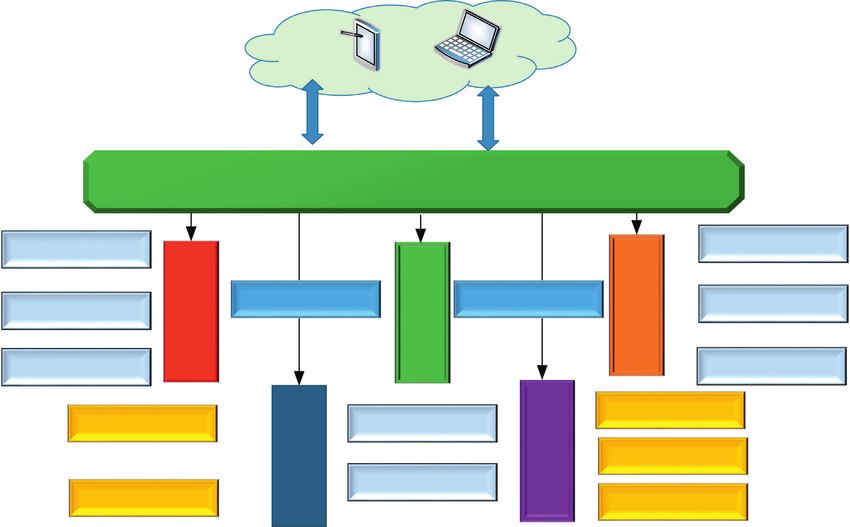
Scientific Programming 5

 Points query module: Mainly to query points, this association rules and neural networks to the horse racing
 module includes horse racing points query and season decision management model can predict horse racing more
 points query. Users can query related postregular accurately.
 season standings and horse racing standings. The Since there are many factors that affect horse racing
 system receives the score query request from the user, performance, neural network modeling is used; various
 initializes the scoreboard information, and displays the influencing factors are used as neurons; and association rules
 scoreboard to be queried. are used to find out the interconnection between each
 System management module: It includes system login neuron and determine the connection strength between the
 and registered user audit, system authority manage- neuron and the neuron source, which is the proportion of
 ment, and role management. Mainly by reviewing the each influencing factor in the forecast. The output of the final
 registration, new users maintained the system’s roles, neuron is the prediction result. Next, the two key algorithms
 permissions, password management, and so on to involved in the horse racing decision management system-
 ensure the normal use and operation of the system. The association rules and neural network algorithms will be
 system classifies users into different role categories described in detail.
 according to actual usage and assigns different per-
 missions to different roles.
 3.4.1. Neural Network Algorithm. A neural network is a kind
 The news module is mainly to display the news related to of backpropagation network, proposed by Rumelhart and
horse racing events, including the latest race news, horse Mc Celland in 1986, composed of backpropagation and error
racing, season news, and so on. Features include horse racing information communication [20]. The neural network in-
news releases, horse racing news update, and news infor- cludes an input layer, a hidden layer, and an output layer. To
mation retrieval functions. transfer the function from the input layer to the hidden layer
 The information management module includes basic and from the hidden layer to the output layer, the formula is
management functions such as the addition, deletion, as follows:
modification, and query of horse racing athlete information,
coach information, and referee information, as well as the net1 � eT x − c1 , h � f1 net1 ,
management of the relationship between roles. ⌢
 (1)
 net2 � qT x − c2 , y � f2 net2 .

3.3. Game Prediction Process. The administrator client de- Get the function model and loss model as follows:
 ⌢
velopment of the horse racing decision management system y � f2 net2 � f2 qT f1 net1 − c2 ,
adopts the B/S structure. In order to simultaneously apply to
the computer side, mobile terminals (Android and IOS), the √� 2 ⌢ 2
 , (2)
 E(ω) � 2 yi + yi
user side development of the horse racing situation pre- i�1
diction system adopts the web app website development
model, and the game situation prediction module is divided where x is the initial value of the neurons in each layer; c1
into four parts: data preprocessing, parameter optimization, and c2 are the intercept terms; eT and qT are the weight values
model training, and prediction. The data preprocessing, of the connection between the layers; net1 and net2 are the
parameter optimization, and model training are part of the output values of the function transfer between the layers; f1
system background administrator’s use, and the game sit- and f2 are sigmoid functions; y is the output value of the BP
uation prediction belongs to the user’s use function. First, neural network; yi is the actual value; and E(ω) is the total
log in to the system to retrieve the user login table and error of the BP neural network.
determine whether it is an administrator login or an ordi- The data as the input value need to be normalized data
nary user login. If the administrator logs in, read the game preprocessing to achieve the input value range in the [0,1]
data statistics table, use the ISSFS algorithm to select the interval. Using standardized methods for data processing,
characteristics of the game data, use the HGAPSO algorithm the formula is as follows:
to select the penalty factor for the SVM parameter C and
 � xi − xmin × xmax − xmin ,
 x (3)
function parameter g, and input the reduced data as the
training set of the model into the neural network to train the where xi represents the time of the first game of the
predictive model; if the logged-in user is a nonadministrator device and xmin and xmax represent the minimum and
user, you can choose an unfinished game and win against the maximum values of the data, respectively.
home team of the game. The negative situation is predicted, The output value obtained after BP neural network
and the prediction process is shown in Figure 3. calculation is normalized, and the formula is as follows:
 � yi × ymax .
 y (4)
3.4. Implementation of Key Algorithms in the Model.
Compared with traditional algorithms, association rules and Determine the number of artificial neurons in the hidden
neural networks have strong nonlinear relationship map- layer: under the premise of fully considering the approxi-
ping ability, adaptive ability, and learning ability and also mate accuracy, user experience, and experimental methods
have a certain fault tolerance ability. Therefore, applying to determine the number of artificial neurons in the hidden
6 Scientific Programming

 Start
 Log in Administrator User login
 login form

 Yes

 NO

 Algorithm optimization
 Algorithm data training

 Neural algorithm data
 parameters

 processing
 Competition
 data statistics
 table

 Match
 prediction

 NO

 Match Yes Whether the game is not
 Finish prediction Choose a match
 over

 Figure 3: Game forecast flow chart.

layer. Suppose the number of artificial neurons in the input conf(x ⇌ y) � T(x | y),
layer is M, the number of artificial neurons in the output
layer is N, and the ideal number of artificial neurons in the sup(x) � T(x),
 (8)
hidden layer is generally within the following range: sup(y) � T(y),
 a � (M + N) × 3 + L − (M − N) + 8 � b. (5) conf(x ⇌�y) � T(x | y).
 According to the above ideas and steps, use Python Based on the excavated horse racing game X’s first match
software to learn data through network learning and con- time, the three-parameter Weibull distribution is used to
stantly adjust the number of hidden layer neurons to op- obtain the reliability function and failure rate function of the
timize the algorithm. Determine the number of artificial horse racing X. Then the reliability function of horse racing
neurons in the hidden layer according to the minimum error Y is obtained from the mined association rules.
and optimal performance of the network and finally get the
structure of the BP neural network. S YT � S XT S(x | y). (9)

 According to the structural framework of the BP neural
 network, the input Weibull reliability function has a pro-
3.4.2. Association Rules. Discover the association rules be-
 jection relationship with the BP neural network function,
tween various factors through data mining. The reliability
 and the error value between the two variables is also close to
function of a single horse race is obtained through the neural
 the maximum error given in the network learning process.
network. The reliability function represents the health of the
 In this article, the maximum error value E is the fixed error
racehorse. When the association rules are probabilistic, the
 of input data and output data, and the following function is
reliability functions between the various factors with the
 obtained by adding a formula to the conversion function.
association relationship are linked. Next, the unknown
variables are calculated from the known variables through S YBT � S yAT − E(ω)T(x | y), (10)
the probabilization of the association rules; the formula is as
follows: where yAt represents the predictive model of match A
 and YBT represents the predictive model of match B.
 T(y | x) � T(xy) ÷ T(x), This paper combines the probabilization of association
 (6)
 T(xy) � 1 + T(x) + T(y) − T(xy). rules with the prediction model of the BP neural network,
 and finally, the prediction model of match B is obtained.
 It can be obtained from the above formula that From the above formula inference, it can be known that a
 horse racing game with an association relationship can
 T(x | y) � T(xy) × T(x) calculate a predictive model based on the data of various
 (7)
 � [1 + T(x) + T(y) − T(xy)] ×(1 + T(x)). factors, and at the same time, the predictive model of other
 competitions can be deduced by the association rules, so as
 The probability function can be transformed by the to realize the performance prediction of the horse racing
association rules as follows: game.
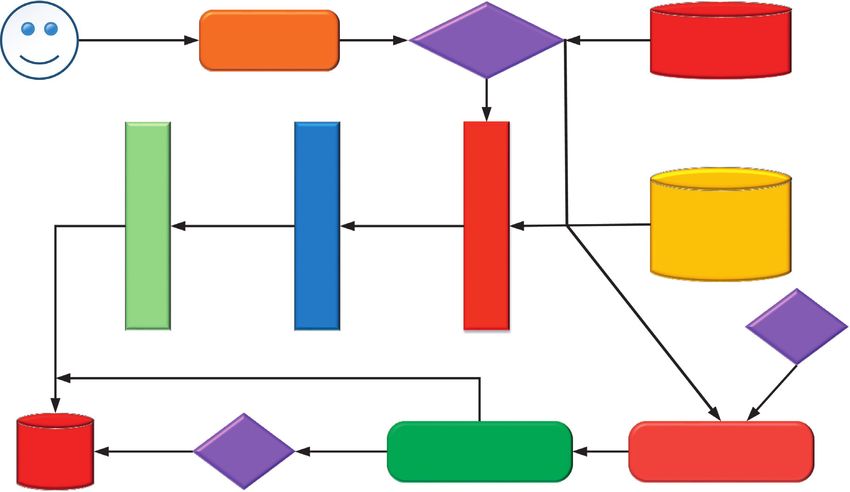
Scientific Programming 7

4. Optimization and Analysis of Horse Racing Schedule
 10 Age
 Decision Model Trainer 9
 8
4.1. The Weight of Factors Affecting Horse Racing. Many 7
 Site 6 Gender
factors in horse racing have a direct impact on the outcome 5
of the race. To construct a horse racing decision-making 4
model, the most important thing is to understand the factors 3
 2
that affect horse performance, including gender, scoring, Nature 1 Weight
ranking, weight, age, horse top three rate, harness, race 0
schedule, venue, nature of the venue, and jockey, training 13
factors such as Ma Shi [21]. The premise of this experimental
study is that the ranking of the 13 factors is to analyze the Rank Score
impact on the performance of horse racing.
 It can be seen from Figure 4 that on the basis of the
model, a large amount of data is studied and analyzed, and Harness Top three rate
the influence of factors on the prediction results is arranged
in the order of: Weight Jockey
schedule > age > gender > weight > score > horse top three Weights
rate > jockey > negative scale > harness > qualifying > field Dispersion
nature > field > trainer. The arrangement is roughly divided Variability
according to the four major categories of influencing factors.
 Figure 4: Horse racing influencing factor weight map.
These four categories of influencing factors are the decisive
influencing factors (schedule), the influencing factors of the
horse itself (age, gender, and weight), the influencing factors systems to predict the results, the prediction time, and the
that describe the quality of the horse (score and the rate of error rate of the competition data, the results are shown in
top three horses), and the external influencing factors Figure 6.
(jockey, weight-bearing, harness, qualifying, field nature, As can be seen from the figure, after comparing the two
field, and trainer). The most important of course is the systems, it can be seen that the average prediction con-
decisive factor, the schedule, because the results of different sumption of the horse racing performance of the system in
schedules are very different. this paper during the review is only 2.01 s, and the average
 time consumption of the previous system is 3.75. The
 training time and prediction time consumption of the
4.2. Multiple Algorithms Predict Accuracy Results. In this
 system in this paper are the least. The average error rate of
paper, evaluation indicators are selected to choose a variety
 this system is 0.12%. The average error rate of the previous
of optimization algorithms, namely quadratic moving av-
 system is 0.35%, and the highest rate of error is 0.88%. It
erage (A algorithm), triple exponential smoothing (B al-
 can be seen that the review performance of the system in
gorithm), gray model (C algorithm), and neural network
 this paper has significant application value in similar
algorithm. After more than 5,000 training and competitions
 systems.
in 9 schedules in recent years, the following conclusions are
drawn, and the results are shown in Figure 5.
 As can be seen from Figure 5, in the 1,000 m, 1,200 m,
 4.4. Analysis of Horse Racing Performance Improvement.
1,400 m, 1,600 m, 1,650 m, 1,800 m, 2,000 m, 2,200 m, and
 One of the design goals of the horse racing decision-making
2,400 m multiple competition events, a variety of prediction
 system is to continuously predict the performance of the
algorithms are used to make predictions. The prediction
 horse race, find out the shortcomings in the horse race, and
neural network algorithm is the closest to the actual results,
 constantly adjust and revise so that the decision-making
which is slightly higher above 90%; it has the highest pre-
 management is continuously optimized, and finally, the
diction accuracy. Secondly, the gray system algorithm is
 actual game performance is improved. Through a com-
better than the two-time moving average and three-time
 prehensive study of venues, horse racing, trainers, and
exponential smoothing algorithm, and it has a higher pre-
 knights in the 2019 and 2020 seasons, it was found that the
diction accuracy, reaching more than 80%. Therefore, it can
 combined factors of the two seasons had little effect, further
be seen that the neural network algorithm has obvious
 illustrating the authenticity and validity of the results. This
advantages in predicting the results of the competition. This
 summary compares and analyzes the competitions of dif-
model uses the neural network algorithm to improve the
 ferent schedules in the two seasons after adopting this
accuracy of the prediction.
 model, as shown in Figure 7.
 It can be seen from Figure 7 that the average time spent
4.3. System Predictive Efficiency Analysis. In order to deeply in each game of the top three in the two seasons of 2019 and
test the auxiliary effect of this system on the decision-making 2020, except for the 2,000 m schedule, the average time of the
prediction of horse racing competitions, two systems are top three in the rest of the schedule has been reduced; the
used to implement comparative tests. When testing the two results have been improved; and the highest has been
8 Scientific Programming

 2400 m

 2200 m

 2000 m

 1800 m
 Schedule

 1650 m

 1600 m

 1400 m

 1200 m

 1000 m

 0 10 20 30 40 50 60 70 80 90 100 110 120 130 140 150 160
 Time (s)

 Actual results Algorithm B
 Neural Algorithm Algorithm A
 Algorithm C
 Figure 5: Neural network algorithm accuracy rate.

 8 1.0

 7 0.9
 0.8
 6
 Prediction error (%)

 0.7
 Forecast time (s)

 5 0.6
 4 0.5

 3 0.4
 0.3
 2
 0.2
 1 0.1
 0 0.0
 0 50 100 150 200 250 300 350 400 450 500 550 0 50 100 150 200 250 300 350 400 450 500 550
 frequency frequency
 Previous system Previous system
 Text system Text system
 Figure 6: System predictive performance analysis.

reduced 0.984 s; In the fastest time of the two seasons, there the first season, and the highest reduction is 0.7 s. It shows
is no difference in the average time of the 1,400 m, 1,600 m, that the race results in the 2020 season have improved, which
1,650 m, and 1,800 m races. The average time of the other further verifies the predictive science of the system and has a
races in the second season has been reduced compared with certain improvement in horse racing results.
Scientific Programming 9

 140 140

 130

 120 120

 110
 Schedule

 Schedule
 100
 100
 1000 m 1200 m 1400 m 1600 m 1650 m 1800 m 2000 m 2200 m 2400 m 1000 m 1200 m 1400 m 1600 m 1650 m 1800 m 2000 m 2200 m 2400 m
 90

 80
 80
 70

 60
 60
 50
 Top three averages (s) Fastest time (s)

 In 2019 In 2019
 In 2020 In 2020
 Figure 7: 2019–2020 horse racing results comparison.

5. Conclusion Acknowledgments
With the rapid development of information technology, the This work was supported by the Wuhan Equine Industry
data dimension and data volume of horse racing forecast data Development and Horse Racing Event Transformation and
have grown rapidly. The increase in the scale of data and feature Upgrading Project (The Design and Implementation of
dimensions has led to the problem of large-scale data and China Horse Industry Information Management System),
dimensionality disasters during model training. Association Project Number: WHSM-2019122401.
rules and neural network algorithms with a strong ability to
process nonlinear data have been widely concerned by experts
and scholars. Based on the research of a large amount of data,
 References
this paper introduces association rules and neural network [1] P. L. Hitchens, K. Ryan, and S. I. Koch, “A sustainable
algorithms to establish a horse racing competition decision- structure for jockey injury data management for the North
making management optimization model. An example is used American horse racing industry,” Injury, vol. 50, no. 8,
to simulate the regular season, and it is proved that the accuracy pp. 1418–1422, 2019.
of this model is as high as 90%, the average predicted con- [2] J. M. Fiedler and P. D. McGreevy, “Reconciling horse welfare,
sumption is only 2.01 s, and the error rate is 0.12%. This system worker safety, and public expectations: horse event incident
provides powerful means and tools for decision-makers to management systems in Australia,” Animals, vol. 6, no. 3,
 pp. 16–35, 2016.
optimize management, an effective quantitative basis for
 [3] E. Juckes, J. M. Williams, and C. Challinor, “Racing to a
making reasonable training management decisions and
 staffing solution: an investigation into the current staffing
training programs, scientific comparisons for improving horse crisis within the UK horseracing industry,” Comparative
racing performance, and scientific predictions for public Exercise Physiology, vol. 17, no. 1, pp. 73–89, 2021.
participation in horse racing. [4] S. H. Kang and G. S. Park, “Overcoming ethical issues through
 At present, the system can operate normally, but the system symbolic management, cultivating proponents and story-
still has some deficiencies, the function is not perfect, and the telling: the institutionalization of Korea’s horseracing in-
accuracy of the final prediction also needs a large amount of dustry,” Asia Pacific Business Review, vol. 22, no. 3,
data to verify. The next step is to improve the existing system, pp. 439–451, 2016.
continuously improve the association rules and neural network [5] E. Davies, W. McConn-Palfreyman, and J. M. Williams, “The
algorithms, and improve the accuracy of prediction. impact of COVID-19 on staff working practices in UK
 horseracing,” Animals, vol. 10, no. 11, pp. 2003–2034, 2020.
 [6] S. Zhang and M. Liu, “Design of horse race registration system
Data Availability based on wireless network and simulation system,” Techniques
 and Applications, vol. 34, no. 17, pp. 1661–1669, 2021.
The data used to support the findings of this study are [7] K. Clayton-Hathway and U. Fasbender, “Women as leaders
available from the corresponding author upon request. and managers in sports: Understanding key career enablers
 and constraints in the British horseracing industry,” Women,
Conflicts of Interest Business and Leadership, vol. 7, no. 3, pp. 309–322, 2019.
 [8] Z. Ma, “Research on system and developing path of talents
The author declares that there are no known competing collaborative cultivation in horse racing industry between
financial interests or personal relationships that could have hubei and xinjiang,” Education Science and Economic Man-
appeared to influence the work reported in this paper. agement, vol. 16, no. 23, pp. 612–615, 2017.
10 Scientific Programming

 [9] H. Ghezelsefloo, “Designing structural model of elemental,
 behavioral and motivational traits in horse racing betting with
 mix method,” Applied Research in Sport Management, vol. 9,
 no. 2, pp. 99–110, 2020.
[10] K. Fenner, K. Dashper, and J. Serpell, “The development of a
 novel questionnaire approach to the investigation of horse
 training, management, and behaviour,” Animals, vol. 10,
 no. 11, pp. 56–68, 2020.
[11] S. Zhang and M. Liu, “Computer aided management system of
 sports horse registration based on distributed storage system
 and deep Fusion learning,” Microprocessors and Microsystems,
 vol. 56, no. 26, pp. 3144–3153, 2021.
[12] C. Quintana, B. Grimshaw, and H. E. Rockwood, “Differences
 in head accelerations and physiological demand between live
 and simulated professional horse racing,” Comparative Ex-
 ercise Physiology, vol. 15, no. 4, pp. 259–268, 2019.
[13] K. Fenner, M. Hyde, and A. Crean, “Identifying sources of
 potential bias when using online survey data to explore horse
 training, management, and behaviour: a systematic literature
 review,” Veterinary Sciences, vol. 7, no. 3, pp. 18–33, 2020.
[14] Z. Sun and Y. Li, “Research on Chinese speed horse racing
 guessing lottery issuance based on internet big data,” Design
 Engineering, vol. 183, no. 59, pp. 405–476, 2020.
[15] B. Padalino, S. L. Raidal, and E. Hall, “Survey of horse
 transportation in Australia: issues and practice,” Australian
 Veterinary Journal, vol. 94, no. 10, pp. 349–357, 2016.
[16] S. V. R. Hoseini and M. Amani, “Impact of constraints and
 behavioral motivations on loyalty of horse racing spectators,”
 Journal of History Culture and Art Research, vol. 7, no. 2,
 pp. 14–27, 2018.
[17] Y. Xiao, C. Xing, and T. Zhang, “An intrusion detection model
 based on feature reduction and convolutional neural net-
 works,” IEEE Access, vol. 117, no. 2, pp. 103–187, 2019.
[18] R. Y. Chen, “A traceability chain algorithm for artificial neural
 networks using T–S fuzzy cognitive maps in blockchain,”
 Future Generation Computer Systems, vol. 183, no. 23,
 pp. 109–119, 2018.
[19] M. Hahsler and R. Karpienko, “Visualizing association rules
 in hierarchical groups,” Journal of Business Economics, vol. 87,
 no. 3, pp. 317–335, 2017.
[20] T. Osadchiy, I. Poliakov, and P. Olivier, “Recommender
 system based on pairwise association rule,” Expert Systems
 with Applications, vol. 115, no. 12, pp. 1871–1888, 2019.
[21] R. Rekik, I. Kallel, and J. Casillas, “Assessing web sites quality:
 A systematic literature review by text and association rules
 mining,” International Journal of Information Management,
 vol. 38, no. 1, pp. 201–216, 2018.
You can also read