Prediction of hot metal temperature based on data mining - De ...
←
→
Page content transcription
If your browser does not render page correctly, please read the page content below
High Temperature Materials and Processes 2021; 40: 87–98
Research Article
Zhao Jun, Li Xin, Liu Song, Wang Kun, Lyu Qing*, and Liu Erhao
Prediction of hot metal temperature based
on data mining
https://doi.org/10.1515/htmp-2021-0020
received July 30, 2020; accepted March 19, 2021
1 Introduction
Abstract: Accurately and continuously monitoring the The long life of the blast furnace (BF) is the precondition
hot metal temperature status of the blast furnace (BF) is of its high efficiency. One of the main factors which affect
a challenging job. To solve this problem, we propose a the lifespan of the large BF is the lifespan of the hearth.
hot metal temperature prediction model based on the There are many factors that affect the lifespan and high
AdaBoost integrated algorithm using the real production efficiency of the hearth. They all reflect, to some extent,
data of the BF. We cleaned the raw data using the data if the hearth has a good working condition, which is the
analysis technology combined with metallurgical process important sign of the stableness and smoothness of the
theory, which mainly included data integration, outliers operation of the furnace [1].
elimination, and missing value supplement. The redun- The temperature of hot metal can reflect the physical
dant features were removed based on Pearson’s thermo- heat energy well [2] and it is also a symbol of the heat in
dynamic diagram analysis, and the input parameters of the hearth. The high temperature of hot metal during
the model were preliminarily determined by using recursive discharging indicates that the heat inside the hearth is
feature elimination method. We built the hot metal tem- abundant and the hearth is active; otherwise, it indicates
perature prediction model using the AdaBoost ensemble that the hearth is not hot enough and the activity is
algorithm on a dataset with selected features as well as decreased. Therefore, the hot metal temperature can
derived features by using K-mean clustering tags. The
directly reflect the temperature status inside the hearth,
results show that the performance of the hot metal tem-
which is a very important index to measure the thermal
perature prediction model with K-means clustering tags
state of the hearth.
has been further improved, and the accurate monitoring
In order to achieve accurate prediction and optimal
and forecast of molten iron temperature has been achieved.
control of BF smelting, many experts and scholars have
The model can achieve an accuracy of more than 90% with
done a lot of research. Li et al. [3] proposed a kind of limit
an error of ±5°C.
learning machine model based on the grey correlation
Keywords: hot metal temperature, AdaBoost algorithm, degree. Through the grey correlation degree to analyze
K-means clustering, correlation coefficient the correlation between the parameters of BF, the influ-
ence of strong coupling of data brought by the complexity
of BF smelting was effectively reduced, but it was difficult
to determine the optimal value of index, so it depended
too much on the subjectivity of users. Sun et al. [4] pro-
posed the support vector machine (SVM) based on PCA
and least square (LS) method, through PCA to reduce the
* Corresponding author: Lyu Qing, College of Metallurgy and
dimension of input parameters, combined with the LS–SVM
Energy, North China University of Science and Technology,
Tangshan 063009, China, e-mail: neversettle0722@163.com
to build a time series prediction model, which can effec-
Zhao Jun: College of Metallurgy, Northeastern University, tively solve the strong coupling of BF data and the slow
Shenyang 110004, China operation speed of SVM due to the complexity of training
Li Xin, Wang Kun: College of Metallurgy and Energy, North China in the case of multivariables; when the training set was
University of Science and Technology, Tangshan 063009, China
updated, the main factor would fluctuate to affect the pre-
Liu Song: Department of Computer Science and Technology,
Tangshan College, Tangshan 063000, China
diction effect. Chong [5] introduced quantum theory into
Liu Erhao: Technical Centre, Chengde Iron and Steel Group Co., Ltd., the neural network model based on genetic theory in order
Chengde 067000, China to solve the problems such as easy fitting ahead of time and
Open Access. © 2021 Zhao Jun et al., published by De Gruyter. This work is licensed under the Creative Commons Attribution 4.0 International
License.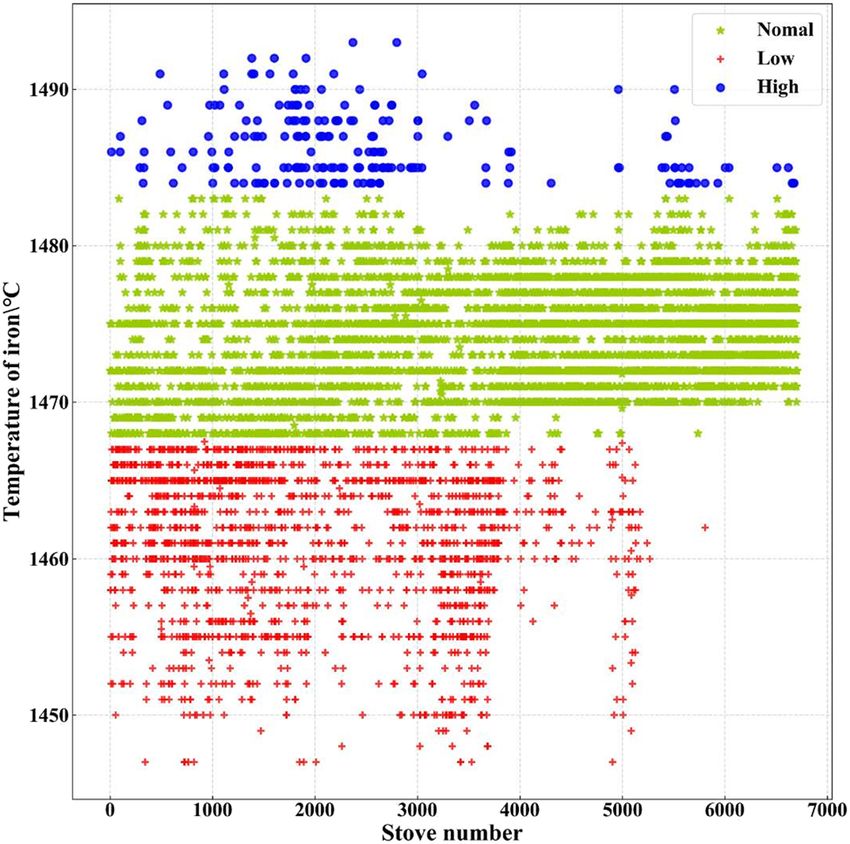
88 Zhao Jun et al.
limitation of optimization process of genetic algorithm furnace. During the heat exchange between the furnace
neural network model, which successfully combined the and the gas flow, the reduction reaction takes place. The
diversity of quantum theory and the accuracy of neural iron oxide in the ore is gradually reduced to iron under
network, weakened the dependence on initial conditions, the action of gas CO, H2, etc. The hot air and fuel are
and ensured the training effect of algorithm on data, but injected from the tuyere on the upper part of the hearth,
there were problems such as large data demand and poor react with the solid coke to produce the high-temperature
network extension. gas flow moving from the bottom to the top, and finally
By collecting a large number of original data, big data are discharged from the top of the furnace for recovery.
technology can find potential relationship among data The ore is heated and softened by the gradual rising tem-
by using complex analysis model [6]. This advanced tech- perature in the process of moving down the burden, and
nology can provide a more reliable basis for decision- finally the hot metal drops into the hearth for storage,
making, effectively avoid risk accidents, and obtain con- and the ash and other impurities form the slag floating
siderable returns. At present, big data technology has been on the hot metal to realize the separation. Finally, the hot
successfully applied in many aspects of the industrial metal and slag are discharged regularly to ensure that
field, such as predicting the strength of rock materials there is enough space in the hearth to maintain the con-
[7], predicting the air overpressure caused by blasting tinuity of the smelting process [10–12].
[8], soil classification [9], etc., which promote the industry There are many factors affecting the temperature of
into a new era of innovation and change. hot metal; the nature of raw materials, operation system,
The hot metal temperature is closely related to the smelting equipment, and production cycle all affect the
working state of the hearth. A moderate molten iron tem- variation trend of hot metal temperature more or less.
perature is beneficial to the smooth flow of slag and iron Only when the furnace temperature changes greatly,
inside the hearth of the BF; while if the temperature of the the BF operator will change the raw material ratio. Since
molten iron is too high or too low it will cause the BF the detection of raw material properties had the defects of
to develop in a bad direction, increasing the risk of BF pro- time asynchrony and serious lack of data, the influence of
duction accidents. In order to avoid the occurrence of fur- raw material and fuel properties on the prediction of hot
nace heating and furnace cooling conditions caused by metal temperature is not considered here [13–15].
manual judgment errors, a research on real-time monitoring There are two parts to control the temperature of hot
of the hearth status was carried out. This article adopts the metal by the operation system: in the upper part, the
massive BF production data collected by the steel mill to position distribution of ore and coke in the furnace is
carry out standardized data preprocessing on the original controlled by adjusting the distribution mode, so as to
data and divides the data set into a training set and a test adjust the air permeability in the furnace and ensure
set. Because the K-means clustering algorithm has fast con- the stable downward movement of the furnace charge.
vergence speed, few tuning parameters, and good interpret- In the lower part, the combustion reaction is controlled
ability, this method is used to cluster historical hot metal by adjusting the air supply system and the injection
temperature, and the clustering results are analyzed and system, so that the hearth area can maintain good thermal
verified through metallurgical process experience. In this state [16]. In daily production, the operator mainly con-
article, we used the AdaBoost integrated algorithm to predict trols the hot metal temperature by adjusting the operation
the temperature of the hot metal in the production process system. Therefore, this article selected the smelting data of
due to its high accuracy and good generalization ability. The nearly 7,000 heat and 71 parameters covering the various
accuracy of the prediction results was verified using actual operation systems (including top state, air supply state,
production data. This model can provide effective guides for injection state, etc.) of the smelting process.
the on-site operators to stabilize the working state of the
hearth and to control the hearth in real time.
3 Data processing
2 Theoretical analysis of iron
making process 3.1 Data collation
The whole process of BF smelting can be summarized The principle of data collation is to organize data into
as follows: the burden enters the BF from the top of the neat, clear, and easy-to-use data forms.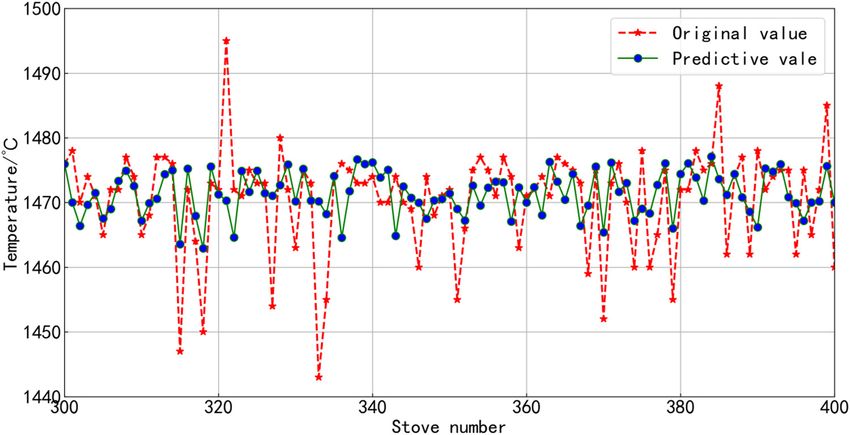
Prediction of hot metal temperature based on data mining 89
3.1.1 Data classification one detection point for a certain position in the BF (Table 1),
it was considered to integrate these monitoring points to
BF smelting is a production process which includes mul- obtain a new variable to represent these multiple points.
tiple operating systems in cooperation. Because the data After treatment, the number of parameters was
of the steel plant were all stored in one database, they reduced from 71 to 52.
were messy and unclear. We organized the data according
to their subject; put the parameters belonging to the same
process together.
3.2 Data cleaning
3.1.2 Data alignment Data cleaning is an essential step in data preprocessing.
It mainly uses mathematical methods to remove redun-
First, the collected data were integrated by heat. Since dant data, modify abnormal data, and fill in vacancy data.
the selected input parameters were collected according to
the frequency of the minute (there was no corresponding
data set with the frequency of the furnace), all the data 3.2.1 Deduplication
were needed to be integrated by the heat. Taking the
collection time of hot metal temperature as the node, One part of the duplicate data was generated by the
from the beginning of the previous furnace to the end repeated entry of data caused by mechanical failure or
of the next furnace, all data in the period of parameter manual entry, and the other part was caused by the
selection were added and averaged to reflect an average repeated selection and connection of data caused by
level state of the parameter in this period. Then, a new software when the data were connected in the database.
data set was formed by aligning the processed para- Duplicate data are generally deleted directly.
meters with the hot metal temperature according to the
heat. The number of batches was needed to be handled
separately. As the recording method of material batch 3.2.2 Handling of abnormal data
number was cumulative material batch number, it was
necessary to subtract the cumulative measurement of Abnormal data refer to data points that are obviously
material batch between two tapping to obtain the corre- different from the overall data distribution, also known
sponding material batch number of this tapping. as outliers. This kind of data was usually caused by
Second, the repetitive measurement points of para- equipment failure. Since the data set used in the experi-
meters were integrated. Because there may be more than ment was a large sample data set, it was possible to mark
Table 1: Variable consolidation list
New variable Original variable Treatment
Upper differential pressure 1# Upper differential pressure, 2# Upper differential pressure Arithmetic mean
3# Upper differential pressure, 4# Upper differential pressure
Lower differential pressure 1# Lower differential pressure, 2# Lower differential pressure Arithmetic mean
3# Lower differential pressure, 4# Lower differential pressure
Top pressure 1# Top pressure, 2# Top pressure Arithmetic mean
Top temperature 1# Top temperature, 2# Top temperature Arithmetic mean
3# Top temperature, 4# Top temperature
Standard wind speed Standard speed, standard wind speed Arithmetic mean
Actual wind speed Actual speed, actual wind speed Arithmetic mean
Hot blast temperature Hot blast temperature (TEHOT), hot blast temperature Arithmetic mean
Hot blast main pipe temperature A
Hot blast pressure Hot blast pressure 02, hot blast pressure, main pipe hot blast pressure Arithmetic mean
Cold blast pressure Cold blast pressure CW, cold blast pressure Arithmetic mean
Ventilating index BF body ventilating index, ventilating index Arithmetic mean
Blast kinetic energy Blast kinetic energy KG, blast kinetic energy Arithmetic mean
90 Zhao Jun et al.
the large error data beyond the range of 3σ by using the and vacancy data are usually filled instead of completely
Pauta criterion [17,18]. The corresponding relationship deleted.
between actual physical meaning and parameter name The Lagrange linear interpolation method is a common
is shown in Table 2. It can be seen from Figure 1 that method in the regression algorithm. It connects two or more
most of the parameters have abnormal data and the non-null data and fits the vacant value according to the
amount of abnormal data is unequal, so correction was proposed function. Generally, the most commonly used
needed. The specific correction method was needed to be methods are linear interpolation and square interpolation
combined with the processing method of the vacancy [19]. In this article, a linear interpolation method is selected,
value. using two adjacent points on the left and right sides of the
missing value to fill in the missing value by constructing a
straight line.
3.2.3 Processing of missing value
There are two reasons for the missing value: one is
mechanical reason, which is caused by mechanical 4 Parameter selection
failure in data collection; the other is human reason,
which is caused by human subjective error or inten- BF smelting process parameters consist of state para-
tional act. BF smelting is a continuous production process. meters and material flow parameters. The state para-
In order to ensure the continuity of time, abnormal data meters mainly refer to the equipment state parameters
Table 2: Correspondence between actual physical meaning and parameter name
Actual physical meaning Parameter name Actual physical meaning Parameter name
Valve seat temperature VST Top pressure TP
Hot blast pressure HBP Oxygen flow OF
Oxygen pressure and hot blast pressure OPHBPD Oxygen pipe temperature OPT
difference
Top temperature TT Blast kinetic energy BKE
Hot blast temperature HBT Cold blast pressure CWP
Oxygen-enriched flow rate OEFR Oxygen pipeline pressure OPP
Standard wind speed SWS Lower differential pressure LDP
Ventilating index VI Flow of cold wind FCW
Pressure of air cooling main in front of furnace PACMF Gas utilization rate GUR
Online analysis of gas OAG CO2 online analysis COA
Number of tuyeres NT Nitrogen press NP
Nitrogen flow NF Actual wind speed AWS
Tuyere area TA Oxygen-enriched content OEC
Flow of nitrogen in main pipe FNMP Production of blast furnace gas PBFG
Oxygen-enriched pressure OEP Gas main pipe pressure GMPP
Upper differential pressure UDP Total soft water flow of blast furnace TSWFBF
Theoretical combustion temperature TCT Supplementing water pressure for emergency SWPE
Pressure of main water supply pipe of bottom PMWSPBCW Pressure of high-pressure water main pipe PHPWMP
cooling water
Soft water supply loop pressure SWSLP Flow of high pressure water in main pipeline FHPWMP1564
(No. 1564)
Atmospheric water pressure AWP Heat load HL
High-pressure water pressure PHWP Inlet water temperature IWT
Top cooling water temperature TCWT Top cooling water return temperature TCWRT
Top cooling water pressure TCWP Number of iron notch NIN
Depth of taphole DT Blast furnace load BFL
Cooling water flow of furnace top CWFFT Batch number BN
Flow of high pressure water in main pipeline FHPWMP1563 — —
(No. 1563)
Prediction of hot metal temperature based on data mining 91
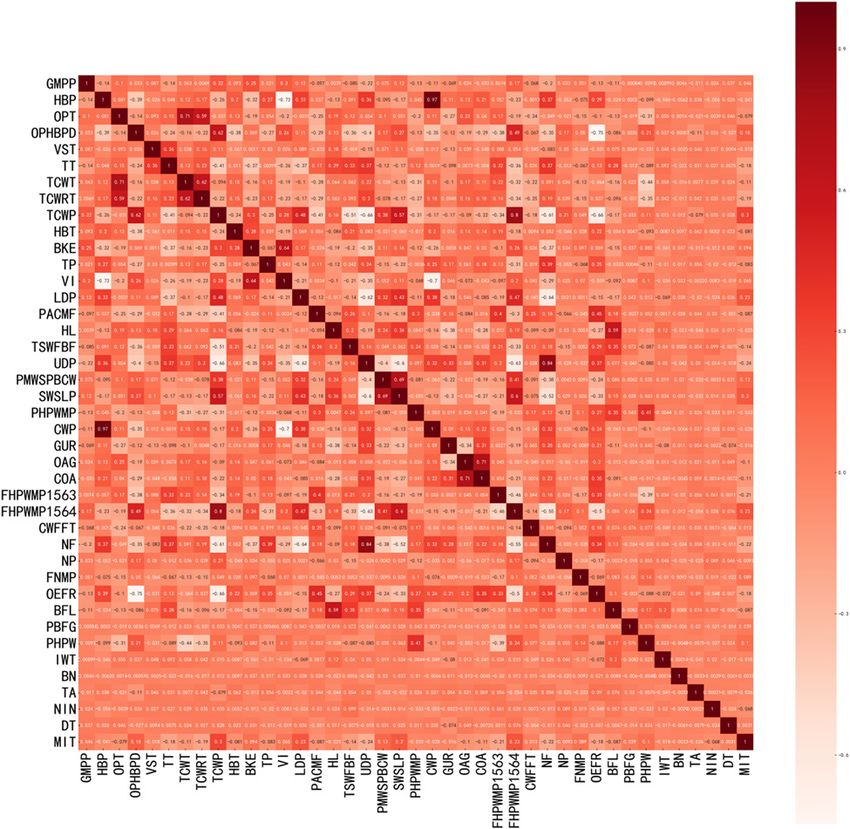
Figure 2: Heatmap of Pearson correlation coefficient.
The absolute value of Pearson correlation coefficient in
different intervals has different meanings:
∣r∣ < 0.3 Weak correlation
Figure 1: Number of outliers for each parameter.
0.3 ≤ ∣r∣ < 0.5 Low correlation
(1)
0.5 ≤ ∣r∣ < 0.8 Moderate correlation
0.8 ≤ ∣r∣ ≤ 1 High correlation
and smelting state parameters of the whole BF. The mate-
When Pearson correlation coefficient is in the region
rial flow parameters mainly include the quantity and
of high correlation, that is, when 0.9 ≤ ∣r∣ ≤ 1, the degree
attribute parameters of all the input and output materials
of information redundancy between parameters is very
of the BF. In the process of modeling, reasonable selec-
high, which needs to be processed.
tion of input parameters can maximize the efficiency of
the model, reduce the operation time, and improve the
accuracy of the model prediction.
4.2 Feature selection
4.1 Data correlation analysis 4.2.1 Importance analysis
Pearson correlation coefficient (R) is a linear correlation Importance analysis is to calculate the contribution degree
coefficient, which is also most commonly used to describe of each parameter to the target parameter according to the
the degree of correlation between parameters [20]. The algorithm and sort the parameters according to the score.
range of correlation coefficient is from −1 to 1; greater It is a method of directly selecting parameters through the
than 0 means positive correlation, less than 0 means internal algorithm of the model [21]. In this way, we obtain
negative correlation, and the larger the absolute value the sensitivity relationship between each variable and the
is, the stronger the correlation is. target value, and the target value is more affected by the
Figure 2 is the thermodynamic diagram of Pearson top-ranked variables (i.e., the target value is more sensi-
correlation coefficient between parameters. The darker tive to the top-ranked variables).
the color is, the higher the positive correlation is, and the Figure 3 is a feature importance ranking diagram
lighter the color is, the higher the negative correlation is. obtained by using a decision tree-based gradient boosting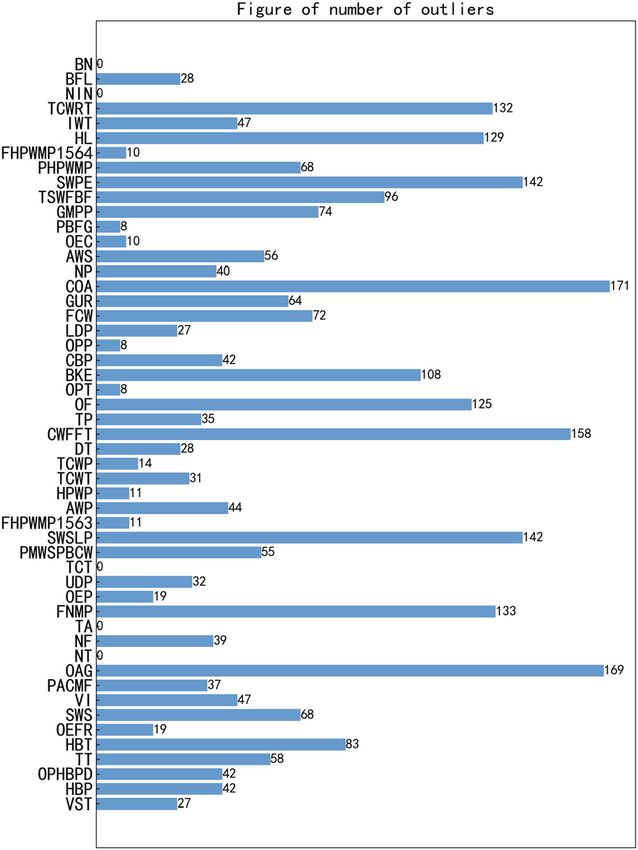
92 Zhao Jun et al.
Figure 4: Selection of the best number of features.
Figure 3: Model-based importance ranking. select the feature with the best score through repeated
modeling, and then repeat the process for the remaining
features until all samples have been tested at least once,
and then sort the features according to the score value to
algorithm. It can be seen from the figure that each feature
select the optimal feature subset [22]. The number of
is ranked from small to large according to the importance
optimum features can be found by the cross-validation
score: tuyere area, depth of taphole, number of iron notch,
method of recursive feature elimination. Cross-validation
batch number, cooling water flow of furnace top, cold
is a method of cyclic iteration based on the cut sample set.
blast pressure, soft water supply loop pressure, hot blast
The obtained sample data are repeatedly divided into dif-
pressure, pressure of high-pressure water main pipe, inlet
ferent training sets and test sets. The training set is used to
water temperature, pressure of main water supply pipe of
train the model and the test set is used to evaluate the
bottom cooling water, flow of high pressure water in main
quality of model prediction [23]. On this basis, multiple
pipeline (No. 1564), top pressure, high-pressure water
sets of different training sets and test sets can be obtained.
pressure, valve seat temperature, nitrogen flow, top cooling
A sample in a training set may become a sample in a test set
water temperature, oxygen pipe temperature, pressure of
next time, which becomes a cross. Collect the sum of the
air cooling main in front of furnace, gas main pipe pressure,
square error of each sample after inspection.
nitrogen press, ventilating index, top temperature, hot blast
It can be seen from Figure 4 that with the continuous
temperature, oxygen pressure and hot blast pressure differ-
addition of parameters, the score of the model gradually
ence, flow of nitrogen in main pipe, upper differential pres-
rises and tends to be stable. It was found that when the
sure, blast kinetic energy, gas utilization rate, CO2 online
number of feature subsets was 33, the score of cross-
analysis, flow of high pressure water in main pipeline
validation was the highest, so the number of feature subsets
(No. 1563), online analysis of gas, top cooling water return
is 33. The classification and summary results of the model
temperature, production of BF gas, heat load, oxygen-
input parameters are shown in Table 3.
enriched flow rate, lower differential pressure, BF load, total
soft water flow of BF, and top cooling water pressure.
5 Model construction
4.2.2 Determination of the number of optimum features
The most intuitive effect of a good model is to improve the
Based on the recursive feature elimination and cross-vali- accuracy of prediction and reduce the prediction time.
dation methods, the forward selection method is used to The AdaBoost integrated tree algorithm in the integrated
select the parameters in combination with the importance model was used to construct the prediction model. The
of feature parameters and the model prediction accuracy. AdaBoost model has good self-adaptability. Through con-
RFE, also known as feature recursion elimination, is to tinuous training and autonomous weighting, the error is
Prediction of hot metal temperature based on data mining 93
Table 3: Summary table of model input parameters and output 5.1.2 Algorithm principle
parameters
The whole AdaBoost iterative algorithm is roughly divided
Parameter Top state Injection Body Equipment into three steps:
category state state status
(1) Initialize the weight distribution of training data.
Parameter VST HBP VI PACMF Each training sample is given the same weight at
name TT OPHHBPD UDP NF the beginning.
OAG HBT BKE FNMP
(2) The weight distribution of the weak classifier is opti-
TCWT OPT UDP FHPWMP1563
TCWP OEFR BFL NP
mized iteratively.
COA HL GMPP (3) Each training weak classifier is combined into a
PBFG GUR TSWFBF strong classifier according to the weight αt .
TCWRT FHPWMP1564
TP PMWSPBCW The core formula of the algorithm is as follows:
PHPW
IWT T
PHWP Hfinal = sign( f (x )) = sign ∑ αt Ht (x ), (2)
t=1
where Hfinal is the final strong classifier; αt is the weight of
minimized to achieve a good prediction effect. However, the weak classifier; and Ht is the basic classifier.
AdaBoost integrated tree model is sensitive to outlier sam-
ples. In order to make up for this big defect, K-means clus-
tering method is introduced based on the idea of classifica-
tion. K-means clustering was used to classify the hot metal 5.2 Hot metal temperature clustering based
temperature into highly similar classes, eliminating the dif- on K-means algorithm
ferences caused by outliers and further improving the pre-
diction accuracy and hit rate. 5.2.1 K-means algorithm
In the process of model construction, random sam-
pling is first used to divide the sample into a training set AdaBoost integrated tree algorithm cannot capture discrete
and a test set at a ratio of 9 to 1. Then, two sets of values effectively.
different input parameters (33 input parameters obtained Considering that the temperature of hot metal fluc-
by parameter screening and 34 input parameters derived tuates greatly in the whole cycle, in order to improve the
with K-means clustering result tags) are used to construct prediction accuracy and capture the change trend of hot
a hot metal temperature prediction model based on the metal temperature more effectively, the temperature of
AdaBoost ensemble tree algorithm, and the hyperpara- hot metal was first processed by K-means clustering
meters of the model are optimized by a combination of and then mining and learning were carried out according
grid search and cross-validation. Finally, the performance to the characteristics of different categories of data.
of the two sets of models was verified and compared. K-means clustering is one of the most typical and
commonly used clustering algorithms, which has the
advantages of good effect, fast, and simple. The main
5.1 AdaBoost algorithm idea of this algorithm is to get the final clustering result
by giving the number of clustering centers in advance
5.1.1 Algorithm introduction and iterating until the error value of the objective func-
tion converges. The specific process steps [26,27] are as
AdaBoost, an abbreviation of “adaptive boosting,” was follows:
proposed in 1995 [24,25]. Its adaption lies in: when the (1) Select K objects randomly, each of which represents
sample data are misclassified, the given weight will be the initial value of a cluster center;
improved; the weighted sample will be used to train the (2) Calculate the distance between the remaining objects
classifier again. At the same time, a new weak classifier and the cluster center and classify them according to
will be added until it reaches the predetermined small the distance;
error rate or the predetermined maximum number of (3) Recalculate the average value of each cluster popula-
iterations. tion and update the cluster center;94 Zhao Jun et al.
prior analysis. When the temperature of hot metal is
between 1,468–1,482°C, it can be regarded as stable and
normal state; when it is higher than 1,482°C, it is consi-
dered as high; when it is lower than 1,468°C, it is consi-
dered as low. The final cluster centers are 1,460, 1,472,
and 1,480°C.
5.3 AdaBoost prediction model based
on K-means clustering results
The 33 variables determined in the parameter screening
process and the 34 input variables added with the clus-
tering results were used as the input parameters of the
AdaBoost prediction model, and the hot metal tempera-
ture prediction model was established using the AdaBoost
integrated algorithm model. The method of combining
grid search and cross-validation is used to optimize the
Figure 5: Result of K-means clustering.
model hyperparameters, and the performance of the fore-
cast model is adjusted to the best. Table 4 shows the
(4) Repeat steps 2 and 3 until the cluster center no longer optimal hyper parameter set obtained.
changes. Figure 6 shows the comparison curve between the
predicted results and the actual values based on AdaBoost
model; Figure 7 shows the construction of prediction model
using AdaBoost algorithm on the basis that the tempera-
5.2.2 Hot metal temperature clustering ture range of hot metal has been determined.
It can be seen from Figures 6 and 7 that the prediction
The hot metal temperature data of 6,702 heats from 2017 to results of AdaBoost integrated tree model based on
2018 were collected and clustered by K-means clustering K-means clustering algorithm are more accurate than
method. the actual data values only using AdaBoost mode, which
The number of clusters is 3, and the initial cluster can not only predict the trend of hot metal temperature,
centers are 1,450, 1,475, and 1,490°C. The clustering but also capture the data points with large fluctuations.
results are shown in Figure 5. It can be seen from Figure 8 shows the changes in the prediction error of
Figure 5 that the number of sample subsets with hot the AdaBoost model after adding the K-means clustering
metal temperature of 1,450, 1,475, and 1,490°C as cluster results. It can be seen that after adding the clustering
centers is 4,740, 1,761, and 205, respectively. In contrast, label, the performance of the model is improved signifi-
the number of samples with the hot metal temperature of cantly, and it is basically stable at about ±5°C. Such model
1,490°C as the cluster center is relatively small. The result performance can play a good guiding role for on-site hot
based on K-means clustering is almost the same as that of metal temperature monitoring and advance prediction.
Table 4: Model hyperparameter optimization results
Model categories Base Number of Learning Fixed seed for Fixed seed for Regression loss
estimator estimators rate random generator random generator function
Benchmark model Tree 90 0.06 1 SAMME.R Exponential()
Benchmark model for Tree 80 0.7 1 SAMME.R Exponential()
adding cluster labelsPrediction of hot metal temperature based on data mining 95
Figure 6: Result of AdaBoost model.
Figure 7: AdaBoost prediction result graph based on K-means clustering.
5.4 Model evaluation AdaBoost integrated tree model is relatively low under
the same accuracy. It showed that the introduction of
By using only AdaBoost integration tree and AdaBoost K-means clustering method successfully eliminated the
integration tree based on K-means clustering algorithm, defect that the accuracy of AdaBoost prediction model
two models for predicting hot metal temperature were decreases due to outliers.
constructed, respectively. This article summarized the In addition, we also compared the i10-index of the
prediction hit rate (Table 5) and model evaluation index AdaBoost integrated tree model based on K-means clus-
results (Table 6) of the two models to comprehensively tering and the AdaBoost integrated tree model. The i10-
evaluate the effects of the two models. index values of the two models are 0.8663 and 0.6775,
It can be seen from Tables 5 and 6 that the prediction respectively. The results of the AdaBoost integrated tree
results of the AdaBoost integrated tree model based on model based on K-means clustering seem to have not yet
K-means clustering have a hit rate of more than 90% reached the ideal range (0.90–1.00) [28]. However, for the
under the accuracy of ±5°C and more than 70% under iron and steel industry, where the environment is change-
the accuracy of ±3°C; by comparison, the hit rate of the able and complex, people pay more attention to the hit rate96 Zhao Jun et al.
inside the BF are necessary for the future development
of the BF ironmaking industry.
Promoting the digital transformation of the iron-
making process and the intelligent upgrading of BF pro-
duction require a full combination of technologies such
as big data platforms, artificial intelligence algorithms,
and metallurgical process theory. The construction of a
big data platform for the steel industry is the foundation.
By integrating all the data information of the iron and
steel industry, we can fully supervise the coordinated
operation of various processes and conduct more accu-
rate operation status analysis and decision optimization.
With the help of advanced artificial intelligence algo-
rithm technology, we can attain the precious values in
the massive historical data of iron and steel enterprises,
Figure 8: Errors in the prediction results of the two models.
so as to better guide the current production operation and
(a) AdaBoost model; (b) AdaBoost ensemble tree model based
on K-means clustering algorithm.
parameter monitoring. In addition, metallurgical process
theory and field operation experience are extremely valu-
able. This part of knowledge is solidified in the big data
Table 5: Prediction accuracy between the three models/% platform and forecast model of the ironmaking industry
to realize the true landing of the digitalization of the iron
Accuracy AdaBoost AdaBoost integration tree and steel industry, so as to obtain long-term guiding signi-
integration tree based on K-means clustering ficance for on-site production.
±3°C 43.07 71.98 Due to the limitation of the current monitoring method,
±5°C 63.64 92.40 the hearth temperature cannot be detected directly. The
±10°C 87.93 99.55 changing trend of the hearth temperature can only be cap-
tured by constructing a high-precision prediction model of
hot metal temperature. The future work should focus on the
Table 6: Comparison of prediction accuracy between the three long period optimization of hot metal temperature predic-
models tion, in order to achieve stable production, extend the life of
the BF, and improve the utilization efficiency of the BF.
Evaluation AdaBoost AdaBoost integration
index integration tree tree based on K-means
clustering
R2 0.15 0.78 6 Conclusion
MSE 52.28 13.28
MAE 5.24 2.59
i10-index 0.6775 0.8663
(1) After using big data technology for cleaning, corre-
spondence, and analysis, 33 BF operation parameters,
including, valve seat temperature, hot blast pressure,
of the model within a specific error range. Since our model oxygen pressure and hot blast pressure difference,
can achieve a hit rate of 92.40% at ±5°C, it can play a good upper differential pressure, hot blast temperature,
guiding role in actual steel production. ventilating index, pressure of air cooling main in
front of furnace, online analysis of gas, nitrogen
flow, tuyere area, flow of nitrogen in main pipe, upper
differential pressure, pressure of main water supply
5.5 Future work pipe of bottom cooling water, soft water supply loop
pressure, flow of high-pressure water in main pipe-
With the deep integration of industrial big data, new line (No. 1563), top cooling water supply temperature,
ironmaking technology, and information automation, top cooling water pressure, oxygen pipe temperature,
the establishment of a high-precision BF ironmaking blast kinetic energy, lower differential pressure, gas
prediction model and the realization of the white box utilization rate, CO2 online analysis, permeabilityPrediction of hot metal temperature based on data mining 97
index, nitrogen press, production of BF gas, gas main [5] Yan, C., Hot metal temperature forecast research based
pipe pressure, total soft water flow of BF, flow of onquantum genetic neural networkp, Northeastern University,
high-pressure water in main pipeline (No. 1564), Shenyang City, China, 2014 (in Chinese).
[6] Hu, J. Q. and E. Rose. Predictive fuzzy control applied to the
heat load, top cooling water return temperature,
sinter strand process. Control Engineering Practice, Vol. 5,
iron notch, BF load, oxygen-enriched flow rate, were No. 2, 1997, pp. 247–252.
selected as the input characteristics of the model. [7] Li, D., D. J. Armaghani, J. Zhou, S. H. Lai, and M. Hasanipanah.
(2) By comparing the prediction results of AdaBoost model A GMDH predictive model to predict rock material strength
and K-means classification-based AdaBoost model, using three non-destructive tests. Journal of Nondestructive
Evaluation, Vol. 39, 2020, id. 81.
it was found that the latter has the advantages of
[8] Hh, A. and B. Dja. Prediction of air-overpressure induced by
higher accuracy and more accurate hit. When the accu- blasting using an ANFIS-PNN model optimized by GA –
racy was increased to ±5°C, the former had only 63.64% ScienceDirect. Applied SoftComputing, Vol. 99, 2020,
accuracy, while the latter had 92.40% accuracy. When id. 106904.
the accuracy was increased to ±3°C, the former had only [9] Pham, B. T., C. Qi, L. S. Ho, T. Nguyenthoi, N. Alansari, and
M. D. Nguyen. A novel hybrid soft computing model using
43.07% accuracy, the latter still has a hit rate of 71.98%
random forest and particle swarm optimization for estimation
of undrained shear strength of soil. Sustainability, Vol. 27,
2020, id. 100508.
Funding information: Thanks are given to the financial [10] Feng, Q. M., T. Li, X. H. Fan, and T. Jiang. Adaptive prediction
supports from the key Program of National Nature Science system of sintering through point based on self-organize
Foundation of China (U1360205) and Science and Technology artificial neural network. Transactions of Nonferrous Metals
Society of China, Vol. 10, No. 6, 2000, pp. 804–807.
Project of Hebei Education Department (BJ2021099).
[11] Nath, N. K. and K. Mitra. Optimisation of suction pressure for
iron ore sintering by genetic algorithm. Ironmaking &
Author contributions: Zhao Jun: Conceptualization, Steelmaking, Vol. 31, No. 3, 2004, pp. 199–206.
Methodology, Writing original draft. Li Xin: Conceptualiza- [12] Li, M. H. and Y. F. Sun. Study of the fuzzy control system for
tion, Methodology, Writing original draft. Liu Song: burning through point of sintering. Journal of Huazhong
Modelling, Validation, Formal analysis, Manuscript University ofScience and Technology, Vol. 32, 2004, id. 71
(in Chinese).
revision. Kun Wang: Investigation, Data management,
[13] Tetc, F. Sinter operation control system with artificial intelli-
Modelling, Visualization. Lyu Qing: Resources, Review gence. Kawasaki Steel GIHO, Vol. 23, No. 3, 1991, pp. 203–209
& Editing, Supervision. Liu Erhao: Resources, Review & (in Japanese).
Editing, Supervision. [14] Vescovi, M. R., M. M. Lamega, and A. Farquhar. Modeling and
simulation of a complex industrial process. IEEE Expert,
Vol. 12, No. 3, 2002, pp. 42–46.
Conflict of interest: Authors state no conflict of interest.
[15] Wu, X. F. and R. FeiM. Fuzzy control applied to burning through
point based on support vector machines prediction model.
Data availability statement: The raw/processed data required Journal of Zhejiang University, Vol. 41, 2007, id. 1722
to reproduce these findings cannot be shared at this time as (in Chinese).
the data also forms part of an ongoing study. [16] Zhou, H., J. P. Zhao, and C. E. Loo. Model predictions of
important bed and gas properties during iron ore sintering. ISIJ
International, Vol. 52, No. 12, 2012, pp. 2168–2176.
[17] Liu, H. and C. Chen. Data processing strategies in wind energy
forecasting models and applications: a comprehensive review.
References Applied Energy, Vol. 249, No. 1, 2019, pp. 392–408.
[18] Ye, Y., M. Wang, and S. Yao. Big data processing framework for
[1] Dawson, P. R., Recent developments in iron ore sintering. Part manufacturing. Procedia CIRP, Vol. 83, 2019, pp. 661–664.
2. Research studies on sintering and sinter quality. [19] Boorboor, S., H. Jafari, and S. Feghhi. Development of a novel
Ironmaking & Steelmaking, Vol. 20, No. 2, 1993, pp. 137–143. approach for precise pulse height extraction using Lagrange
[2] Fan, X. H., Mathematical models and expert systems of iron ore interpolation. Nuclear Instruments & Methods in Physics
agglomeration, Science Press, Beijing, 2013, 8 (in Chinese). Research, Vol. 919, 2019, pp. 82–88.
[3] Li, A. L., Y. M. Zhao, and G. M. Cui. Prediction model of blast [20] Mu, Y. S., X. D. Liu, and L. D. Wang. A Pearson’s correlation
furnace temperature based on ELM with grey correlation ana- coefficient based decision tree and its parallel implementa-
lysis. Journal of Iron and Steel Research, Vol. 27, 2015, id. 33 tion. Information Sciences, Vol. 435, 2018, pp. 40–58.
(in Chinese). [21] Liu, S., Q. Lyu, X. J. Liu, Y. Q. Sun, and X. S. Zhang. A prediction
[4] Cui, G. M., T. Sun, and Y. Zhang. Forecast of blast furnace hot system of burn through point based on gradient boosting
metal temperaturebased on least support vector machine. decision tree and decision rules. ISIJ International, Vol. 59,
Computer Simulation, Vol. 30, 2013, id. 354 (in Chinese). No. 12, 2019, pp. 2156–2164.98 Zhao Jun et al.
[22] Guyon, I., J. Weston, S. Barnhill, and V. Vapnik. Gene selection [26] Zahra, S., M. A. Ghazanfar, A. Khalid, M. A. Azam, U. Naeem,
for cancer classification using support vector machines. and A. Prugel-Bennett. Novel centroid selection
Machine Learning, Vol. 46, No. (1–3), 2002, pp. 389–422. approaches for KMeans-clustering based recommender
[23] Liu, S., Q. Lyu, X. J. Liu, and Y. Q. Sun. Synthetically predicting systems. Information Sciences, Vol. 320, 2015,
the quality index of sinter using machine learning model. pp. 156–189.
Ironmaking & Steelmaking, Vol. 47, No. 7, 2020, pp. 828–836. [27] Huang, X. H., Y. M. Ye, H. F. Guo, Y. Cai, H. J. Zhang, and Y. Li.
[24] Asim, K. M., A. Idris, T. Iqbal, and F. Martínez-Álvarez. Seismic DSKmeans: a new kmeans-type approach to discriminative
indicators based earthquake predictor system using genetic subspace clustering. Knowledge-Based Systems, Vol. 70,
programming and AdaBoost classification. Soil Dynamics and 2014, pp. 293–300.
Earthquake Engineering, Vol. 111, 2018, pp. 1–7. [28] Armaghani, D. J. and P. G. Asteris. A comparative study of ANN
[25] He, Y. L., Y. Zhao, X. Hu, X. N. Yan, Q. X. Zhu, and Y. Xu. Fault and ANFIS models for the prediction of cement-based mortar
diagnosis using novel AdaBoost based discriminant locality materials compressive strength. Neural Computing and
preserving projection with resamples. Engineering Applications, 2020, doi: 10.1007/s00521-020-05244-4.
Applications of Artificial Intelligence, Vol. 91, 2020, id. 103631. (published online).You can also read