Teaching K-12 Classrooms Data Programming: A Three-Week Workshop with Online and Unplugged Activities
←
→
Page content transcription
If your browser does not render page correctly, please read the page content below
© 2021 IEEE. This is the author’s version of the article. This paper has been peer-reviewed and accepted to VisActivities: 2nd IEEE VIS Workshop on Data Vis
                                                 Activities to Facilitate Learning, Reflecting, Discussing, and Designing, held in conjunction with IEEE VIS 2021, New Orleans, LA, USA. 2021 The final version of
                                                 this record is available at: https://visactivities.github.io

                                             Teaching K-12 Classrooms Data Programming: A Three-Week Workshop
                                                              with Online and Unplugged Activities
                                                         Alpay Sabuncuoğlu*                                        A. Evren Yantaç †                                            T. Metin Sezgin‡
                                                Koç University - Is Bank AI Center               Koç University - KUAR - Arçelik Research Center                     Koç University - Is Bank AI Center
                                                                                                             KARMA Mixed Reality Lab

                                         A BSTRACT                                                                                   smartphone to scan these cards and process data, as seen in Figure 2.
                                         This paper shares our experience in a three-session online workshop                         Marti mobile web application can recognize these cards using the
                                         using a new web-based data programming environment, Marti. The                              device camera and opens a pop-up screen to enter the required input.
                                         programming environment uses a card-based programming strat-                                Lastly, students can use Marti’s desktop web application. Figure 1
arXiv:2110.05303v1 [cs.HC] 11 Oct 2021

                                         egy in both unplugged and online activities. Educators can use the                          shows the web application which uses visual programming cards to
                                         physical cards in a board-game style or use the programming envi-                           build data manipulation pipelines and visualizations using its drag
                                         ronment’s mobile application to scan these cards and render the final                       and drop interface.
                                         visualization on their phones/tablets. The web environment also uses                           A total of 24 middle and high school students from various re-
                                         visual draggable cards for programming that can manipulate and                              gions of Turkey attended to our three-session workshops. First,
                                         visualize data. We used Marti and its offered unplugged activities in                       they used Marti’s unplugged activities using physical cards. Then,
                                         three sessions with 12 middle school and 12 high school students,                           they built data pipelines and visualizations using the web interface.
                                         focusing on the data fundamentals, analysis, and visualization. We                          Overall, the students had different devices; some had only smart-
                                         assert that integrating unplugged-style pseudo-code creation and                            phones/tablets, while others had access to computers. Thus, Marti
                                         supporting a similar experience using the available devices have                            allowed us to complete various data-literacy activities regardless of
                                         considerable potential for delivering equal and affordable data pro-                        the devices’ screen sizes and capabilities. In this paper, we present
                                         gramming education for all.                                                                 the workshop activity flow, share our resources and report our expe-
                                            Our activity resources are available at https://github.com/                              riences.
                                         karton-project/marti
                                         Index Terms:      Applied computing—Interactive learning
                                         environments—; Human-centered computing—Field Studies—

                                         1    I NTRODUCTION
                                         Programming, data literacy, and analysis have become an interest
                                         in K-12 classrooms [11]. Educators and policy-makers try to find
                                         the right tools to introduce data analysis and visualization methods
                                         to students. On the other hand, choosing the apt tools is difficult
                                         as the recent interest in data literacy increased the number of new
                                         applications. Most curricula traditionally suggest using spreadsheet
                                         applications (e.g., Microsoft Excel, LibreOffice Calc, Google Sheets)
                                         and prepare curricular activities accordingly [9]. There are also pop-
                                         ular web-based educational tools like Tuvalabs [6], CODAP [5], and
                                         DataBasic [3]. However, these methods demand several computers                              Figure 1: Web interface aims to align with the physical programming
                                         in the classroom, which is hard to attain in most underprivileged                           card design while showing a similar interaction with popular tools like
                                         communities. In our workshops, we used a new web-based educa-                               Scratch [4]. The screen has similar ordering and proportions with
                                         tional data programming tool that can support a range of unplugged                          other drag-and-drop type web-based programming tools.
                                         and mobile activities, allowing us to involve children with limited or
                                         no access to computers or tablets.
                                            In our three-week online workshop program organized in collab-                           2     W ORKSHOP G OALS             AND   F LOW
                                         oration with an NGO, we used Marti [7], a new web-based data-
                                         programming environment. Marti’s data programming environment                               We organized a three-week program during the semester break of
                                         contains (1) physical data-programming cards, (2) a companion mo-                           the students. In the design of the activity flow, we targeted three
                                         bile application, and (3) a web application with drag-and-drop visual                       primary learning outcomes: (1) Increasing students’ awareness of
                                         programming blocks. This variety offers educators several usage                             the importance of data literacy in everyday life, (2) Making them
                                         scenarios; they can use these environments individually or combine                          fluent in choosing the proper analysis and visualization operations,
                                         the activities. For example, in an unplugged scenario, students can                         (3) Showing a wide variety of data formats from diverse application
                                         discuss the programming concepts and create pseudo-pipelines using                          areas.
                                         only physical programming cards without needing a digital device.                              We used both unplugged and web-application activities. We did
                                         Supporting this kind of physical card environment enables working                           not use the mobile application’s card recognition capabilities, as
                                         with students coming from low socioeconomic backgrounds. In                                 most students’ device camera were occupied by the Zoom applica-
                                         another low-budget classroom scenario, students can use a shared                            tion. Our activities are structured around Sustainable Development
                                                                                                                                     Goals (SDG)-related concepts to apply these data interpretation
                                             * e-mail: asabuncuoglu13@ku.edu.tr                                                      skills in real-life applications. Yet, we started the first day with
                                             † e-mail: eyantac@ku.edu.tr                                                             Marti’s Football Player dataset to introduce more familiar names
                                             ‡ e-mail: mtsezgin@ku.edu.tr                                                            and concepts. Our content has board-game influences as evidence

                                                                                                                                1
© 2021 IEEE. This is the author’s version of the article. This paper has been peer-reviewed and accepted to VisActivities: 2nd IEEE VIS Workshop on Data Vis
Activities to Facilitate Learning, Reflecting, Discussing, and Designing, held in conjunction with IEEE VIS 2021, New Orleans, LA, USA. 2021 The final version of
this record is available at: https://visactivities.github.io
Figure 2: One possible workflow of completing a data programming activity using Marti. The programming environment involves programming
cards and shared tablets. The mobile interface has two main areas: Output and Camera. Students can display the given physical activity cards to
the device camera to add this programming block into their data flow. After editing the input, the corresponding change automatically occurs in the
Output area.
suggests that presenting the content in a structured and gamified 2.1 Method and Tools
environment boosts students’ motivation, comforts teachers, and ac- We conducted weekly meetings with 24 middle and high school
celerates the curriculum’s adaptation [1]. The gamification of these students from a local non-governmental organization (NGO) for
activities also supports comprehending the new information in an three weeks. Only six middle school students and eight high school
engaging environment [1]. In addition, the card-based programming students participated in all three sessions of our workshop; we used
structure allowed the easy integration of board game elements into only their data in the analysis. Each session, we devoted two hours
the activities by design. to use our programming cards, tools, and gamified curricular content.
The following five questions drive the activity flow: (1) What is A moderator and three observers were present in each session. The
data? (2) Where do we see data in real life? (3) How can we use observers took notes on two axes: Attention and understandabil-
data to solve our problems? (4) How can data visualization help to ity. Attention is described as learners’ active cognitive behavior
understand our problem better? (5) What are the common fallacies on reception and response to stimuli [8]. The observers tracked
in data interpretation? if students actively asked questions, followed the main flow, and
showed general interest. We measured understandability based on
Based on these starting questions, we narrated a gamified scenario students’ ease in using the activity content and comprehending the
about traveling around the world to solve various sustainability concepts. The independent observers were selected from senior-year
issues. We followed three types of tasks: (1) Creating pseudocodes students from a university’s education department with no relations
that involve selecting and ordering the physical programming cards with the authors.
as seen in Figure 4, (2) completing digital activities using the web Throughout the activities, we asked questions to students via Spi-
application, and (3) visualization with unplugged cards and web ral, an online formative assessment tool, to make the Q&A process
interface. In these gamified tasks, the moderator can give points more engaging. We did not conduct a traditional pre-tests and post-
based on the solution’s correctness or considering the solution’s tests. Instead, we asked repetitive and similar questions through
time. In a classroom environment, groups also can compete with Spiral in the first and the last session. This kind of assessment strat-
each other. Yet, due to the online setting’s limitations, we applied egy allowed us to use our pre and post-test questions as discussion
question-wise gamification in our workshops. For example, students starters, quickly gauge students’ knowledge levels and adapt the
were asked to create a chart with all the required elements like title content.
and axis labels in the visualization part. When students could not Both middle and high school students had previous knowledge
complete the chart with the required components, they requested of simple statistics subjects such as drawing charts, applying basic
hints. Figure 3 shows three of the component cards that can be math operations, or collecting data. These topics are 6th and 7th-
handed out when students asked for help. When they received the grade subjects in their national math curriculum. However, our
card, they lost a point but complete a missing ingredient of their Q&A results demonstrate that they did not remember most of these
chart. concepts.
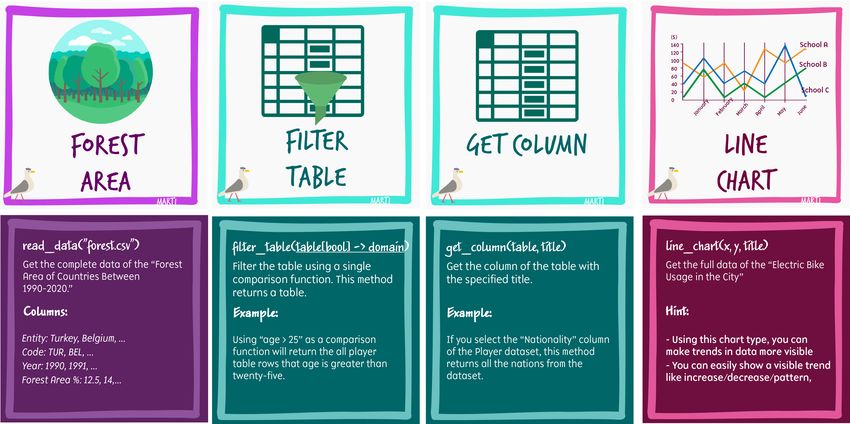
Figure 3: Each visualization card includes key helping information to
support students in the chart selection and creation steps. This figure
shows Bar Chart card and three Chart Element cards. The chart card Figure 4: Students choose these four cards to create a high-level
contains an example in the front and summarizes the key properties pipeline to generate a line chart that shows the change in forest areas
and tips. Each chart type has its element cards that summarize helpful of a country through years. Each category is colored separately to
tips to place the element on chart creation. ease the choosing process. At the back of the cards, students can
find the definition and an example usage.
2© 2021 IEEE. This is the author’s version of the article. This paper has been peer-reviewed and accepted to VisActivities: 2nd IEEE VIS Workshop on Data Vis
Activities to Facilitate Learning, Reflecting, Discussing, and Designing, held in conjunction with IEEE VIS 2021, New Orleans, LA, USA. 2021 The final version of
this record is available at: https://visactivities.github.io
2.2 Introduction (Day 1) 2.5 Data Fallacies (Day 3)
We started by defining the fundamental terms such as algorithm, We introduced data fallacies at the end of the workshop, as it has
coding, data, and dataset. We first asked the students to guess the become more and more important for everyday media users. First,
meanings of these terms via Spiral, then introduced the concepts we discussed what sounds wrong in their visualization and repre-
one by one. Then, we shared daily uses of data such as social media sentation through the analysis activities while presenting the results.
applications, auto-correct keyboards, and video suggestions. We also Next, we introduced some example cases using Marti’s data falla-
showed some data stories from pudding.cool, where journalists share cies cards. Marti introduces nine data fallacy examples and three
interesting data stories. In this part, educators can introduce different samples for each card. These fallacies are cherry-picking, survivor-
stories by considering the group dynamics. In our workshop, we ship bias, false causality, gerrymandering, sampling bias, overfitting,
shared three interesting uses of data analysis and visualization: (1) gambler’s fallacy, Hawthorne effect, and danger of summary met-
A publishing editor’s use of book cover picture data to inform the rics. However, we only introduced cherry-picking and the danger of
next cover decision, 1 (2) A social scientist’s analysis of lifestyle summary metrics, as the time is limited. Finally, we discussed if one
and political events by examining people’s hair length data. 2 (3) data fallacy occurred during our workshop or if they encountered
Web’s changing laugh styles in the last decade. 3 any examples.
We finally introduced the Football Player dataset, which we pre-
pared as a subset of EA Sports FIFA 2018 Game’s Players that 2.6 Activity Questions
includes players’ name, country, age, potential, and overall point We asked for definitions of basic terms, creating some pseudocode to
attributes. After exploring the dataset attributes, we introduced basic solve data-driven problems and draw charts. We shared all questions
operations like filtering data, selecting a column, saving a variable. for each day with the following question type abbreviations,
Then, we tested each operation one by one using the dataset and
showed how each command requires different inputs and results in • OE: Spiral - Open Ended
different outputs. • MC-N: Spiral - Multiple Choice with N options
• CNV: Spiral - Canvas
2.3 Data Collection and Datasets (Day 1 and 2)
• M: Solved in Marti, Pasted the Result to Spiral
A popular data collection activity is asking students to conduct
surveys with their friends. In the online studies, we did not conduct 2.6.1 Day 1
this activity due to logistic complexity. Yet, this kind of familiar
activities results in meaningful learning as the content is presented Day 1 questions aim to learn the demographics and can be interpreted
within a personally relevant setting [2]. We did not use Zoom polling as pre-test.
as it was time-consuming, and we did not want to spend too much 1. Which grade are you in? (MC-2)
time on complex and distractive operations. Instead, as a familiar
2. Which device do you use to connect with Zoom? (MC-3)
dataset, we introduced Football Player dataset as explained above.
On Day 2 and 3, we continued with Marti’s offered Sustainable 3. What is data? (OE)
Development Goals (SDG) activities and the simplified plastic con- 4. Draw a bar graph that shows the count of the same-age students.
sumption and forest area data. In our dataset selection, we focused (CNV)
on two key elements. First, the concept should be familiar but ex- 5. Which cards should we choose to find the players from Ar-
citing for the students. Second, the data should include different gentina? (M)
primitive types such as strings and integers to use all our data pro- 6. Which cards should we choose to find the players from Real
gramming environment’s functionality. In these terms, we selected Madrid? (M)
datasets that contain exciting facts related to science topics in their 7. How is your relationship with technology? (MC-4)
curriculum and touches on SDG-related issues. 8. How do you find the applications that we used today? (MC-4)
2.4 Data Analysis and Visualization (Day 1, 2, and 3) 2.6.2 Day 2
This set of activities starts with introducing the UN’s Sustainable These questions aim to keep the discussion active, and understand
Development Goals (SDG). Students first analyze the given data, current knowledge.
then choose the appropriate visualization method to communicate
their results. Aligned with recent literature, we focused on teaching 1. How many goals do the UN present to achieve sustainable
visualization as a rethinking of numbers and ideas to communicate development? (MC-4)
the stories [10]. Our SDG-related activities include datasets for 2. Draw the table as a pie chart. (CNV)
Forest Area, City Bikes, Research Budgets, and Plastic Production. 3. What is the comparison function to get the table that only
These datasets link science and SDG concepts that are also part of contains Brazil (M)
the middle and high school curriculum. Each dataset is determined to
4. Draw a graph that shows the change of the area from 1990 to
fulfill curricular needs in our gamified education flow. We prepared
2015 in Brazil. (CNV)
eight data analysis questions and two visualization questions aligned
with each dataset. 5. Can you do all the things that come to your mind while using
While determining the visualization questions, we focused on the application? (MC-4)
choosing the suitable visualization method that could communicate 2.6.3 Day 3
our ideas well. Marti programming environment supports a limited
set of visualization operations (table, line, bar, pie, and map charts), Day 3 questions aim to understand students’ development and can
so we were asked to visualize the results with these supported opera- be interpreted as post-test.
tions. We used Marti’s visualization operation cards (Figure 3) to
remind students of the elements of drawing a chart. 1. What is data? (OE)
2. Which cards can we use to chart the forest areas of Brazil from
1 https://pudding.cool/2019/07/book-covers/ 1990 to 2015? (M)
2 https://pudding.cool/2019/11/big-hair/ 3. Draw the change in forest area of Brazil between 1990 and
3 https://pudding.cool/2019/10/laugh/ 2015.
3© 2021 IEEE. This is the author’s version of the article. This paper has been peer-reviewed and accepted to VisActivities: 2nd IEEE VIS Workshop on Data Vis
Activities to Facilitate Learning, Reflecting, Discussing, and Designing, held in conjunction with IEEE VIS 2021, New Orleans, LA, USA. 2021 The final version of
this record is available at: https://visactivities.github.io
4. Which programming cards should we use to find FIFA 2018 • Design of the programming cards: The shape and colors of the
players over the age of 29? (M) data programming cards positively impacted students’ atten-
5. Which programming cards should we use to find FIFA 2018 tion. Using cards like pseudocode elements helped students
players over the potential of 90? (M) complete activities more effortless, which resulted in higher
participation.
6. Which programming cards should we use to find the average
age of Spanish players? (M) Losing attention/excitement: Switching between online tasks, Hav-
7. Which programming cards should we use to find the oldest ing mixed devices
player? (M)
8. Which programming cards should we use to find the least • Switching between online tasks: In the first meeting, technical
potential? (M) difficulties like opening the Zoom meeting, visiting links from
Zoom chat, switching tabs between Zoom, Spiral, and web
2.7 Limitations applications were challenging. Nevertheless, students become
more fluent in switching between tasks after the first meeting.
The programming cards and activity flow was initially intended to be
used in the physical classroom experience. However, we observed • Selecting files on mobile: In the first week, middle school
that using the card metaphor and creating pseudo-codes with digital phone users had a hard time downloading and using the dataset.
cards also engaged the students in online studies. Then, we started using ”Open CSV with a web link” program-
In an online collaborative activity, student-educator and student- ming card and included our all datasets as online resources.
learning content engagement are challenging to achieve and maintain.
Therefore, during the studies, we kept the pace slow. In this case, Making concepts tangible/easier to understand: Giving examples
some students got bored, and some others struggled with technical from real-life, Asking basic what and how questions, Step by step
difficulties or lack of experience. Further, we did not force them execution
to open their microphones or camera, so our observations are only
limited to their reactions when their camera and microphone was • Giving examples from real-life: Defining algorithmic steps
open. with an analogy of making a sandwich process and sharing
real-life data stories from the pudding website helped students
making concepts more tangible. In addition, hearing familiar
3 A NALYSIS AND D ISCUSSION
football player names increased the attention of students in
In the analysis step, we categorized the observer notes based on first day. All observers mentioned that integrating stories from
attention and understandability axis. Each observer assigned an at- this website raised attention significantly.
tention and understandability score (1-10) in the end of each session • Asking basic what and how questions: Boosting the discus-
and take regular notes at every five minutes. Overall, the attention sion via Spiral and gradually increasing the question difficulty
score has µ = 8.4 and σ = 1.7 and understandability score has µ = helped students understand each step and raised their attention.
8.3 and σ = 1.3. Although this scores are promising and motivates
us to conduct our research in our current direction, the number of • Step by step execution: Another advantage of using pseu-
students and observers limits interpreting the quantitative results. docode data cards was teaching one concept at a time.
3.1 Observer Notes Making concepts more confusing: Shallow explanation of details,
Switching tasks ‘too fast’
Observers asserted that using our activity flow increased students’
motivation and helped them grasp data literacy. Giving unique and • Shallow explanation of details: Even if one step of the algo-
fun examples, summarizing the content, building communication rithm is explained shallowly, it could confuse students. For
with each student, gradually increasing the difficulty by integrating example, one of the activities involved the filter value update
card-based pseudocode creation are all listed as best practices. We in getting a completely different subset.
summarized the observer notes in four categories: Growing attention,
losing attention, making concepts tangible, and making concepts • Switching tasks ‘too fast’: Our aim was to growing some
confusing. attention by just changing one value to obtain a different subset.
However, students were confused. A collaborative/interactive
Growing attention/excitement: Using real-life examples, ’cool’ new
Q&A can help to explain these details. In particular, switching
concepts, switching between cards and digital activities, design of
tasks in an online setting ‘too fast’, such as changing windows
programming cards
or tasks, can confuse students.
• Using ’cool’ real-life examples: Describing the working prin- 3.2 Spiral Questions Analysis
ciples behind familiar real-life data-driven mechanisms, such
as explaining how YouTube works or how a real-life robot We asked basic definitions, card-ordering tasks, and drawing charts
can find its way raised students’ attention. The shared data in Spiral activities. In the first workshop, we asked two card-ordering
stories were ’cool’ and ’familiar.’ These ’cool’ concepts grew questions and two statistics questions. However, none of the mid-
their attention in transition to SDG-related concepts. The SDG- dle school students could answer the basic definition and statistics
related activities were such as rainforest area declination and questions, such as averaging a part of the data in the first session.
matched their interest as it was a common issue for everyone. Although it was students’ first time learning about these cards, they
could predict the correct cards on Day 1. For example, half of the
• Switching between cards and digital activities: Using different middle school students predicted the correct cards to solve question
yet familiar learning modalities (i.e., cards, canvas, quizzes) 5 of Day 1. High school students are more experienced in data-
helped them stay focused on the tasks. Students used cards related operations, they adapted the system quickly, and 5/8 students
and a web interface together, which helped them to stay more could answer this question. We can interpret this observation as the
focused during the activities. We included gamification with success of card-based methodology in teaching. On Day 3, more
small challenges, such as predicting the hue value of the given than half (3-5/6) of middle school students answered questions 4,5,
color. and 6 correctly, which shows a visible improvement over the pre-test
4© 2021 IEEE. This is the author’s version of the article. This paper has been peer-reviewed and accepted to VisActivities: 2nd IEEE VIS Workshop on Data Vis
Activities to Facilitate Learning, Reflecting, Discussing, and Designing, held in conjunction with IEEE VIS 2021, New Orleans, LA, USA. 2021 The final version of
this record is available at: https://visactivities.github.io
Figure 5: Student’s chart drawings in the first and last meeting. We shared the answers that is drawn on Spiral’s online canvas. Other students
showed their answers through camera.
scores. High school students did not show a significant improvement, it in the following workshops. Both middle and high school
but our observer notes revealed that they had become more confident students quickly learned to utilize our datasets, programming
throughout the process. cards, and interface elements. The observer notes show that the
We also asked students to draw a chart at the beginning and understandability increases by integrating real-life data stories
end of the studies. We observed that the chart programming block and supporting gradual difficulty increase. Interdisciplinary
helped them remember the fundamental steps (e.g., adding a title, content in current curricula includes complex elements that
giving label names to x and y axes) to draw a chart. Figure 5 require learning technical details to analyze the data, weak-
shows the middle and high school students’ answers in the first ening teachers’ confidence. Our environment promoted data
and second meeting to a chart drawing question. Drawing a chart programming in an easy-to-grasp fashion.
in an algorithmic style pushed them to repeat the same structure • Pedagogical appropriateness: Students could quickly under-
repeatedly, which naturally aligns with spaced repetition learning stand the cards’ functions and the system’s capabilities in the
technique. workshops, demonstrating that the application design is appro-
4 F INDINGS AND D ISCUSSION priate for middle and high school groups. The design elements
of cards such as colors, icons, and abstraction level of input
We grouped our findings under five categories based on program- fields helped students remember the card’s function. In addi-
ming environment functionalities, group dynamics, and pedagogical tion, the abstractions of the high-level data operations were
appropriateness. appropriate as they were semantically similar to current popu-
lar data science languages and easy to understand at the same
• Cards modularity: Our observations revealed that executing time.
the code command by command benefits both teachers and
students. Students can quickly experiment with programming • Improving gamification: Current data programming cards and
operations and understand the impact of each function in the companion activity cards support the gamification to some
digital pipeline before compiling the code. Educators can extent. We released all the activity cards on Github and would
structure the activities and create a modular flow as each card like to see different uses of these cards.
is designed similarly.
5 C ONCLUSION
• Switching tasks and multimodality: Using the cards in both In this paper, we presented our workshops with 12 middle school
physical and digital forms helped students to follow the dis- and 12 high school students, focusing on the data fundamentals,
cussed subjects. In our studies, all students answered the analysis, and visualization. We used Marti and its offered unplugged
questions and participated in the discussion that involved pro- activities. Throughout the workshops, our observations revealed that
gramming cards. Students quickly adopted using the cards to integrating unplugged-style pseudo-code creation and supporting
represent the solution abstractly. The simple use of the cards a similar experience using the available devices have considerable
enabled students to focus on the solution rather than techni- potential for delivering equal and affordable data programming ed-
cal details. Thinking about the main steps in the first place ucation for all. Although we could not use all interface elements
initiated a fruitful discussion where we discussed each step in due to limitations of the online setting, we demonstrate that using
detail. We continue our research using card methodology by a card-based programming system engages students in the activity
including this interaction in a board game or book structure. by naturally supporting step-by-step execution. We believe that our
• Choosing the right dataset: The students quickly understood online resources will accelerate the integration of card-based tools
the flow of our programming environment and could easily use in both classroom and hybrid activities.
5© 2021 IEEE. This is the author’s version of the article. This paper has been peer-reviewed and accepted to VisActivities: 2nd IEEE VIS Workshop on Data Vis
Activities to Facilitate Learning, Reflecting, Discussing, and Designing, held in conjunction with IEEE VIS 2021, New Orleans, LA, USA. 2021 The final version of
this record is available at: https://visactivities.github.io
ACKNOWLEDGMENTS
The authors gratefully acknowledge that this work was supported by
TUBITAK [Grant Number 218K436] and Koç University-İs Bank
AI Center. We would also like to thank all the educators, volunteers
and students from TOÇEV.
R EFERENCES
[1] C. S. Barber. When Students are Players: Toward a Theory of Student-
Centric Edu-Gamification Systems. Journal of Information Systems
Education, 32(1):53–64, 2021.
[2] S. Chu, B. Garcia, E. Deuermeyer, S. Deady, and F. Quek. An investi-
gation of relevance from curriculum-aligned making in the elementary
school science classroom. pp. 1–9, 2019. cited By 0. doi: 10.1145/
3311890.3311891
[3] C. D’Ignazio and R. Bhargava. Databasic: Design principles, tools
and activities for data literacy learners. The Journal of Community
Informatics, 12(3), 2016.
[4] J. Maloney, M. Resnick, N. Rusk, B. Silverman, and E. Eastmond. The
scratch programming language and environment. ACM Transactions on
Computing Education, 10:1–15, 2010. doi: 10.1145/1868358.1868363
[5] G. F. Mojica, C. N. Azmy, and H. S. Lee. Exploring data with codap.
The Mathematics Teacher, 112(6):473–476, 2019.
[6] L. Reiten and S. Strachota. Promoting statistical literacy through tuva.
The Mathematics Teacher, 110(3):228–231, 2016.
[7] A. Sabuncuoğlu and T. M. Sezgin. Marti: A hybrid data programming
platform with card, mobile and web interfaces for k-12 education.
Kart-ON Project, 8 2021. https://karton.pubpub.org/pub/marti.
[8] E. E. . Smith and S. M. . Kosslyn. Cognitive psychology : mind and
brain. Pearson/Prentice Hall/Pearson Education International, Upper
Saddle River, N.J., 2009.
[9] B. Tim. Computer science in k-12 education: The big picture. 2018.
[10] J. Wolfe. Teaching students to focus on the data in data visualization.
Journal of Business and Technical Communication, 29(3):344–359,
2015. doi: 10.1177/1050651915573944
[11] A. Wolff, D. Gooch, J. J. C. Montaner, U. Rashid, and G. Kortuem.
Creating an understanding of data literacy for a data-driven society.
The Journal of Community Informatics, 12(3), 2016.
6You can also read