Your Go-to Guide to Launching Branded & Embedded Analytics - TECHNICAL GUIDE
←
→
Page content transcription
If your browser does not render page correctly, please read the page content below
TECHNICAL GUIDE

        Your Go-to Guide to Launching
        Branded & Embedded Analytics

GoodData Confidential. 2021 GoodData Corporation. All rights reserved                     1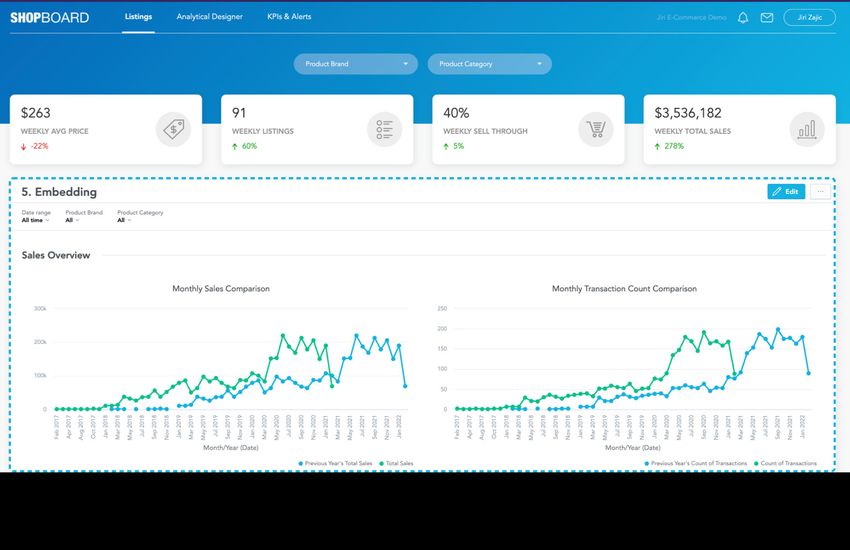
This technical guide is here to help management,
                                                                          product, solution, and data teams navigate
                                                                          the complexities of choosing an embedded
                                                                          analytics platform that will best suit their needs.

                                                                  New to embedded analytics?
                                                                  Start here.

                                                                          1. What is “embedded analytics?”
                                                                             Embedded analytics represents a stage of analytics
                                                                             where the whole analytics platform and data
                                                                             pipeline, or its parts - be it just one graph, one
                                                                             dashboard or thousands of them - are integrated
                                                                             into another software (or an application, if you
                                                                             prefer this term). The software itself might be a
                                                                             company’s internal web portal (typically, enterprise),
                                                                             or the marketed product offering of a software
                                                                             company. Or any other.

                                                                             The main point is that the user will see an analytics
                                                                             platform as an inherent part of the application into
                                                                             which it is embedded, and not like two separated,
                                                                             unfitting tools coming from two different universes.

                      Two software platforms become one via three levels:
                      embedding, customizing, branding.

                                                                          2. Why bother to read this tech guide
                                                                             The field of business intelligence and embedded
                                                                             analytics is an intricate one to navigate, with a
                                                                             multitude of options and non-standardized
                                                                             terminology used across different providers.

                                                                             However, the decision of which data analytics
                                                                             solution to acquire is one of strategic and financial
                                                                             importance, with a direct impact on your business
                                                                             performance as well as on your customer, or
                                                                             employee, happiness.

© GoodData
  2021 GoodData Corporation
           Confidential. 2020 GoodData Corporation. All rights reserved                                                          2
The decision of which data analytics solution to acquire
                                                                 is one of strategic and financial importance, with a
                                                                 direct impact on your business performance, as well
                                                                 as on your customer, or employee, happiness.

                                                                             If a miscalculated choice is made, one that may
                                                                             make sense in the short term but fails to take into
                                                                             account long-term organizational or market change,
                                                                             having to move everything to another analytics
                                                                             platform in the not-too-distant future is sure to result
                                                                             in headaches and huge time/monetary costs for
                                                                             your teams.

                                                                             With that in mind, we bring our knowledge and
                                                                             experience, acquired across multiple industries as
                                                                             well as complex and diverse use cases, to help you
                                                                             navigate this field and make the best possible
                                                                             decisions for your business.

                                                                  Looking for a particular topic?

                                                                          Check the list of the areas covered in this tech guide
                                                                          and jump straight to the right chapter.

                                                                          A. Starting off:
                                                                             the two essential parts of embedded
                                                                             analytics
                                                                             •   Self-service: prevent change-request overload
                                                                             •   Embed, brand and customize, flexibly
                                                                                 and seamlessly

                                                                          B. When things get really complex:
                                                                             managing the embedded analytics
                                                                             solution

© GoodData
  2021 GoodData Corporation
           Confidential. 2020 GoodData Corporation. All rights reserved                                                            3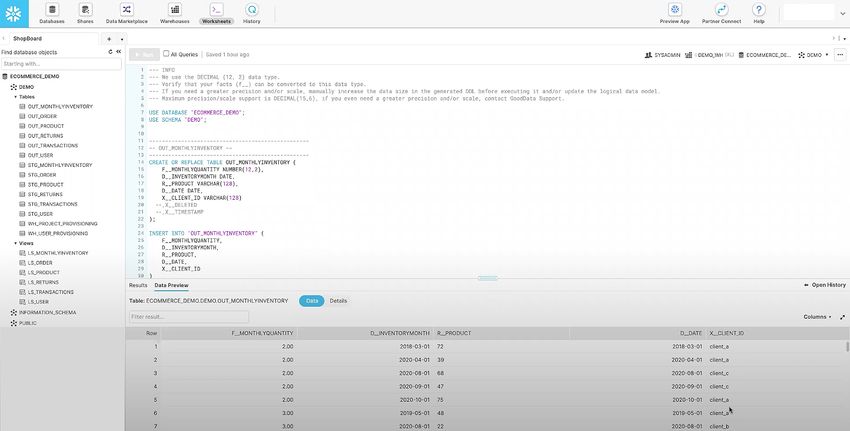
•   Scaling analytics and data: the most common
                                                                                 yet hidden bottleneck
                                                                             •   Change management: the underlying layer
                                                                                 of data operations efficiency
                                                                             •   Data integration: quickly and reliably
                                                                             •   Data security: don’t struggle with security
                                                                                 and privacy
                                                                             •   Monitoring: analytics over analytics

                                                                          C. The extras:
                                                                             •   Developing data products
                                                                             •   Monetizing your application and data

                                                                          D. The last, or the first?
                                                                             •   Pricing: look for a predictable and
                                                                                 sustainable formula

                                                                          E. Who is GoodData?

                                                                          Or take it from the start.

© GoodData
© 2021 GoodData
  2021 GoodData Corporation
                Corporation
           Confidential. 2020 GoodData Corporation. All rights reserved                                                        4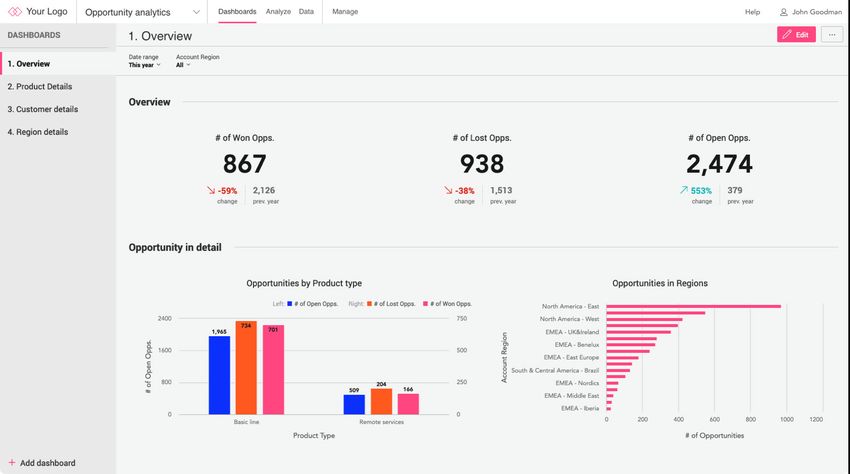
A.
                                                                          Starting Off:
                                                                          the two essential parts of
                                                                          embedded analytics

                                                                          Self-service: prevent change-request
                                                                          overload
                                                                          No matter who your end users will be (client companies,
                                                                          internal teams, suppliers, branches, public users, etc.)
                                                                          we need to start this guide with data visualization,
                                                                          charts and dashboards (even before embedding)
                                                                          because that is the final outcome of all analytics
                                                                          actions and the underlying intention that has brought
                                                                          you here. The final picture in everyone’s minds.

                                                                          Here we must to start with the following reality:
                                                                          the number of business (and other non-technical)
                                                                          users far outweigh the number of analytics and
                                                                          data specialists. And it is the former for which your
                                                                          analytics solution must work no matter their technical
                                                                          know-how (or lack thereof), while your technical and
                                                                          solution teams are in charge of the data management’s
                                                                          integrity,   veracity    and     real-time  ingestion.

                                                                 Here we need to start with this reality: there are more
                                                                 business and other non-technical users than data and
                                                                 analytics specialists.

                                                                          Without the right tools, the wide variety of end users,
                                                                          their numbers, and their individual requests, can
                                                                          easily lead to a backlog of change requests, likely
                                                                          resulting in diminished profits and the burden of huge
                                                                          workloads for your technical team to tackle. Why?

                                                                          Because each end user naturally comes up with their
                                                                          own set of requirements and ideas of, for example,
                                                                          how they need to change the preset visualization,
                                                                          what subsequent visualizations they need to create,
                                                                          or which additional data they need to include.
© GoodData
  2021 GoodData Corporation
           Confidential. 2020 GoodData Corporation. All rights reserved                                                          5
So, with the above in mind, the embedded
                                                                             analytics platform should provide self-service
                                                                             capabilities allowing your end users to carry out
                                                                             the following tasks themselves without requiring
                                                                             support from data analysts and engineers.

                                                                             •    Use an easy drag-&-drop analytics interface.
                                                                             •    Easily create and save new visualizations
                                                                                  from scratch.
                                                                             •    Use predefined visualizations as a kick-start and
                                                                                  change them further (filtering, visualization type,
                                                                                  changing metrics in the visualization).
                                                                             •    Create new metrics from predefined metrics.
                                                                             •    Upload additional datasource via a CSV file.
                                                                             •    Share a visualization with their teams right away
                                                                                  via email or downloaded file.

                                                        Preset visualizations that might be adjusted by end users further

                                                                             The analytics platform should ideally contain a certain
                                                                             level of intelligent tooling within the analytics interface
                                                                             in order to guide end users throughout the analysis.

© GoodData
  2021 GoodData Corporation
           Confidential. 2020 GoodData Corporation. All rights reserved                                                                 6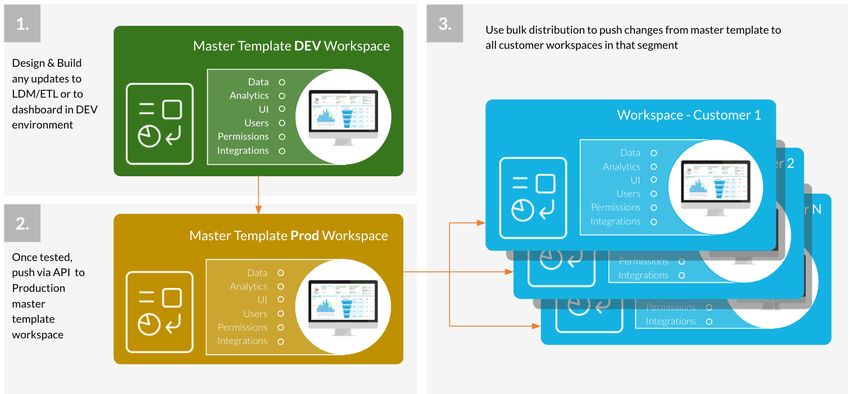
The tools should have the ability to suggest
                                                                          recommended visualizations to be created as well
                                                                          as showing only the relevant metrics according to
                                                                          the data pipeline, therefore making it impossible to
                                                                          create a meaningless visualization by mistake. This,
                                                                          in particular, helps less data-literate end users build
                                                                          reports on combinations of metrics that make sense.

                     These customizations made by your end users in self-service
                     mode, or data pipeline adjustments made by your technical
                     team, shouldn’t present an integrity risk, as a well-designed
                     embedded analytics platform will detect all customizations
                     when releasing a new version of your dashboards, metrics,
                     data sources, data pipeline, analytics interface or any other
                     part (more on this later).

                                                                          Embed, brand, and customize, flexibly
                                                                          and seamlessly
                                                                          Embedding and interface customizations go hand in
                                                                          hand. The essential questions you might start with are:

                                                                          •   Do we need integrated login (so called SSO) to our
                                                                              business application (or web portal) and analytics,
                                                                              or is separate login to analytics sufficient?
                                                                          •   How should the analytics interface fit to our brand?
                                                                              What styles, fonts or colors will we need?
                                                                          •   Do we need to control interactions between our
                                                                              business application (or web portal) and analytics
                                                                              platform, such as controlling filters or drilling within
                                                                              the application (or web portal) menu?

                                                                          There are three ways of handling and delivering
                                                                          the embedding and interface customizations.

                                                                          1. Direct embedding - no code - iFrame
                                                                              Embedding via iFrame is the right choice if you wish
                                                                              to enrich your existing application or web portal
                                                                              with “analytical” sections or tabs in the menu. You
                                                                              can embed any part of the analytics platform:
                                                                              customized, preset visualizations; dashboards; or
                                                                              even a self-service analytics interface for non-
                                                                              technical users (typically, business managers).
© GoodData
  2021 GoodData Corporation
           Confidential. 2020 GoodData Corporation. All rights reserved                                                             7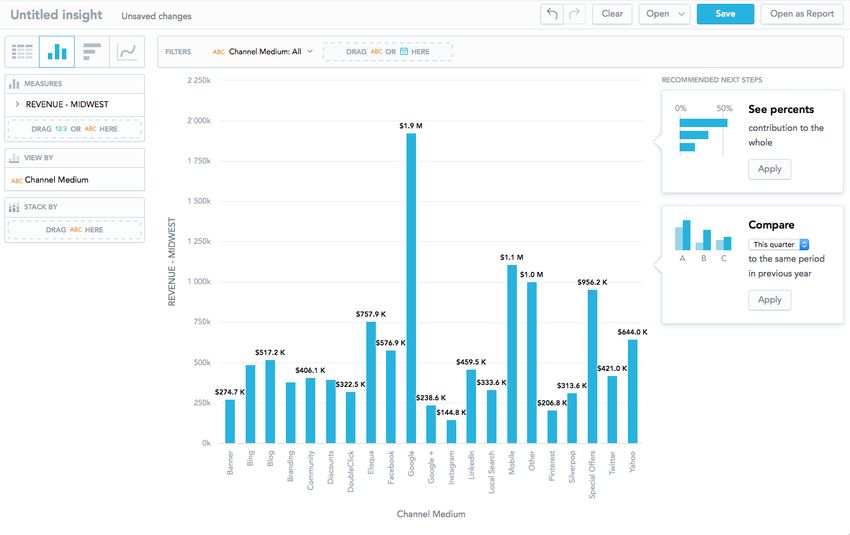
The look and feel of the analytics tabs, dashboards,
                                                                               and visualizations can be adjusted and fitted to
                                                                               those of your application, web portal, or company’s
                                                                               branding. On top of that, you can unify login with
                                                                               incorporation of the single sign-on feature (SSO).
                                                                               That way your end users access your application (or
                                                                               web portal) and embedded analytics by using a
                                                                               single username and password.

                                                                          Embedding with iFrame

                                                                           2. Embedding for developers - custom code
                                                                               Embedding by using the platform’s pre-built
                                                                               development tooling serves to integrate the whole
                                                                               analytics platform with your application or web
                                                                               portal on a deeper level. It also gives the ability to
                                                                               easily design custom visualizations types that aren’t
                                                                               available in the analytics interface right away.

                                                                               With a pre-built Javascript library, SDKs, and REST
                                                                               API you can connect directly to the analytics platform
                                                                               and quickly design interactive analytics applications
                                                                               that are tailored to the specific use case of your
                                                                               software product, or web portal. To the extent that
                                                                               your analytics design does not look like traditional
                                                                               analytics at all!
© GoodData
  2021 GoodData Corporation
           Confidential. 2020 GoodData Corporation. All rights reserved                                                            8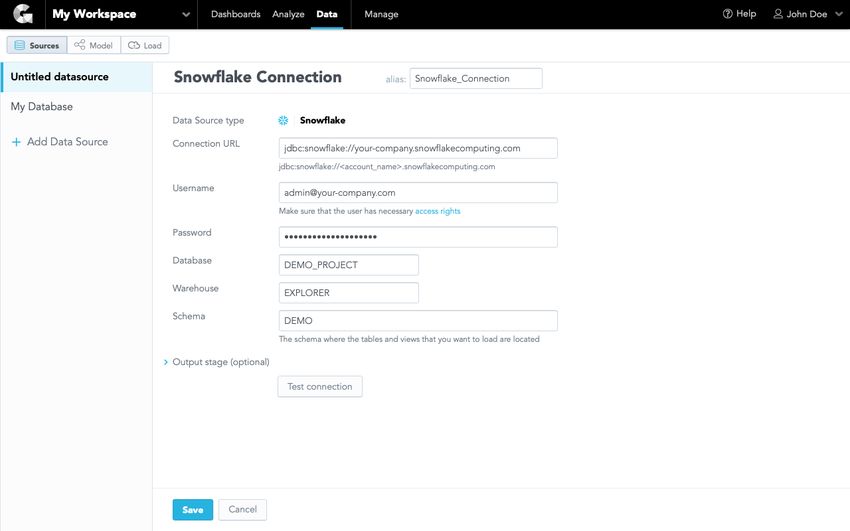
Embedding for developers

                                                                          3. Branding without embedding - whitelabel
                                                                             The third option takes embedding out of the
                                                                             equation, instead allowing “only” the customization
                                                                             and fitting of the look and feel of the analytics
                                                                             interface and dashboards to your company’s
                                                                             branding. Your end users will have a separate login
                                                                             to the analytics platform that won’t be connected
                                                                             with your business application, or web portal, on
                                                                             any level.

                                                                                       Branding without embedding

© GoodData
  2021 GoodData Corporation
           Confidential. 2020 GoodData Corporation. All rights reserved                                                       9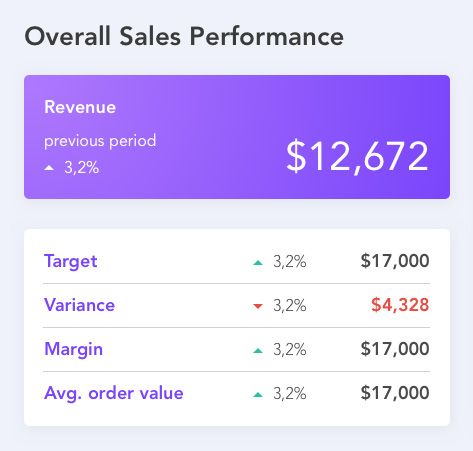
The indispensable features of embedded analytics
                     No matter which method you settle on, when the time comes to roll out
                     your first version of embedded analytics into your business application or
                     web portal, the embedded analytics platform should be equipped with
                     the following two capabilities, in order to satisfy any of your future needs.

                     Single-sign-on (SSO) - ensuring that the analytics running within your
                     business application or web portal, but operated by the 3rd party platform,
                     doesn’t require any other login. The analytical platform ensures automated
                     user-and-access-rights provisioning so that all users are connected properly.
                     The most commonly used types of SSO that an embedded analytics
                     platform should support are SAML 2.0-based authentication: Fluig, Okta,
                     Auth0, Salesforce, AD FS. Optionally, the platform might support a PGP-
                     based authentication mechanism based on PGP keys.

                     Flexible UI embedding - with rich styling and language localization
                     options that allow customization of interaction, styling, and overall look
                     and feel, meeting the UX guidelines of your application perfectly. With
                     the ideal embedded analytics platform, your end users won’t be able to
                     recognize that you are embedding analytics from a 3rd party provider.

© GoodData
  2021 GoodData Corporation
           Confidential. 2020 GoodData Corporation. All rights reserved                              10
B.
When things get really complex:
managing the embedded
analytics solution
Scaling analytics and data: the most
common yet hidden bottleneck
While you are running an embedded analytics solution just
for a few teams or end users, analytics scaling and change
management are no big issue.
Any technical issues or discrepancies triggered by
scaling to a few more end users or releasing new
versions of data sources or metrics are detected
and resolved quickly, as the extent is rather
low. It works smoothly and everyone is happy.
Everything changes dramatically, however, once
you start scaling your analytics solution to hundreds
or thousands of end users and separated user
groups, or when you start designing analytics
for multiple use cases. That is when the formula
becomes more complex and the phenomenon
of errors, inefficiencies, and unsustainable costs
comes into the picture, often resulting in the
fragmentation of analytics across the organization.
Everything changes dramatically once you start scaling
your analytics solution to hundreds or thousands of
users and separated user groups, or when you start
designing analytics for multiple use cases.
© GoodData
2021 GoodData Corporation
Confidential. 2020 GoodData Corporation. All rights reserved 11What tends to happen (in companies across multiple
industries) is that the analytics platform’s infrastructure
is sufficient for the first couple of years, but then it
becomes clear that your current analytics is not scaling
and changing with your needs. The increasingly long
query times, an inability to look at your data in real-
time, and the growing number of end users, or even
separated use cases or user groups, makes integrated
data and analytics management increasingly
difficult, to a certain extent, even impossible.
Simply because the analytics platform isn’t able to scale
and work throughout an organization as an integrated and
automated internal service.
Migrating to a better-fitting analytics solution sounds
just as painful as trying to constantly assemble makeshift
improvements with the current analytics platform,
but any solution manager knows that makeshift
IT solutions are not sustainable, usually triggering
unforeseen errors and deeply rooted problems.
© GoodData
2021 GoodData Corporation
Confidential. 2020 GoodData Corporation. All rights reserved 12The formula of scalability and performance
Many analytics vendors make analytics quicker, easier, more attractive and
more accessible on an individual level.
Few vendors think, on top of the parameters mentioned, about analytics
and data availability from the perspective of scaling and the perspective of
the management of thousands of users, use cases, and user groups from
one central place.
The right formula goes as follows: an analytics platform that scales
effectively can scale in 3 dimensions: data volume, price, and number of
analytics users and user groups, without sacrificing performance.
An analytics platform that scales effectively can scale in 3 dimensions: data
volume, price, and number of analytics users and separated user groups,
without sacrificing performance.
If you plan to acquire an embedded analytics solution for your organization
– a solution that not only delivers self-service data-visualization capabilities
and customized embedding, but also one designed to be performant,
achieving, and sustainable in terms of scaling, central management, and
cost – it all rests on the factor of multi-tenant embedded analytics.
© GoodData
2021 GoodData Corporation
Confidential. 2020 GoodData Corporation. All rights reserved 13Multi-tenant analytics = large-scale analytics
Multi-tenant analytics is about delivering
analytics to multiple user groups (tenants). Most
commonly, tenants are other companies that are
in some way related to your business. But not only.
Tenants can be broken down into three groups:
1) your customers/client companies (sometimes called “customer-facing
analytics’’),
2) your business partners: suppliers, distributors, resellers, franchises, etc.
3) on top of these, multi-tenant analytics is a perfect solution in case
you would like to deploy in your organization a single, cost-and-
maintenance efficient, central analytics solution to cater to your
multiple teams with various use cases, or teams that are scattered
across different locations.
Let’s explain it further
Multi-tenant analytics is about deploying to multiple
user groups that might have a shared data model,
shared metrics and reports definitions, but user-group-
specific data that is accessible only by the respective
user group. In comparison to traditional solutions, you
don’t have to build the whole environment (metrics,
reports, dashboards) for every single user-group.
The options for building multi-tenant analytics
Here are the key considerations for evaluation
of different multi-tenant analytics architecture
options described further below. You should
weigh them up based on the architecture of
your application and your end user’s needs:
• Data and metadata privacy: privacy of each
tenant’s data and metadata (dashboards,
reports, data models, metrics, etc.) must be
strongly enforced.
© GoodData
2021 GoodData Corporation
Confidential. 2020 GoodData Corporation. All rights reserved 14• Multi-domain analytics: the ability to cross-
analyze data from other business domains (e.g.
sales, marketing, product, shipments, support).
• Performance and scalability: sub-second report-
computation latencies and the ability to scale
from single-digit tenants to tens of thousands.
• Realtime latencies: analytics uses fresh data with
minimum delays.
• Time to market: solution-implementation
complexity and cost. Change management
velocity (implementation of new versions, metrics
definition updates and bugfixes).
• Operational complexity & cost: solution-
operation complexity and cost. Provisioning new
tenants, users, ACLs, permissions, etc. Releasing a
new version and rolling it out to all tenants.
Option 1: Reporting on top of operational data
This option utilizes the existing operational database
that is used for CRUD (Create-Read-Update-Delete)
operations on top of the operational data. This
approach is good as long as there are few visualizations
(low number of executions) and no, or very little, data
aggregation. If you need to just serve plain lists of
data or a few, simple operational visualizations, this is
the easiest option, which provides the best real-time
reporting capabilities.
However, when your analytical throughput grows
(more data, users, or visualization-execution numbers)
or becomes unpredictable because of self-service
analytics, you’ll need to separate the analytical queries
from the operational transactions for performance
and scalability. The separation is more important in
architectures where the operational database is shared
across multiple (or all) tenants of your application.
You might want to invest in a better architecture right
from the beginning to avoid spending your efforts
on a temporary solution. Trying to survive with this
architecture for too long usually leads to significant
overspending on the database layer.
© GoodData
2021 GoodData Corporation
Confidential. 2020 GoodData Corporation. All rights reserved 15This architecture also fails to scale in terms of additional
data sources. Analytical use cases usually involve
data from more domains (e.g. marketing, product,
sales data, etc.). Pushing all this additional data to
the operational database is another data processing
workload for it to handle.
Trying to survive with this architecture for too long
usually leads to significant overspending on the
database layer. This architecture also doesn’t scale in
terms of additional data sources.
Option 2: Per-tenant silos
The per-tenant siloed architecture is probably the
first that comes to mind when you are tasked with
extending a single-tenant (internal) analytics solution
to a multi-tenant one. You simply take a single-tenant
analytics solution and deploy it for every tenant. This
option is ideal when your application already utilizes a
similar siloed architecture.
The siloed approach is great for data and metadata
privacy as each of your tenants uses its dedicated
infrastructure. Similarly, you can scale individual
tenants based on their size and needs.
Achieving close-to-real-time data reports is hard
especially when your users need additional datasets
that must be distributed to each silo. This applies to
additional data (from different domains) as well as
to benchmarks.
Operation and management of the siloed multi-
tenant analytics is very hard and costly as you have to
deploy, configure, upgrade, and manage all tenants
individually. The distributed data management
with many databases is also difficult because of
the data distribution and the fact that you need
to apply configurations and upgrades to each
tenant individually.
You also might need to invest in advanced virtualization
to allocate hardware resources because you don’t
want to dedicate the hardware to every tenant.
© GoodData
2021 GoodData Corporation
Confidential. 2020 GoodData Corporation. All rights reserved 16Operation and management of the siloed multi-
tenant analytics is very hard and costly as you have
to deploy, configure, upgrade, and manage all tenants
individually. Achieving close-to-real-time data reports
is hard especially when your users need additional
datasets that must be distributed to each silo.
Option 3: Shared analytical database
The shared-analytical-database architecture relies on
the power of a central analytical engine that stores all
data for all tenants and serves all queries. Metadata
is also stored in a centralized, shared metadata store.
The data and metadata access privacy is enforced at
the application level using some configuration (e.g.
ACLs, forced database filters, etc.).
Data and metadata privacy require special attention in
this architecture as all tenants access the centralized
data and metadata. In most cases the access to data
and metadata is enforced using some mandatory SQL
WHERE filters appended to each query. Automation of
all operation and configuration procedures is strongly
recommended to prevent human errors that might
result in a data breach.
The central analytical database can quickly become a
bottleneck as it is used for both data transformation
and low-latency analytics queries.
Despite many vendors’ claims, there is an inevitable
tradeoff to be made between query latency,
concurrency, and data freshness. The key implication
for you is that this architecture will soon require the
central database sharding to avoid huge investments
in hardware.
© GoodData
2021 GoodData Corporation
Confidential. 2020 GoodData Corporation. All rights reserved 17Despite many vendor’s claims, there is an inevitable
tradeoff between query latency, concurrency and data
freshness to be made. The key implication for you is that
this architecture will soon require the central database
sharding to avoid huge investments in hardware.
Option 4: Data warehouse & workspaces
Cost and data privacy are the reasons for extending
the previous, shared analytical database architecture
with workspaces (aka namespaces). The extended
architecture contains these two fundamental
components:
• Data warehouse (or data lake) that
aggregates data for all tenants for shared data
transformations and management (e.g. machine
learning, benchmark computation, shared
datasets, etc.) purposes. Unlike in the previous
architecture option, the low-latency analytical
queries execute at the workspace level. So
the data warehouse can be optimized for data
transformation (ETL/ELT). This allows the use
of more cost-efficient components like Apache
Spark, AWS Athena, or cloud storages like AWS
S3 or Azure Blob Storage, instead of the more
costly Snowflakes or Redshifts.
• Workspace (aka namespace) contains private
data and metadata for each tenant. There
are important considerations regarding the
workspace query implementation (e.g. in-memory
cube, database instance, federated query with a
caching layer, etc.).
This architecture is less brittle from a data privacy
perspective than the previous one as the workspaces
automate the private data distribution from the data
warehouse. The workspace also isolates the tenant-
private metadata (e.g. custom reports or dashboards).
© GoodData
2021 GoodData Corporation
Confidential. 2020 GoodData Corporation. All rights reserved 18The distributed nature of workspaces provides more
flexibility for scaling. The fact that data volume
is partitioned by tenant, enables usage of more
cost-efficient or faster technology (e.g. in-memory or
open-source databases). Also, the workspace isolates
other tenants from query workload from large tenants
(a large number of users or large data volume).
As stated above, this architecture requires heavy automation during data
distribution (from the data warehouse to workspaces) and metadata
distribution (releases). The automation requires additional investments, so
you need to think thoroughly about whether to build or buy.
As stated above, this architecture requires heavy
automation during data distribution (from the data
warehouse to workspaces) and metadata distribution
(releases). The automation requires additional
investments, so you need to think thoroughly about
whether to build or buy.
Shaping the future of your organization;
implementing multi-tenant analytics to make data work as an
internal service
Multi-tenant analytics is hard and costly to implement and operate. You
should plan your implementation at least 18 months ahead.
Try to assess the future state of your analytical solution and design its
architecture based on these requirements. Spend more effort planning
your engineering and operation budget to decide whether you want to
build the solution in-house or adopt an existing analytics platform.
If you don’t want to design and engineer your own
multi-tenant analytics architecture, you can buy an embedded analytics
solution with multi-tenant architecture already built in. There are a
couple of them available on the market already.
© GoodData
2021 GoodData Corporation
Confidential. 2020 GoodData Corporation. All rights reserved 19Change management: the underlying
layer of data operations efficiency
Change management is a crucial part of scaling analytics.
Once you have rolled out your analytics solution to
hundreds of user groups with thousands of users, the
question is; how will you manage the many ad-hoc, and
ongoing, changes and needs that will naturally occur?
To make your end users and senior management
happy you will need to ensure that all the changes:
• are delivered quickly.
• trigger zero to minimum errors when end users
have created their own dashboards in self-service
mode.
• do not impact the veracity of the insights and
visualizations created from your data
• are cost-efficient and cost-sustainable.
If you scale to hundreds of users and user groups without
having change-management tooling built to sustain and
manage this level of scaling efficiently, you will run into
difficulties almost immediately.
Managing the deployment of new versions
Once a company implements an analytical solution,
they will need to continuously address several
ongoing tasks. These responsibilities include; change
management and the management of updates across
many different versions and user groups, handling
customizations, and onboarding new users while
ensuring that they have the correct authorizations.
© GoodData
2021 GoodData Corporation
Confidential. 2020 GoodData Corporation. All rights reserved 20Let’s take a look at a common flow of analytics release cycles:
You roll out an initial analytical experience (preset dashboards, preset metrics,
EASY
the analytics interface’s look and feel, data pipeline, data integration) to new user
groups (e.g. client companies, business partners, internal teams and use cases)
Your end users within user groups create their own visualizations and metrics with
EASY
self-service tools
DIFFICULT
You release a new version of analytics (changes in the dashboards, interface, data
pipelines, data sources, and so on) without breaking self-made customizations of
your end users
DIFFICULT
And most importantly, you need to do this for each and every one of your hundreds
VERY
of user groups with thousands of users
While creating the first versions of an analytics
experience is straightforward, the harder challenge is to
roll out a separate version to each of your user groups
at regular or irregular intervals - without overwriting
changes end users made within self-service mode.
This is necessary in order to seamlessly maintain
and control the whole large-scale solution.
While creating the first versions of an analytics
experience is straightforward, the harder challenge is
to roll out a separate version to each of your user groups
at regular or irregular intervals - without overwriting
changes end users made within self-service mode.
© GoodData
2021 GoodData Corporation
Confidential. 2020 GoodData Corporation. All rights reserved 21The automation tools of your embedded analytics
platform should therefore primarily cover the following
governance processes:
• Agile change management enables the fast
release of changes to hundreds or thousands of
user groups without breaking their customized
dashboards and visualizations.
• Dynamic provisioning of user groups, and users’
roles and permissions.
Please note: these difficulties are efficiently addressed by the
analytics architecture built with workspaces, mentioned in option
4 of the previous chapter.
The benefits of well-designed change management
While the end users still have the ability to develop
custom visualizations and dashboards inside their own
user group, the automation processes also allow you
to create standardized dashboards, distribute them to
end users, and manage all their later changes.
Onboarding new user groups should be a fully-
automated process. If you can provide the list of end
users as part of the data feed, the platform should
create, and decommission, workspaces without
any manual intervention. The same goes for users,
which can be automatically added and removed from
workspaces based on declarative input.
Ideally, the automated change-management tasks
should be scheduled, and available via REST APIs
and SDKs that can be used for integrating change
management and provisioning with a continuous
delivery process.
Moreover, the automation tools should enable
agile change management with the inclusion of a
development environment, a testing environment,
and a production environment, providing the ability to
propagate changes to production without disrupting
the end-user experience.
© GoodData
2021 GoodData Corporation
Confidential. 2020 GoodData Corporation. All rights reserved 22The agile change management automates the entire
change management process of moving the data
model, metrics, dashboards, and so on, from dev, to
test, to production, all while maintaining localized
customizations.
Managing the changes in data sources and
data models
Your solution team doesn’t have to worry about how
complicated writing queries is, if you have just a few
preset dashboards with a few end users.
However, when rolling out an analytics solution to
hundreds or thousands of end users within hundreds
of user groups, with a self-service mode included, the
composition and availability of the query language
affects the overall performance and productivity of
your business teams as much as the flexibility and
sustainability of the analytics solution.
In order to efficiently run an analytics solution for so
many users, separate user groups, and use cases, these
are the features you should look for:
• Transparent, easy-to-change data pipelines
• Reusable, context-aware metrics
© GoodData
2021 GoodData Corporation
Confidential. 2020 GoodData Corporation. All rights reserved 23Logical data model - the transparency of
data pipelines
The logical data model is a feature that describes the
way your data is structured. To be more specific, the
logical data model describes the objects your data
is composed of: attributes, dimensions, and facts. It
also describes how dimensions and facts relate to one
another (meaning relationships between data sets),
hence it defines what is able to be calculated and
displayed in visualizations, and what is not.
Apart from ensuring the veracity of your data, there are
two more benefits that come from this feature.
• Firstly, you simply work with the logical data model
and load data into the analytics platform in the
format defined by the model.
This way, your data models actually help you
abstract “physical data” - allowing you to easily
and transparently work with, and accommodate,
the whole data pipeline (from the data source
to dashboards). As the next step, the analytics
platform maps the logical data model to physical
data in an automated process.
• Secondly, the logical data model lays the
foundations for reusable, context-aware metrics
(more on this later).
Ideally, the logical data model can be created by data
specialists, right away, in the analytics platform, by
using an easy-to-use, drag-and-drop modeler tool.
The logical data modeler allows your data specialist to
easily communicate and explain the data model to the
rest of the team. And due to it all being integrated into
a single interface, data engineers, data analysts, and
business users can all collaborate and work together in
one unified environment.
© GoodData
2021 GoodData Corporation
Confidential. 2020 GoodData Corporation. All rights reserved 24An example of a built-in modeler tool
Attribute: describes an entity (typically text). For
example: Customer, Order Date, Order, Product. We
use attributes to group and filter our dimensions.
Fact: is simply a number. It’s a numerical piece of
information that we can perform some calculation
on. For example: Age, Price, Order Amount, Product
Cost, Salary.
Dimension: is simply text that describes what the fact
relates to precisely. For example: Order ID, Customer
ID, Order Date, Shipment Date, Product category.
Metrics (measures): are calculations based on facts. A
measure points to a fact (such as price) and specifies an
aggregation function (such as average).
© GoodData
2021 GoodData Corporation
Confidential. 2020 GoodData Corporation. All rights reserved 25The power of a query language - the reusable,
context-aware metrics
For every simple variance of an existing visualization
that’s defined by attributes, dimensions, and metrics,
you want to change as few lines of code as possible.
The less you need to change, the less you can break and
the less complicated maintenance will be. So, if your
metrics have to be written again, just to accomplish
simple visualization changes, your analytics solution
will quickly become difficult to maintain as your user
base grows.
For every simple variance of an existing visualization
that’s defined by attributes, dimensions, and metrics,
you want to change as few lines of code as possible.
The less you need to change, the less you can break
and the less complicated maintenance will be.
The properties of such a query language include:
• easy to understand expressions for non-technical
users.
• context-awareness, meaning, for example, that
one metric can be reused for ten thousand reports,
generating the specific query base needed for a
specific context. In short, you don’t need to create
individual metrics or queries for each report -
create your base technical metrics once and make
them widely reusable for end-users in different
contexts, with the ability to create their own
custom metrics expressions, from existing ones, to
save and use later as needed.
The cons of such a query language are:
• one defined metric can replace plenty of SQL
query scripts making it easier to write and maintain
your semantic / analytical model.
• it allows you to assemble a new metric from
existing ones without the need to know how
underlying data is structured and how related
metrics are connected.
© GoodData
2021 GoodData Corporation
Confidential. 2020 GoodData Corporation. All rights reserved 26Therefore, visualizations built with such a query
language are context-aware, meaning that a specific
metric performs different computations with a many-to-
many relationship to prevent double-counting, further
enabling ease of use for metric creation and reusability.
Example:
Let’s take a look at an example of MAQL - a query language used in
GoodData - and compare it to a standard SQL-based query.
Your goal is to get the sales data from your database. In SQL, the query
might be the following:
SQL: SELECT SUM(Amount) FROM sales_data;
The result will be 1 000 000 - the total value of products you have sold.
With MAQL, it’s much easier to deliver the same results:
MAQL: SELECT SUM(Amount)
So where is the sales_data table? With MAQL, it’s not necessary,
all relevant amounts are summed from the appropriate datastore,
according to the logical data model.
The complexity difference is best seen in detailed queries - for instance
how much was generated from shoe sales?
SQL: SELECT SUM(amount) FROM sales_data JOIN product_data ON
sales_data.product_type_id=product_data.product_type_id WHERE
product_data.name = “shoes”;
The result is 500 000. To get the number in a SQL-based environment,
you need to understand the table and column structure, understand the
relational algebra and how data is stored in your database.
With MAQL the difference is even more obvious:
MAQL: SELECT SUM(Amount) WHERE Product Type = shoes
As you can see, you don’t have to remember how to
join tables to get the results; you can easily reuse the
metrics as you want with business semantics.
© GoodData
2021 GoodData Corporation
Confidential. 2020 GoodData Corporation. All rights reserved 27The benefits that will save you in execution
While some analytics tools do not require a logical data model (or its
equivalent) to be defined, this usually means that every single visualization
requires you to write a separate query (i.e. in SQL or a similar language) or
define some kind of mapping to the physical data.
With a predefined logical model, you define the mapping and relationships
once and then you can reuse the same objects multiple times for many
different visualizations.
By using logical data models, you are unlocking endless possibilities for
ad-hoc analysis even for people who are not trained data analysts and are
not 100% familiar with all the details of how the data is structured. It also
lays the foundation for efficient scaling and change management.
© GoodData
2021 GoodData Corporation
Confidential. 2020 GoodData Corporation. All rights reserved 28Data integration: quickly and reliably
Data integration is one of the most crucial aspects when
choosing an analytics solution for your application. You
are instinctively trying to find an analytics solution that
would fit with your existing data infrastructure, so that
you limit any additional investments, both technological
and knowledge-based.
You are instinctively trying to find an analytics solution
that would fit with your existing data infrastructure,
so that you limit any additional investments, both
technological and knowledge-based.
An embedded analytics platform should support
various types of data sources:
1. Cloud data warehouses, such as Amazon Redshift,
Google BigQuery, and Snowflake
— popular data-warehouse solutions that you
will need in the future, if you do not have
one yet.
2. CSV files, such as those hosted in the cloud in an
Amazon S3 bucket or manually loaded
— so that your non-technical users can also
easily upload data into the analytics platform
themselves.
3. Pre-built connectors to various systems, platforms
and applications
— so that you can accelerate the migration and
avoid maintaining APIs and connectors
yourself.
1. Cloud data warehouse integration. There is more
to it.
We have already spoken about the logical data
model facilitating the creation and control of the
data pipeline, together with metrics built with an
efficient query language, which abstracts the data
complexities for data specialists and end users.
© GoodData
2021 GoodData Corporation
Confidential. 2020 GoodData Corporation. All rights reserved 29The logical data model can be either created from
scratch or derived from your existing data sources
and then modeled according to your needs.
With cloud data warehouse integration, the analytics
platform should help you to adjust your source data
structure according to the data model, so that data
mapping requires as few steps as possible and can
be fully automated.
Here is an example of how it works with GoodData:
© GoodData
2021 GoodData Corporation
Confidential. 2020 GoodData Corporation. All rights reserved 30After creating the data model and publishing it to
your desired user groups, you will set up automated
data distribution, to regularly update your data
model with mapped data from your cloud data
warehouse, keeping everything up to date.
2. CSV files with automated distribution
A similar process should apply for CSV files,
which can be manually uploaded or uploaded
via an automated distribution from a cloud data
warehouse, such as your Amazon S3 bucket, where
your CSV files are stored.
In fact, CSV file integration via automated distribution
is the best way to integrate your embedded analytics
platform with any datasource without the need to
configure a specific connector.
You can simply export your data to an S3 bucket and,
thanks to the built-in data model, let the analytics
platform physically load and map data automatically.
The mapping tells the analytics platform which fields
from your data source to load into which fields in
the data model.
© GoodData
2021 GoodData Corporation
Confidential. 2020 GoodData Corporation. All rights reserved 31Are you interested in how GoodData works with
CSV files with S3 distribution? Read our blogpost to
learn more.
3. Integrating only with data from other systems
When working with dedicated pre-built connectors,
it’s likely that you won’t be operating your own data
warehouse.
Therefore, the ideal embedded analytics solution
should also offer data warehousing services to store
large amounts of data coming from your connectors
to your operational systems or other data sources.
Such warehousing services should be designed
for high performance operations in order to store
the full history of your data along with quick data
extracts. A typical example are column-oriented
database systems.
Migrating between different methods
Another important thing to consider is whether or not the analytics
solution allows you to easily switch between different migration methods.
For example, letting you start by developing with a set of CSV files and
later switching to automated data loads from Snowflake.
To ensure this process will be as smooth as possible for your teams, the
analytics platform needs to have developed a comprehensive mapping
system between data sources and the analytics platform itself (namely, a
data modeling tool).
The migration will be simple as long as the mapping doesn’t need to
change, meaning that the data in your different data sources has the same
structure and column names.
© GoodData
2021 GoodData Corporation
Confidential. 2020 GoodData Corporation. All rights reserved 32Data security: don’t struggle with
security and privacy
Working with data and running an analytics solution
requires that you meet various security requirements
and regulatory standards. These requirements evolve,
with new regulatory standards, for different regions or
industries, being introduced over time. Moreover, you
might consider entering a market that requires a higher
set of standards than you originally planned.
These requirements evolve, with new regulatory standards,
for different regions or industries, being introduced over
time. Moreover, you might consider entering a market that
requires a higher set of standards than you originally planned.
The ideal embedded analytics platform should cover all
of the problems above, with the highest level of data
security and protection, in order to strengthen trust,
provide full transparency, and enhance governance,
risk management and compliance, for companies of
any size.
Every solution owner must oversee and properly plan
all of the security aspects - (1) cloud and physical, (2)
data and (3) operational security.
Let’s take a look at three layers of security and the best
practices surrounding them.
1. Cloud and physical security
• nterprise-class SOC 2 Type II-audited and
E
ISO 27001-certified facilities that include
24/7/365 managed security and physical
access control.
• Monitoring the platform and all of its
underlying operating components for
security incidents, including; alert
notifications generated by the platform
systems, industry and open source alerts,
and community alerts.
© GoodData
2021 GoodData Corporation
Confidential. 2020 GoodData Corporation. All rights reserved 33• Three-level support team on-duty 24/7 and
trained to provide systematic and efficient
responses to incidents, including security and
availability issues.
2. Data security
• nsuring all data remains confidential,
E
available, and backed up for governance and
disaster recovery purposes.
• Security zones are defined and implemented
with specific enforcements, such as protocol
enforcement, intrusion detection and
monitoring, and the platform is subjected to
regular penetration testing.
• Customer data is both isolated and
encrypted in transport as well as at rest to
further enhance its defense.
3. Operational security
• Access to the production environment is
under strict control
• Administrators are allowed to invoke
platform-specific functions but not to directly
interact with the platform’s underlying
components.
• Access logs are monitored and regularly
inspected.
The measures detailed above meet the best
practices for ensuring the secure operation of any
analytical solution.
Moreover, your embedded analytics vendor should give
you the freedom to choose which service-level support
your business needs as each level represents a
certain level of expertise and dedicated team of
cybersecurity experts.
Example:
Basic security - covers industry standard best practices
for data protection in the cloud, including; SOC 2 Type
II report, ISO 27001:2013 compliance, GDPR compliance
and CCPA compliance.
© GoodData
2021 GoodData Corporation
Confidential. 2020 GoodData Corporation. All rights reserved 34Additional security - supports environments with
sensitive or regulated data that require additional
assurance on security practices, data handling, and
implementation. All platform events are tracked in an
audit log and security/risk assessments, reporting, and
audits are covered also. Patch management is covered
by SLA.
Regulatory add-ons for specific use cases:
• HIPAA, including BAA and additional
arrangements, to ensure customers comply with
the HIPAA regulatory requirements.
• GDPR Article 9 add-on including DPA and
additional arrangements to ensure compliance with
requirements for processing of special categories
of data under Article 9 EU GDPR.
Monitoring: analytics over analytics
You should also be able to understand how users are
consuming your analytics. The data will help you with
both quantitative and qualitative research that your
teams should conduct when improving the products.
The final goal is clear: maximized user adoption
and satisfaction; yielding increased usage of your
analytics solution.
The final goal is clear: maximized user adoption
and satisfaction; yielding increased usage of your
analytics solution.
© GoodData
2021 GoodData Corporation
Confidential. 2020 GoodData Corporation. All rights reserved 35Your analytics experience will need analytics in its own
right to help you not only proactively monitor your
environment but also to answer key questions such as:
• I’ve released a new dashboard. What is the rate
of adoption?
• I’ve been in analytics for a while already. I have
dozens of visualizations, dashboards... I would like
to understand: Which ones are actually being
used? Which should I focus on? What can I delete
(impact analysis)?
• Some of my users have ad-hoc capability. Which
parts of my model do they use? How often? What
data are my users interested in? Is the adoption/
usage actually better compared to canned
analytics only?
• Are there specific areas of analytics with high
utilization? Should I focus on/optimize for them?
• I would like to see my overall contract utilization
- all environments, all instances (including personal
and developmental ones). What is the trend?
• I’m refreshing the workspaces frequently. Is it
necessary for all of them? Which are frequently
used? (I would like to optimize the costs, prioritize
the ETL…)
© GoodData
2021 GoodData Corporation
Confidential. 2020 GoodData Corporation. All rights reserved 36With properly-set-up analytics you will get the answers
and understand how it is working among your end users
and user groups. Consequently, you will see the patterns
that might lead you to a change in your setup. You will
also be able to prototype a new analytical function and
study how it’s being used or find analytics champions,
among your end users, who can help you with your
user research.
C. The Extras
Developing data products
What is a data product?
Data products, often referred to in the business space,
are any application of data analytics of value to the
business, be it in helping the business to generate
revenue, optimize costs, mitigate risk, or improve
compliance. Common data products examples are;
finance terminals such as the Bloomberg Terminal, or
website analytics tools such as Google Analytics.
The term “data product” is commonly used within product
and development teams:
• In software companies that develop a software product offering for
their paying or non-paying customers.
• In enterprises, or large-scale or distributed organizations, that want
to evolve into data-driven companies, and hence develop their own
internal user-focused data products, for privacy, data integrity, and
adaptability reasons.
© GoodData
2021 GoodData Corporation
Confidential. 2020 GoodData Corporation. All rights reserved 37Why talk about data products now?
Data products benefit from, or rather let’s say need, a
multi-tenant architecture and streamlined change
management to ensure that their development and
management is smooth and efficient for product and
development teams. And also to make it all work for
end users reliably.
The life-cycle of a data product goes as follows:
• Deliver an initial analytical experience (data
visualizations, reports, dashboards, etc.) to new
tenants (e.g. organizations, customers, business
partners).
• Organizations customize their analytics with self-
service tools.
• You release a new version of the analytics without
breaking the customizations.
• Rinse and repeat …
Does it remind you of anything?
You may have already read the same steps in the chapter
about multi-tenant embedded analytics. In other words,
all the guide and evaluation steps described above
apply to data products as well.
Monetizing your application and data
Monetizing your data is often referred to as the next
big thing in the space of analytics. What does it mean?
You take the data you collect and segment it into
customized dashboard tiers (per your customers). One
tier might come with a basic depth of data and be
provided for free, whilst other tiers include more data
that goes even deeper and gives a granular view of the
subject. Such tiers might be provided for a fee.
You take the data you collect and segment it into customized dashboard
tiers. One tier might come with the basic depth of data and be provided
for free, whilst other tiers include more data that goes even deeper and
gives a granular view of the subject. Such tiers might be provided for a fee.
© GoodData
2021 GoodData Corporation
Confidential. 2020 GoodData Corporation. All rights reserved 38This way you can monetize, for example, an e-commerce
marketplace through which multiple brands (retailers)
sell their products, or an application designed to be
marketed via pricing tiers.
In the end, data analytics might be one of the best reasons
for your customers/users to start using your app or upgrade
to its higher tier.
The concept of subscription tiers is the same as the
concepts of data products. Each tier is developed and
managed as part of a data product.
Building data tiers
So, if you plan on developing data products or
subscription tiers, your embedded analytics platform
should also include a suite of tools giving the possibility
to segment customers by data tiers, or by their use
preferences. With this capability, you are able to roll out
different versions of your data analytics to different
users, creating tiered pricing models to the benefit of
both your business and your customer base. All of that,
while reusing the metrics and data sources, without
duplication.
Such a suite of tools includes a multi-tenant analytics
architecture (with workspaces) and the streamlined
change management described above.
© GoodData
2021 GoodData Corporation
Confidential. 2020 GoodData Corporation. All rights reserved 39The overall management of the analytics solution and data products, or tiers if you like, might then look like this.
© GoodData
2021 GoodData Corporation
Confidential. 2020 GoodData Corporation. All rights reserved 40D. The last, or the first?
Pricing: look for a predictable and
sustainable formula
Lastly, let’s talk about the impact of pricing on your
company and costs. Inability to transparently predict
future costs can quickly erase your margins if calculated
wrong. There are three common ways by which analytical
platforms charge for their services:
• Pay per user: With this type of pricing, you will
have to charge per every user of every customer.
Unless you are going to charge your customers for
using analytics per user also, your costs will grow
unpredictably (based on the current customer user
base) and your margin calculations will become
increasingly difficult - a nightmare for your CFO.
• Pay per query: While user numbers may be
predictable at the time of customer contract
signing, traffic will not. Whenever an end user
displays a dashboard, insight or simply explores
information from the data in a self-service analytical
tool, they will hit a pay-as-you-go database (a
requirement from almost every query). This
again, means unpredictable costs, finance-team
headaches, and lost margin.
• Pay per customer workspace: Allows you to
bring analytics to each of your customer’s end-
users, predict price per customer and update your
pricing accordingly. The pricing can then be easily
calculated by number of workspaces, need of
additional data storage, and specific feature
add-ons.
Inability to transparently predict future costs can
quickly erase your margins if calculated wrong.
© GoodData
2021 GoodData Corporation
Confidential. 2020 GoodData Corporation. All rights reserved 41Example:
For instance, with GoodData, which employs the pay-per-workspace
model, if your application is being used by 10 different user groups
(= client companies, internal teams, and so on) and you need 25 GB
of additional data to distribute among them, your yearly costs will be:
$20 per workspace X 10 customers + 25 X $3.5/1GB
$287,5 X 12 = $3,450 / year.
No time to read the tech guide, but need more information?
Alternative: Talk to us.
Written guides will never cover all the questions you could have.
So if you are onto something, and our shortlist of advantages below
raises your curiosity, we highly recommend requesting a demo call
(via our website) and letting our experts take you on a guided tour of the
GoodData platform. It’s commitment free.
© GoodData
2021 GoodData Corporation
Confidential. 2020 GoodData Corporation. All rights reserved 42E. Who is GoodData
What is it that we do?
At GoodData, we believe that traditional data tools
are no longer enough. Our Data as a Service (DaaS)
infrastructure is the future of analytics: real-time, open,
secure, and scalable. GoodData’s leading cloud native
analytics platform gives our customers the flexibility to
build and scale any of their data use cases; from self-
service and embeddable analytics, to machine learning
and IoT — while maintaining the performance, cost-
efficiency, and easy change management of such a
central and integrated solution.
We have teams and data centers in the USA, Europe,
and Asia. Among our customers are leading multi-brand
e-commerce platforms, software companies (SaaS), and
global financial and payment institutions.
Why the world’s top companies choose GoodData
The GoodData Advantage
Business Technical
1. One platform for all: internal 1. Automated scaling to different
teams, client companies, departments and companies
external partners
2. Embedded dashboards in your
2. Self-service analytics for all application or software product
business managers
3. Streamlined multi-tenant change
3. Your own branding management
4. Predictable pricing to suit your 4. Abundant data-source options
business, no pay-per-user
5. Fully hosted or deployed as a
5. The highest data privacy and container in your private or public
security certifications cloud (on premises)
© GoodData
2021 GoodData Corporation
Confidential. 2020 GoodData Corporation. All rights reserved 43You can also read