Zero Waste Systems: Small Investment,Big Payoff - 1 | Small Investment, Big Payoff
←
→
Page content transcription
If your browser does not render page correctly, please read the page content below

Zero Waste
Systems:
Small Investment,Big Payoff

                 1 | Small Investment, Big Payoff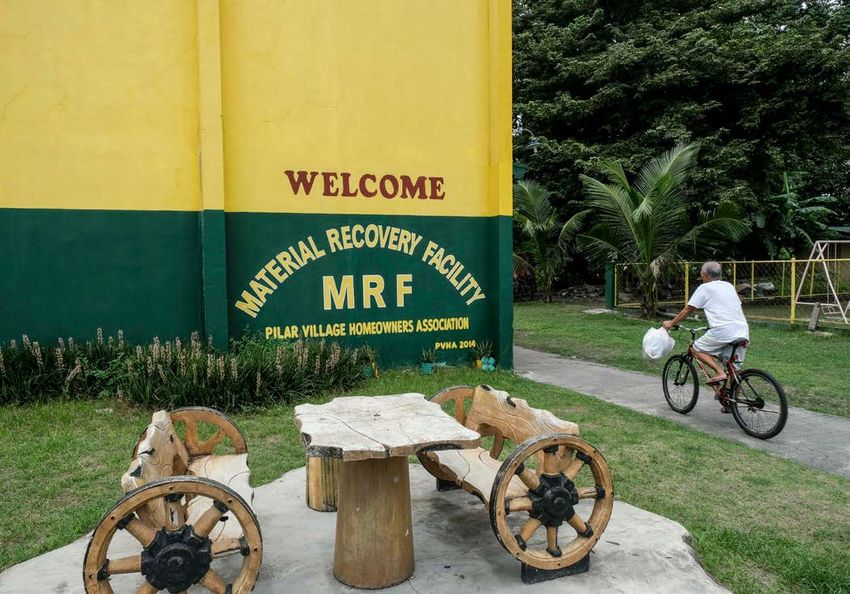
© Anto Astudillo/GAIA

Introduction
With the COVID-19 pandemic, the need to build a resilient economy is
more pressing than ever. Today, waste management is a sector that
typically uses up to 4-19% of municipal budgets.1 While zero waste
systems are known for their wide-range of environmental benefits, they
are also an affordable and practical strategy to waste management that
is greatly economically advantageous.

                         2 | Zero Waste Systems
In many cases, zero waste is the cheapest way for             costs that would be greatly offset by the value these
cities to manage waste. Strategies for saving money           strategies would generate by diverting waste from
through zero waste can vary depending on the current          incinerators and landfills.
state of waste management conditions, but existing
                                                             3.All municipalities can benefit from the
data and case studies present three clear messages:
                                                               implementation of zero waste strategies,
1. The more waste a city reduces, the higher its               regardless of where their current waste
   cost savings. Savings typically come from reduced           management system stands. Municipalities with
   costs of hauling of waste to disposal/incineration          separate collection, recycling and composting
   sites (which are themselves cost-intensive), and by         in place can extend the cost-saving potential
   capturing the value of materials through reuse and          by reducing the overall amount of waste and
   recycling. By banning non-recyclable materials such         diverting waste from cost-intensive disposal
   as single-use food packaging (and implementing              practices. Prioritizing reuse and redesign, and then
   reusable foodware containers), for example, the             recycling and composting is the most effective
   U.S. could save up to USD 7.7 billion in litter cleanup     way to cut down waste management costs and
   costs as food packaging waste represents 67% of             unlock economic and environmental health
   the street waste that normally costs USD 11.5 billion       benefits. Municipalities with an inadequate waste
   in total to clean up.                                       management system can avoid investing in quick
                                                               and capital-intensive technological fixes such as
2.Implementing material recovery strategies—
                                                               waste incineration and so-called “plastic-to-fuel”
  such as a better collection system that separates
                                                               that would pose new challenges to the environment
  material at the source (i.e. separate collection),
                                                               and the local economy in the long run, Instead, they
  recycling, and composting—to deal with
                                                               can save money longer-term by investing in zero
  current waste levels is still more affordable
                                                               waste systems, such as a separate collection and
  and economically sound than relying on waste
                                                               better recycling and composting infrastructure.
  incineration and landfilling. While there may be an
                                                               Remaining in the status quo, however, would only
  upfront cost to implementing these strategies, data
                                                               mean more economic loss, including health costs
  show that they would typically cost municipalities
                                                               associated with open dumps and open burning.
  between USD 8 and USD 119 per person per year,

Key Findings:
• By implementing a better collection and recycling/             • Cities in the Philippines have already saved
  composting system, municipalities can, on average,               between USD 392,000 - USD 413,000 a year
  reduce waste management costs per tonne of waste
                                                                 • Cities in Italy, Spain, and France have already
  by 70%2
                                                                   saved between USD 43,000 - USD 2.4 million a
• The experience within GAIA’s network in cities                   year
  around the world shows that municipalities across
                                                                 • Cities in Bolivia and Chile have already saved
  population-size and income levels have benefited
                                                                   between USD 270,000 - USD 2.3 million a year
  from cost savings through zero waste, including:

                                          3 | Small Investment, Big Payoff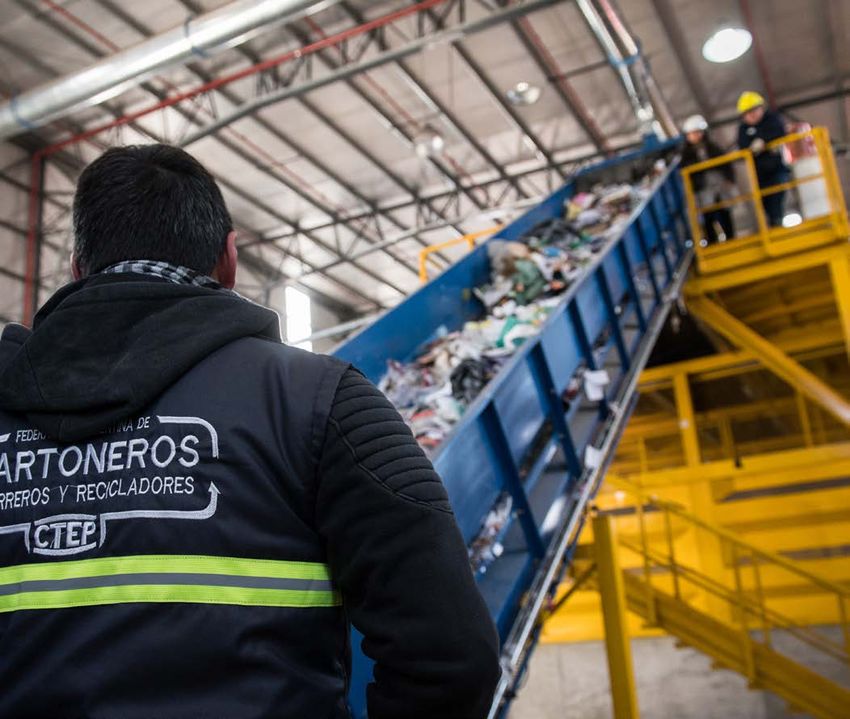
Part 2 -- The cost-effectiveness of zero
waste interventions vs. traditional waste
management
Improving waste collection and waste management                The table below estimates the operational costs of
systems is one of the first steps toward creating a            the basic zero waste system interventions (separate
zero waste city, but it is also a strategic and cost-          collection, recycling, and composting) and those of a
effective approach to overall waste management                 waste disposal system (waste-to-energy incineration
that municipalities can take. Waste management                 and landfills).
costs may vary widely across countries—depending
                                                               Regardless of the income bracket the countries
on location, income levels, and amount and types
                                                               belong to, recycling and composting costs per tonne
of waste generated, among many factors—but clear
                                                               are consistently lower than that of landfilling and
patterns emerge across the board.
                                                               strikingly lower than that of waste incineration.

Cost estimates for discrete waste operations (USD/tonne)

                 collection        recycling           composting        incineration/WTE           landfills

                 low     high      low        high     low    high       low     high               low     high

 Lower Income    20      50        0          15       5      30         N/A     N/A                10      30
 Countries

 Lower-middle    30      75        5          30       10     40         40      100                15      40
 Income
 Countries

 Upper-middle    50      100       5          50       20     75         60      150                25      65
 Income
 Countries

 High Income     90      200       30         80       35     90         70      200                40      100
 Countries

Source: World Bank (2018). What a Waste 2.0

While collection costs remain relatively high in the           1. a zero-waste optimized scenario (in which the
liberal estimate, optimal collection plays a key role in          potential for source-separated collection, recycling,
facilitating recycling and composting, and diverting              and composting is maximized)
recuperable materials from incineration and landfills.
                                                               2.a landfill-heavy scenario (in which 100% of waste is
In order to put these discreet figures into context, the         sent to landfills)
graph below shows the costs for three different waste
                                                               3. a WTE-heavy scenario (in which 100% waste is
management scenarios*:
                                                                 sent to WTE, and 30% of waste still required to be
                                                                 landfilled as incineration ash)3

                                                   4 | Zero Waste Systems
Waste management costs in three scenarios (USD/tonne)4

200

180

160

140

120

100

 80

 60

 40

 20

                                                                                            137

                                                                                                                             176
                                                                                     45
                      20

                                                     28
                                                23

                                                                                                               59

                                                                                                                        70
              16

                                                             91

                                                                              41
  0
                  LIC*                               LMI                              UMI                               HI

Source: Analysis based on World Bank (2018). What a Waste 2.0 (data table)

* These scenarios are based on per tonne costs for collection, recycling, composting, incineration, and landfilling, in
proportion to the ratio of the current waste management structure in four country income categories.

      ZW based on current waste diversion rates            *Data are not available due to low technical and financial
                                                           viability of waste incineration in lower-income countries
      Landfills (all waste sent to landfills)

      WTE (all waste sent to WTE)

Both the WTE scenario and the landfill scenario show                   Implementing a better collection and recycling/
a drastic increase in expenditures per tonne of waste                  composting system would reduce per tonne waste
processed compared to the zero-waste optimised                         management costs by 66-75% across three country
scenario. Heavy reliance on WTE incineration is the                    income categories; 66% in high income countries
most expensive waste management approach, with                         compared to the WTE-heavy scenario; 70% in upper-
estimated costs amounting to three times the costs                     middle income countries; and 75% in lower-middle
of landfill operation and up to five times the costs                   income countries.5
associated with recycling and composting.

                                                 5 | Small Investment, Big Payoff
© Santiago Vivacqua/GAIA

Part 3 - Case studies:
living examples that showcase the
economic benefits of zero waste
Across the globe, a growing number of municipalities     generation. Both waste reduction and rescue bring
have undertaken efforts toward a systemic transition     additional benefits, which include high job creation
to zero waste. Data show that zero waste schemes         potential and reduced pollution.
such as recycling and composting are more affordable
                                                         Following are living examples from GAIA’s network6
compared to capital-intensive disposal infrastructure,
                                                         that show how zero waste systems have reduced
but they also bring additional revenues generated by
                                                         overall waste management costs by implementing
capturing the material value of these rescued items.
                                                         strategies that either primarily prioritize waste
Municipalities are further able to achieve greater
                                                         reduction or prioritize source separation and reuse
cost savings by reducing the overall amount of waste
                                                         strategies.
they produce, especially in countries with high waste

                                           6 | Zero Waste Systems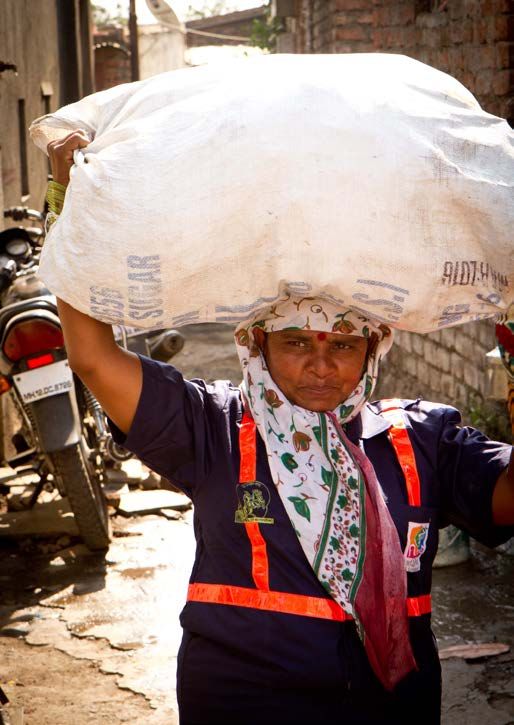
Cities that benefit from waste reduction:

 ©VJ Villafranca/GAIA

Case study -- San Fernando
San Fernando cut down landfill costs by 25 times and hauling costs by half by implementing bans on plastic
bags and styrofoam food packaging,7 significantly reducing waste, and by implementing source separation
programs that divert waste from disposal systems.

Before           After                       How                                          Cost and savings

12% diversion    Over 80% diversion rate     Strong political will that enacted Plastic   With less waste, the city now only spends
rate             achieved.                   Free Ordinance                               PHP 34.6M (USD 677,404) annually on
                                                                                          waste hauling, about half compared to
                 The city is planning to     Leading an intensive public information,
                                                                                          PHP 70M (USD 1.4M) in previous years.
                 increase the diversion      education, and communication (IEC)
                 rate to 91% by 2024,        campaign for residents, which targets        With proper segregation and
                 the maximum rate            business establishments and aims to          management, and reduction on the use
                 that can be achieved        gradually phase out the use of plastic       of plastics, the city was able to reduce
                 through recycling and       bags and styrofoam packaging for food        58% on the disposal of residual wastes,
                 composting.                 products.                                    from PHP 156M to PHP 65M.

                                             Waste analysis and characterization
                                             study

                                             No-segregation, no collection

                                             Partnership with waste pickers;
                                             currently 160 waste workers are
                                             fully integrated into the solid waste
                                             management program at the barangay
                                             and city levels.

                                           7 | Small Investment, Big Payoff
Cities that benefit from waste reduction:

 © Zero Waste Europe

Case Study -- Parma
Parma, a city with a population of approximately 193,000, was able to reduce waste generation by 15%, and
the volume of the waste sent for disposal decreased by nearly 60%. This was accomplished within just 4 years
of implementing a door-to-door separate collection with a pay-as-you-throw (PAYT) system.8 The annual cost
savings were €450,000.9

Before (2011)          After (2015)                     How               Cost and savings

 Separate collection   Separate collection rate: 72%    Door-to-door      Reduction in the overall annual costs of
 rate: 48.5%                                            separate          €450,000.
                       Reduced total waste generation
                                                        collection with
                       by 15%                                             An increase in collection costs was covered by
                                                        PAYT system
                                                                          revenues from selling high-purity materials and
                       Residual waste decreased by      and incentives
                                                                          the annual disposal costs that dropped by almost
                       59% (annual per capita waste     for home
                                                                          €3.5 million.
                       generation decreased from 313    composting.
                       kg to 126 kg).                                     Door-to-door collection system has significantly
                                                                          increased the number of direct jobs created in
                                                                          collection,jumping from 77 before the change of
                                                                          the system to 121 operators in 2015.

                                               8 | Zero Waste Systems
Cities that benefit from waste diversion:
© Zero Waste Europe?
© Francisca Faundez/Plataforma Urbana
Case study -- La Pintana
La Pintana’s impressive composting schemes have efficiently diverted organic waste from landfills with a small
budget, by building a vermicompost site using existing infrastructure.10 In addition to daily savings of USD 754
in waste management costs, the residents have enjoyed agricultural and recreational services provided by the
composting site.
Before After How Cost and savings
All organic waste was 44 tonnes of organic waste Conducted waste audit and Reduction in transport and
sent to landfills. were recovered per day, y, the characterization analysis disposal costs
equivalent of 20.5% of all organic
Organic waste collection and Per tonne costs: USD 3 for
waste in La Pintana.
composting program based on composting, USD 19 for landfills
Only 0.04% contamination existing infrastructure
Daily savings in disposal costs
rate through effective source
Developed a site consisting of a estimated to be USD 754.
separation.
small compost pile and worms into
Compost and vermiculture plant
Residents receive free compost a compost facility equipped with
operation costs USD 31,036 a year
and benefit from a mulching worm beds and a vermiculture area.
plant, a nursery, and an “urban Environmental education costs
silviculture” program that USD 69,000 a year
includes a wood shop.
Municipal solid waste collection
about 1,000 liters of used kitchen USD 1,632,683 a year
oil is recovered daily.
9 | Small Investment, Big PayoffPart 4 -- Zero waste works:
savings & earnings by city
All over the world, municipalities have enabled cost savings by sending less waste to landfills or incinerators,
and by increasing their rate of recycling and composting.
Proven cost savings
volume of materials recovered through zero
Asia
waste strategies amounted to €2 million (USD 2.4
• San Fernando, Philippines: After implementing million) in 2009, which was partially used to hire 50
source separation programs and bans on plastic employees.12
bags and styrofoam food packaging, San Fernando’s
• Argentona, Spain: The implementation of a Pay-
waste diversion rate jumped from 12% to 80%, saving
As-You-Throw program generated annual profits of
approximately PHP 20 million (USD 392,000) annually
€35,000 (USD 43,000) from the sales of recyclables
in the solid waste management budget.11
and sending less waste to landfills, while being
• Tacloban, Philippines: With a source separation largely self-funded.13
program being rolled out and landfilled waste down
• Pontevedra, Spain: the costs of local composting
by 31%, the city is saving PHP 21.6 million (USD
systems went down as the city diverted more organic
413,000) in its annual budget.
waste. Per tonne of organic waste, incineration costs
€235.5 (USD 285) whereas individual composting,
Europe community composting, and municipal composting
• Capannori, Italy: The savings from waste diversion respectively cost €95 (USD 115), €110 (USD 133) , and
from landfills and earnings from the increased €140 (USD 169).14
10 | Zero Waste Systems• Parma, Italy: Through Pay-As-You-Throw programs, landfills, through a program on source separation by
Parma’s residual waste generation was cut by nearly households.18
60% in 4 years, reducing annual costs by €450,000
• La Pintana, Chile: Composting costs USD 3 per tonne
(USD 546,000).15
of vegetable waste while landfills cost USD 19 for
• Gipuzkoa, Spain: Usurbil (city in Gipuzkoa province) the same amount. By diverting vegetable waste, the
saved €25 per capita per year through achieving largest fraction in the waste stream, from landfills
higher recycling rates.16 to a composting site with worm beds, La Pintana is
saving over USD 275,000 every year.19
• Besançon, France: Diverting organic waste through
home and community composting programs yielded
savings of at least €792,900 (USD 962,900) in 2016.17
Africa
Latin America • South Africa: Waste pickers in South African
municipalities divert 80% to 90% of discarded items
• La Paz and other cities in Bolivia: The Eco- from disposal, saving municipalities up to R750
Vecindarios project generated over USD 2.3 million (USD 51 million) in annual disposal costs.20
million by preventing recyclables from ending up in
Projected cost savings
Asia Pacific Europe
• Auckland, New Zealand: Efficient use of curbside • London, UK: Solid waste disposal currently costs
collection systems for recycling and organic waste £2 billion (USD 2.4 billion) per year, which can be
separation can save around USD 12 per household reduced by zero waste programs. Cutting single-
per year.21 use plastic and food waste by 20% would yield £42
million (USD 56 million) in savings; £10M million (USD
USA/Canada 13 million) with reuse and repair; £120 million (USD
160 million) with anaerobic digestion of organic
• Hawaii, USA: By diverting materials that are waste.24
recoverable through reuse, composting, and
recycling from landfills, the County of Hawaii can add
nearly USD 11 million in revenues.22 Africa
• Austin, USA: Efforts toward 75% waste diversion are • Dar es Salaam, Tanzania: The potential revenues
estimated to save USD 4.2 million per year through a from currently-uncaptured plastic scrap in the city
decrease in landfill costs.23 add up to USD 28 million per year.25
• Durban, South Africa: The removal and rehabilitation
of illegal dumping sites costs the waste management
sector of eThekwini Municipality (DSW) R180,000,000
(USD 12 million) a year, which can be saved by
implementing collection and recovery of discarded
materials.26
11 | Small Investment, Big PayoffPart 5 -- Conclusion
While the goal of diverting all waste from disposal Implementing zero waste schemes are affordable,
might seem distant, improving existing systems as they do not involve cost-prohibitive and polluting
for waste collection, recycling, and composting disposal options such as incineration and landfilling.
-- which is a crucial and effective step toward a In some cases, revenues and saved disposal costs
complete zero waste system -- would only require were enough to cover the bulk of waste collection
modest budget investments, with the potential and management costs, while bringing in other
for substantial savings, particularly through waste direct and indirect economic benefits. Cutting down
reduction mechanisms. As shown in the featured waste, recovering materials, keeping toxins out of air,
case studies, municipalities all across the globe have water, and land, reducing greenhouse gas emissions,
already transitioned toward zero waste and present providing nutrients through composting, and creating
living examples of economically sound and effective good jobs are just some of the additional advantages
solutions to the waste problem. that zero waste brings as it lays at the foundation of a
circular and resilient economy.
Appendix
Based on the best available data, the required management systems would cost if municipalities
operational costs for collection and management of unlocked the potential for 100% separate collection,
all waste are estimated to range from USD 8 (lower and maximized recycling and municipal composting
income countries) to USD 119 (high income countries) based on the current waste generation and proportion
per person on a yearly basis.27 The table below of recyclable or compostable materials in the current
estimates these figures, suggesting what waste waste composition.
Annual per capita cost estimates for waste operations (USD/resident/year)
Average per Recyclable Compostable Disposal fraction*** Waste
capita waste fraction** fraction management costs
generation (USD/person/year)
(kg/year)
Lower Income 146 17% 56% 27% 8
Countries
Lower-middle 193 30% 53% 17% 15
Income
Countries
Upper-middle 251* 31% 54% 15% 29
Income
Countries
High Income 577 57% 32% 11% 118
Countries
* High per capita costs in high income countries are attributable to large amounts of waste generated per person as well
as higher prices and labor costs.
** Materials that are potentially recyclable: paper, plastic, metal, glass, etc.
*** The disposal fraction is smaller in zero waste cities with waste reduction strategies.
12 | Zero Waste SystemsThese figures show that municipalities can operate waste management systems with a modest investment.
With a prerequisite that waste management should be implemented with a zero waste philosophy, these
estimates include disposal costs at landfills based on the current residue generation rates in order to provide
an indication of budget requirements.
Acknowledgements
This report is authored by Doun Moon. Research
was supported by John Ribeiro-Broomhead and
Alexandra Rollings. It was edited by Natasha Naayem
and designed by Shanthony Art & Design. Other
contributors and reviewers include Miko Aliño, Cecilia
Allen, Claire Arkin, Sherma Benosa, Magdalena
Donoso, Kevin Drew, Edel Garingan, Jack McQuibban,
Yobel Novian Putra, Steven Sherman, Neil Tangri,
Janek Vahk, and Monica Wilson.
This report has been made possible in part through
funding from Plastic Solutions Fund. The views
expressed in this publication do not necessarily
reflect those of Plastic Solutions Fund.
DOI: www.doi.org/10.46556/UQHQ8840
SWaCH Pune Seva Sahakari Sanstha Ltd. is a collective Note
of self employed wastepickers that provides waste
collection and management services. It is authorised All currency exchange rates applied in this factsheet
by the Pune Municipal Corporation. © Brodie Lewis are as of December 2020.
A zero waste system can be described as a
circular loop in which used materials are put back
into the cycle of production and consumption
in order for them to become resources again,
instead of being discarded in landfills or
incinerators. Key stepping stones for a successful
shift toward zero waste include rethinking the
way we produce and consume materials, banning
packaging and products designed to be dumped,
redesigning products to be less wasteful, reusing
and repurposing materials, and recycling and
composting as much as possible.
13 | Small Investment, Big PayoffEndnotes
1 Kaza, S., Yao, L., Bhada-Tata, P., & Van Woerden, 13 Vliet, A. (2018). The Story of Argentona. Zero
F. (2018, September). What a Waste 2.0 : A Global Waste Europe. https://zerowastecities.eu/
Snapshot of Solid Waste Management to 2050. World bestpractice/best-practice-the-story-of-argentona/
Bank Group. https://openknowledge.worldbank.org/
14 McQuibban, J. (2020). The State of Zero
handle/10986/30317
Waste Municipalities 2020. Zero Waste Europe.
2 An average of three national income groups. https://zerowastecities.eu/wp-content/
Please see Part 2 for more details. uploads/2020/12/zwe_report_state-of-zero-waste-
municipalities-2020_en.pdf
3 These calculations are underestimated as the
capital expenditure for incinerators is a bigger 15 Folli, G. (2018, February). Cheaper and more
source of financial needs than operational costs. efficient? The positive effects of pay-as-you-throw
and kerbside collection. Zero Waste Europe. https://
4 Collection costs not included
zerowasteeurope.eu/2018/02/cheaper-more-
5 Data for lower-income countries are not available. efficient-pay-as-you-throw-kerbside-collection/
6 For more information, see our websites no-burn. 16 Zero Waste Cities. (2020, February). The story
org and zerowasteeurope.eu of Gipuzkoa, Spain. https://zerowastecities.eu/
bestpractice/best-practice-the-story-of-gipuzkoa/
7 GAIA. (2019). Picking Up The Baton: Political Will
Key to Zero Waste. https://zerowasteworld.org/wp- 17 Zero Waste Cities. (2020, March). The story of
content/uploads/San-Fernando.pdf Besançon, France. https://zerowastecities.eu/
bestpractice/besancon/
8 Pay-As-You-Throw (PAYT) program charges
households for solid waste collected based on the 18 Omari, H. “Dar Urban Jobs Solid Waste Market
amount of waste thrown away. System Analysis” for DFID and UK Aid. Research
provided by direct communication.
9 Folli, G. (2018, February). Cheaper and more
efficient? The positive effects of pay-as-you-throw 19 Allen, C. (2012, June). Prioritizing the Recovery of
and kerbside collection. Zero Waste Europe. https:// Vegetable Waste. GAIA. https://www.no-burn.org/
zerowasteeurope.eu/2018/02/cheaper-more- wp-content/uploads/ZW-La-Pintana.pdf
efficient-pay-as-you-throw-kerbside-collection/
20 CSIR. (2016, March). Integrating Informal Waste
10 Allen, C. (2012, June). Prioritizing the Recovery of Pickers into the Economy. https://www.csir.co.za/
Vegetable Waste. GAIA. https://www.no-burn.org/ integrating-informal-waste-pickers-economy
wp-content/uploads/ZW-La-Pintana.pdf
21 Auckland Council. (2018). Auckland Waste
11 GAIA. (2019). Picking Up The Baton: Political Will Management and Minimisation Plan 2018.
Key to Zero Waste. https://zerowasteworld.org/wp- aucklandcouncil.govt.nz/plans-projects-policies-
content/uploads/San-Fernando.pdf reports-bylaws/our-plans-strategies/topic-based-
plans-strategies/environmental-plans-strategies/
12 Van Vliet, A. (2013, September). The story of docswastemanagementplan/auckland-waste-
Capannori – A Zero Waste champion. Zero Waste management-minimisation-plan.pdf
Europe. https://zerowasteeurope.eu/2013/09/the-
story-of-capannori-a-zero-waste-champion/
14 | Zero Waste Systems© VJ Villafranca/GAIA
22 Recycle Hawai‘i & Richard Anthony Associates. 26 Ethekwini Municipality. (2016, May). eTHEKWINI
(2009, March). Zero Waste Implementation Plan for MUNICIPALITY INTEGRATED WASTE MANAGEMENT
the County of Hawai‘i. http://hawaiizerowaste.org/ PLAN 2016 - 2021 (DRAFT). http://www.durban.
site-content/uploads/3-14-09-Hawaii_Zero_Waste_ gov.za/City_Services/cleansing_solid_waste/
Plan.doc.pdf Documents/eThekwini%20Municipality%20
Integrated%20Waste%20Management%20Plan%20
23 City of Austin. (2011, December). Austin Resource
2016%202021.pdf?Mobile=1&Source=%2FCity_
Recovery Master Plan. http://austintexas.gov/sites/
Services%2Fcleansing_solid_waste%2F_
default/files/files/Trash_and_Recycling/MasterPlan_
Final_12.30.pdf 27 Calculations based on average per capita
waste generation, waste composition, ratio of
24 Greater London Authority. (2018). London
different waste management options, and per tonne
Environment Strategy. Chapter 7: Waste. https://
processing costs in four different national income-
www.london.gov.uk/sites/default/files/waste.pdf
level categories. Data source: World Bank (2018).
25 Omari, H. “Dar Urban Jobs Solid Waste Market What a Waste 2.0. (data table)
System Analysis” for DFID and UK Aid. Research
provided by direct communication.
15 | Small Investment, Big PayoffYou can also read