1Q-2021 FACT BOOK PT Medco Energi Internasional Tbk (IDX Ticker: MEDC) Jakarta, June 2021

Page created by Melvin Miranda
 
CONTINUE READING
1Q-2021 FACT BOOK PT Medco Energi Internasional Tbk (IDX Ticker: MEDC) Jakarta, June 2021
1Q-2021 FACT BOOK
PT Medco Energi Internasional Tbk
(IDX Ticker: MEDC)
Jakarta, June 2021
1Q-2021 FACT BOOK PT Medco Energi Internasional Tbk (IDX Ticker: MEDC) Jakarta, June 2021
Oil and Gas Assets
1Q-2021 FACT BOOK PT Medco Energi Internasional Tbk (IDX Ticker: MEDC) Jakarta, June 2021
ASSET PORTFOLIO
                                                                      Sinphuhorm
                                                                                                                                                           Tanzania             Yemen

                           Thailand              Laos
       Bualuang

                                                            Vietnam
                                        Cambodia
                                                                         Chim Sao and Dua

                             Malaysia                                                                        Bengara
                             PM322
                                                                                    Bangkanai

         Block A                              South Natuna
                                              Sea Block B                      North                             Tarakan
                                                                               Sokang

                                                                                                         Simenggaris                          Mexico                  Libya     Oman
    Geothermal
        Sarulla                                             South Sokang                                                      Donggi Senoro
                                                                                                        West Bangkanai        LNG
                                                Singapore
             Riau IPP

                                                  Batam IPP
                                                                                 Kalimantan

                                                                                                            Sulawesi
               South
             Sumatra
              Region                                                                                                       Senoro-Toili                      Papua
                                                                                     Madura                                                                                   Papua
             Sumatra IPP                                               Sampang                                                                                                New
                                                                                       Bali Solar PV
                                                                                                                                                                              Guinea
                                                                                                Batu Hijau
                                                                        Java                             Elang

                                 Mini Hydro                      Energy Mini Hydro
                                                                 Building Cluster
                                                                 (HQ)           Geothermal       Sumbawa
                                                                                   Ijen          Solar PV

                                                    Production                                                                                         Mining Production
                                                                                                                    Power Installed
                                                    Development                                                                                        Mining Development
                                                    Exploration                                                     Power Development
                                                                                                                                                       Mining Exploration
3
1Q-2021 FACT BOOK PT Medco Energi Internasional Tbk (IDX Ticker: MEDC) Jakarta, June 2021
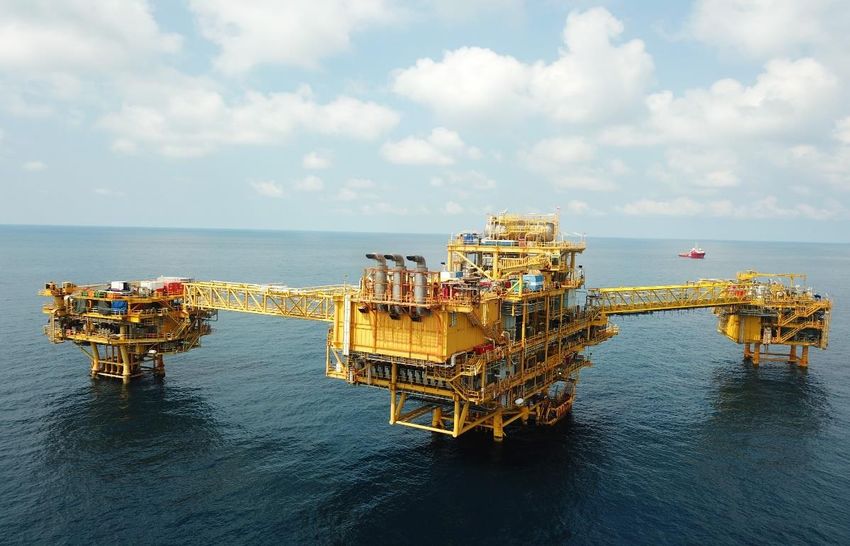
SOUTH NATUNA SEA BLOCK B, INDONESIA
    World-class offshore operational capabilities
                                                    •   MedcoEnergi operated offshore PSC in the South Natuna Sea, world class
                                                        facilities, large hydrocarbon base, license expires October 2028
                                                    •   MedcoEnergi also operates the West Natuna Transportation System
                                                        (WNTS), a 500 km 28’’ gas trunk line with access to Singapore and
                                                        Malaysia
                                                    •   Commodity linked and fixed escalated priced gas sales into Singapore and
                                                        Malaysia
                                                    •   Near field exploration, subsea & platform development, and production
                                                        optimization will extend field life and decline rate
                                                    •   Following appraisal success in Bronang-2, Kaci-2, Terubuk-5, and West
                                                        Belut-1, PSE had been approved by SKK Migas for Bronang-2, Terubuk-5,
                                                        and West Belut-1 and now entering the next stage of plan of development
                                                        (POD) preparation. Specific for Kaci, the PSE is in progress and conducted
                                                        in parallel with 3D seismic survey preparation

                                                                Malaysia
                                                                                                          WNTS Pipeline

                                                                           Singapore
4                                                        Sumatera
1Q-2021 FACT BOOK PT Medco Energi Internasional Tbk (IDX Ticker: MEDC) Jakarta, June 2021
BUALUANG FIELD, B8/38 CONCESSION, THAILAND
    Phase 4B development completed April 2020
                                                • Current production – 8,169 BOPD
                                                • Facilities: 3 bridge-linked wellhead platforms with water
                                                  processing connected via export pipeline to FSO.
                                                • Current development wells: 38 oil producers and 5 water
                                                  disposal wells. All production wells with ESPs.
                                                • Phase 4B project completed April 2020 consisting of 3rd
                                                  wellhead platform, 12 addition wells and increased
                                                  processing capacity

    FSO Suksan Salamander
5
1Q-2021 FACT BOOK PT Medco Energi Internasional Tbk (IDX Ticker: MEDC) Jakarta, June 2021
SENORO-TOILI, INDONESIA
    Integrated phased gas development

                                                1 Mtpa                 1 Mtpa                        •   Joint Operated onshore license, first production Q3
        PPGM                                                                           JERA
                                                                                      (Japan)
                                                                                                         2015. Contract expires in 2027
      (Matindok)            270                                        0.3 Mtpa                      •   Daily maximum production reached 337 MMSCFD in
                    105     85
                                                                                   Kyushu Electric       2020.
                                  DSLNG                                               (Japan)
                                                                                                     •   In 2020 additional volume in DSLNG increased to 270
              442 MMSCFD
                                                1 Mtpa                 0.7 Mtpa      Korea Gas           MMSCFD
                                                                                      (Korea)
                            20
                                                                                                     •   Gross proved reserves of 0.87 TCF with additional 2.7
                            5
                                   PLN                                              Spot buyers          TCF Gross Contingent Resources
                                                                                  (BP, Petrochina)
                                                                                                     •   Progressing Senoro Phase 2 development
      JOB PMTS      337     62                                                    • 40 cargo
       (Senoro)                   Fertilizer                                        annual
                                                                                    capacity
                            0.2                                                   • Cargo size
                                   PGN
                                                                                    125,000m3
                           (Gas Network-Jargas)

       Upstream                                Downstream                          LNG Buyer
      (Gas Producer)                            (Gas Buyer)

    For upstream:                                 Structure   Upstream WI Senoro Downstream
                                                  MedcoEnergi               30%        11.1%
                                                  Pertamina                 50%        29.0%
                                                  Mitsubishi & Kogas        20%        59.9%
6
1Q-2021 FACT BOOK PT Medco Energi Internasional Tbk (IDX Ticker: MEDC) Jakarta, June 2021
BLOCK A ACEH, INDONESIA
    Phase I will monetize 237 TBTU of gas and 5.17 MMBO of condensate for the domestic market
                                                     •   Operated onshore license, complex HPHT drilling and development
                                                     •   Over US$600mn Development, Project Financed by 15 International banks
                                                     •   First gas August 1, 2018. PSC expires in 2031. GSA with Pertamina, total
                                                         volume of 198 TBTU over 12 years
                                                     •   Remote location. Successful CSR engagement with local community and
                                                         awards from the regional Government of Aceh. Build a hospital in Aceh Area
                                                         even before project commencement, and completed in Nov 2015.
                                                     •   Phase 2 and 3 development of gas discoveries with gross Contingent
                                                         Resources of > 5 TCF, to generate up to 1 GW to support Sumatra electricity
                                                         demand growth
                                                                                            Alur Rambong
                                                                        Julu Rayeu
                                                                                            Alur Siwah

                                                                                                           Kuala Langsa

7   Central Processing Gas Facility, Block A, Aceh
1Q-2021 FACT BOOK PT Medco Energi Internasional Tbk (IDX Ticker: MEDC) Jakarta, June 2021
MADURA OFFSHORE AND SAMPANG, INDONESIA
    Stable production with upside in Meliwis and Sampang development

                                                  Madura Offshore
                                                  •   Gas from Maleo & Peluang fields and Meliwis are processed on
                                                      Maleo Production Platform (MPP) and sold to PGN and PLN via
                                                      East Java Gas Pipeline (EJGP)
                                                  Sampang
                                                  •   Following a successful gas exploration well at Paus Biru-1 (27 km
                                                      East of Oyong), working towards with reserves certification, POD,
                                                      GSA and FID
                                                  •   Gas from Oyong and Wortel fields are delivered via upstream
                                                      pipeline to Grati Onshore Processing Facility and sold to PT
                                                      Indonesia Power
                                                  Meliwis
                                                  •   Gas from Meliwis field is delivered and sold to PGN
                                                  •   Meliwis wellhead platform and subsea pipeline installation are
                                                      completed and Meliwis-2ST well was completed and deliver 1st gas
                                                      on 13 July 2020.

8
1Q-2021 FACT BOOK PT Medco Energi Internasional Tbk (IDX Ticker: MEDC) Jakarta, June 2021
CHIM SAO/DUA FIELDS, 12W PSC, VIETNAM
    Managing natural decline through well interventions and infill drilling

                                                        • Current production – 14,500 boepd
                                                        • Production through Lewek EMAS FPSO
                                                        • Chim Sao wells are tied back from a 20-slot
                                                          Well Head Platform
                                                        • 3 Dua wells are subsea completions with
                                                          subsea tie‐back to the FPSO

9
1Q-2021 FACT BOOK PT Medco Energi Internasional Tbk (IDX Ticker: MEDC) Jakarta, June 2021
SOUTH SUMATRA REGION ASSETS, INDONESIA
     Extensive experience in managing decline and controlling costs on maturing assets
                                                      • Rimau produces oil and sold to dedicated pipeline to Pertamina
                                                        Plaju refinery. The block obtained 20 years extension in PSC
                                                        Gross Split terms starting 2023.
                                                      • South Sumatra is oil & gas producing asset. The gas is currently
                                                        monetized through 11 Gas contracts. Gas is sold under fixed-
                                                        price TOP GSAs to PGN, PLN and industries within the area.
                                                      • Lematang produces High Pressure High Temperature gas from
                                                        two active gas wells. Gas is sold under fixed-price TOP GSAs to
                                                        PGN & PLN.

                                                                                                   Bangka

                                                                                     Rimau

                                                                                  South Sumatra Palembang

                                                                     Sumatra            Lematang

10
OTHER INTERNATIONAL ASSETS
                             Libya             Oman                 •   Oman: Service contract for the Karim Small Fields with net production
                                                                        ~ 12.8 MBOPD. While, Oman Block 56, Farm in agreement with Tethys
                                                                        has been executed on Oct 28, 2020. Medco WI become 5% and carried
                                                                        by Tethys.

                                                                    •   Yemen: MedcoEnergi holds a 25% non-operated interest in Block 9,
                                                                        which contains four producing oil fields. The Operator has drilled 2
                                                                        new development wells in Q1 2021 from 3 new development wells
                                                                        planned in 2021. Production for Q1 2021 averaged 5,946 BOEPD.

                                                                    •   Tanzania: Deepwater Blocks 1&4 (20% non-operated interest).
                                                                        Contains 10 discoveries with 15 TCF certified contingent resource.
                                                                        Tanzania LNG Project in pre-development phase. Engagement with the
                                                                        Government of Tanzania continues to focus on establishing key
                                                                        commercial terms for a cost competitive development.

                                                                    •   Libya: The Company holds a 50% operated interest in the exploration
       Mexico                    Tanzania         Yemen
                                                                        area of Area 47 and a 25% interest in the Joint Operating Company,
                                                                        Nafusah Oil Operations (NOO), which is the operator of the
                                                                        development and commercial discoveries in Area 47. Company,
                                                                        together with the National Oil Company (NOC), continues to work with
                                                                        NOO on a phased field development plan with minimal initial capital
                                                                        expenditure.

                Production       Development          Exploration   •   Mexico: The Company holds a 20% non-operated interest in the deep
                                                                        water exploration blocks. In 2020, the Juum-1 exploration well was
                                                                        drilled in Block 10. Preparations are underway to drill an exploration
11                                                                      well in Block 12 in 2021.
Financials and Guidance
FINANCIAL STATISTICS (1Q-2021 vs 1Q-2020)
                      Average
                                                                                Revenue                   Gross Profit                    EBITDA
                    Realized Price

          Oil                                                         Incl.                       Incl.                        Incl.
          Price
                       US$58.8                 14%                    MPI
                                                                              US$300        9%    MPI
                                                                                                          US$120         9%    MPI
                                                                                                                                       US$159       7%
                       /bbl                                                   million                     million                      million

                                                                      Excl.                       Excl.                        Excl.
          Gas          US$5.7                   1%                            US$291        9%            US$63          10%           US$152
          Price
                       /MMBTU
                                                                      MPI
                                                                              million
                                                                                                  MPI
                                                                                                          million
                                                                                                                               MPI
                                                                                                                                       million      5%

          Cash & Cash Equivalent1                                              Total Debt            Net Debt to EBITDA                Debt to Equity

          Incl.      US$695                    10%
                                                                      Incl.   US$2,676      19%
                                                                                                  Incl.
                                                                                                           3.1           17%
                                                                                                                               Incl.   2.2         23%
          MPI                                                         MPI                         MPI                          MPI
                     million                                                  million                      times                       times

          Excl.      US$426                                           Excl.   US$2,265            Excl.    3.0                 Excl.   2.3
          MPI
                     million                   36%                    MPI
                                                                              million       14%   MPI                    2%    MPI
                                                                                                                                                    3%
                                                                                                           times                       times

     1)    Cash & Cash Equivalent includes restricted cash in banks
13
CONSOLIDATED FINANCIAL PERFORMANCE
      Profit & Loss (US$ mn)       Q1-20       Q1-21       YoY ∆%    Balance Sheet (US$ mn)       Q1-20     Q1-21     YoY ∆%
      Revenue                          277        300          8.6   Cash and cash equivalents1      775       695     (10.4)
        - Oil and gas                  267        291          9.0   Investments                     966       885      (8.4)
        - Power                         10             9     (2.5)
                                                                     Fixed Assets                   2,292     2,216     (3.3)
        - Others                           -           -      N/A
                                                                     Total Assets                   6,389     5,997     (6.1)
      DDA                               81         95       (14.3)
                                                                     Total Liabilities              5,046     4,709     (8.1)
      Gross Profit                     110        120          9.4
                                                                     • Loans                         932       506     (45.8)
      S, G & A                          35         43         25.8
      Operating Income                  75         76          1.8   • Capital Market Debts         2,384     2,171     (8.9)

      EBITDA                           171        159        (7.0)   • Other Liabilities            1,731     1,959      13.2
      Net Income                      (20)             5      N/A    Equity                         1,343     1,361       1.3

      Profitability Ratios (%)     Q1-20       Q1-21       YoY ∆%    Financial Ratios (x)         Q1-20     Q1-21     YoY ∆%
      Gross Margin                    39.6        39.9         0.7   Debt to Equity                   2.8       2.2    (23.1)
      Operating Margin                27.2        25.5       (6.2)   EBITDA to Interest               2.7       2.9       5.2
      EBITDA Margin                   61.7        52.8      (14.4)   Net Debt to EBITDA               3.7       3.1    (16.1)
      Net Income Margin               (7.2)        1.7        N/A    Net Leverage Ratio               3.7       3.1    (16.8)

     1) Includes restricted cash
14
FINANCIAL PERFORMANCE: EXCLUDING MEDCO POWER
     Profit & Loss (US$ M)                Q1-20      Q1-21       YoY ∆%      Balance Sheet (US$ mn)       Q1-20      Q1-21         YoY ∆%
     Revenue                                  254       278           9.7    Cash and cash equivalents1      662         426          (35.7)
      - Oil and gas                           215       276          28.5    Investments                     966         885           (8.4)
      - Others                                 39            3      (93.3)   Fixed Assets                   2,255      2,137           (5.2)
     DDA                                     (93)       (80)        (13.9)   Total Assets                   5,368      4,762          (11.3)
     Gross Profit                              95       107          13.0    Total Liabilities              4,198      3,661          (12.8)
     S, G & A                                (28)       (36)         29.3    • Loans                         369         230          (37.8)
     Operating Income                          67        71           6.2    • Capital Market Debts         2,254      2,035           (9.7)
     EBITDA (excl. asset held for sale)       161       152          (5.4)   • Other Liabilities            1,574      1,396          (11.3)
     Net Income                              (26)            5     (120.2)   Equity                         1,171      1,101           (6.0)

     Profitability Ratios (%)             Q1-20      Q1-21       YoY ∆%      Financial Ratios (x)           Q1-20      Q1-21         YoY ∆%

     Gross Margin                            37.4       38.5          3.0    Current Ratio                     2.7           1.6       (42.5)
                                                                             Debt to Equity                  2.529      2.161          (14.6)
     Operating Margin                        26.4       25.6         (3.2)
                                                                             EBITDA to Interest                2.9           3.2        10.8
     EBITDA Margin                           63.3       54.6        (13.8)
                                                                             Net Debt to EBITDA1               3.1           3.0        (0.9)
     Net Income Margin                      (10.1)       1.9       (118.4)   Net Leverage Ratio                3.0           3.0        (1.5)

      1) Includes restricted cash
15
2020 & 2021 GUIDANCE: PRODUCTION
         2020 Actual                                                                2019-2020 (mboepd)                          2021 Guidance (mboepd)

                                                                                 115
         •     Production 100 mboepd within revised                                                                                                      110
               guidance                                                                     103         100            101           95      100%
         •     Gas demand below TOPQ, below normal
               pre-COVID-19 levels
                                                                                                                                              26%
                                                                                  70
         2021 Guidance                                                                                                                                   70
                                                                                             64          60             63           57
     •       Q1-2021 Production 101 mboepd
                                                                                                                                              36%
     •       Revised 2021 guidance 95 mboepd
                •      Q2-2021 unplanned shut-downs in Aceh
                       and Vietnam, 2 – 3 mboepd
                •      Weak Gas demand in East Java, Aceh and                     45         39          40                                              40
                                                                                                                        38           38       39%
                       Singapore (LNG competition)
     •       Hedge puts of ~12% 2021 production, 1H-2021
             US$45/bbl, 2H-2021 ~US$50/bbl                                      2019 Pro    2019        2020          1Q 2021       2021   Indexed & Production
     •       Fixed price Gas contracts are a natural hedge                      Forma1                                            Guidance Fixed Gas Capacity2
                                                                                                                                          Composition
                                                                                  Liquids   Gas    Fixed Priced Gas     Indexed Priced Gas

     1)      Pro forma result assume Ophir consolidation from 1 January 2019
16   2)      Production capacity for gas is Maximum Daily Contracted Quantity
CONSOLIDATED CAPEX GUIDANCE
                     E&P Capex (US$ M)                                Power Capex (US$ M)
        Exploration                                   Others                     Solar PV
        Development Drilling                          Riau and Other IPP         Gross 100% Capex
        Equipment/Facilities                          Ijen Geothermal
                                             150
              144                                              123
                                              31                                                           65
              35                                                       60
                                                              1                                            6

                                              44
                                                                  19
              71                                                                                           25
                                                                            63

                                              75                  39

              38                                                                        5
                                   6                                                                       30
                                                                                    3
                               1       3                          5                         2       3       4
                               2                                                    1
             2020              1Q-21         2021             2020                  1Q-21                 2021
17
                                           Guidance                                                     Guidance
Operational Data
OIL AND GAS STATISTICS
                                                                                                       YoY
     Metrics                                                                 Q1-20 Q1-21               ∆%
                                                                                                                               Net 2P Reserves, MMBOE                     Net Contingent Resources, MMBOE

     Production2
                                                                                                                                                                                                  1,125
         Oil, MBOPD                                                               40.6       38.1        (6.2)                                                                 938
         Gas, MMSCFD                                                             325.4      336.4          3.4                 299                302
     Lifting/Sales
         Oil Lifting2, MBOPD                                                      38.8       36.7        (5.4)
         Gas Sales, BBTUPD                                                       306.2      317.9          3.8                 156                159
                                                                                                                                                                                                 1,016
         Oman Service Contract, MBOPD                                              7.9        7.5        (5.1)                                                                 838
     Average Realized Price
         Oil, USD/barrel                                                          51.3       58.8        14.4
                                                                                                                               143                143
         Gas, USD/MMBTU                                                            5.6        5.7         1.8
     ESG Indicators                                                                                                                                                            100                110
                             3
         Scope-1 Intensity (tCO2 eq/1,000 TOE Production)                        209.5      210.4          0.4            Q1-2020               Q1-2021                       Q1-2020            Q1-2021
         Energy Consumption3 (in million GJ)                                       4.5        4.6          2.9
         E&P Recordable Incident Rate (TRIR)                                      0.47       0.26       (44.7)       Net Hydrocarbon Production2, MBOEPD                 Net Hydrocarbon Production2, MBOEPD

                                                                                                                           101                    100%
     •        2020 5-year average 2P Reserves Replacement Ratio1 1.2x,                                                                                                                    103
                                                                                                                                                  27%                                            100       ~95
              2020 2P Reserves Life Index1 9.9 Years                                                                                                                    87          85
                                                                                                                               63
     •        Proved Developed Reserves are 86% of proved reserves                                                                                35%                                     64      60       ~57
                                                                                                                                                                        52         52
     •        2020 5-year 2P F&D1 cost US$10.2/boe
     •        Average realized gas price US$5.7/MMBTU; blend of fixed                                                          38                 38%                   35                39      40       ~38
                                                                                                                                                                                   33
              US$6.1/MMBTU and indexed US$5.1/MMBTU contracted                                                          Q1-2021                  Q1-2021               2017        2018   2019   2020     2021
              gas sales                                                                                                                        Indexed &                                                Guidance
                                                                                                                                                Fixed Gas
     •        Gas contracts underpinned by Take-or-Pay
                                                                                                                     Liquids         Gas   Fixed Priced Gas   Indexed Priced Gas

         1)   5-year average 2P Reserves Replacement Ratio, Reserves Life Index and F&D cost/boe as of 31 Dec 2020
19       2)   Includes Oman Service Contract
         3)   Energy consumption numbers are not audited and Q1-21 Scope-1 Intensity number are not yet audited
ASSET PORTFOLIO
       Indonesia Assets
                                   Participating                 Acreage   1Q21 Production
       Asset                                          Expiry                                          Operator                              Partner                   Type of Contract
                                     Interest                     (Km2)      (MBOEPD)
                                                                                                                                 Medco Daya Abadi Lestari 35%,
       South Natuna Sea Block B       40.0%           2028        11,155        20.1                MedcoEnergi                                                            PSC
                                                                                                                                      Prime Energy 25%
       Senoro-Toili                   30.0%           2027         451          21.1         JOB Pertamina – MedcoEnergi     Pertamina 50%, Mitsubishi & Kogas 20%       PSC JOB
       South Sumatra                  65.0%           2033        4,470          9.0                MedcoEnergi                    Medco Daya Makmur 35%                   PSC
       Rimau*                         60.0%           2043        1,103          4.6                MedcoEnergi            Bahtera Daya Makmur 35%, PDP&E Sumsel 5%        PSC
       Lematang                      100.0%           2027         409           2.6                MedcoEnergi                                -                           PSC
       Block A, Aceh                  85.0%           2031        1,681          6.4                MedcoEnergi                Medco Daya Energi Nusantara 15%             PSC
       Madura Offshore – Peluang                                                                                                        Petronas 22.5%,
                                      67.5%           2027         849           4.4                MedcoEnergi                                                            PSC
       and Maleo                                                                                                                  Petrogas Pantai Madura 10%
                                                                                                                               Singapore Petroleum Sampang 40%,
       Sampang                        45.0%           2027         534           3.0                MedcoEnergi                                                            PSC
                                                                                                                                     Cue Sampang Pty 15%
       Bangkanai – Kerendan           70.0%           2033        1,385          2.8                MedcoEnergi                        Saka Energi 30%                     PSC
       Tarakan*                      100.0%           2042         180           1.3                MedcoEnergi                                -                           PSC
       Madura Offshore – Meliwis      77.5%           2027         849           2.1                MedcoEnergi                         Petronas 22.5%                     PSC

       Simenggaris                    62.5%           2028         547           0.0         JOB Pertamina - MedcoEnergi               Pertamina 37.5%                   PSC JOB

       South Sokang                  100.0%           2040         998            -                 MedcoEnergi                                -                           PSC
       North Sokang                  100.0%           2040        1,124           -                 MedcoEnergi                                -                           PSC
       Bengara                       100.0%           2029         922            -                 MedcoEnergi                                -                           PSC
       West Bangkanai                 70.0%           2043        5,463           -                 MedcoEnergi                        Saka Energi 30%                     PSC

         Production        Development             Exploration

20   1) Rimau & Tarakan PSC contract extended for 20 years, will be converted from Cost Recovery to Gross Split after 2023 for Rimau and 2022 for Tarakan
ASSET PORTFOLIO
       International Assets

                                           Participating                       Acreage 1Q21 Production
         Country            Asset                               Expiry                                                  Operator                                       Partner                         Type of Contract
                                             Interest                           (Km2)    (MBOEPD)
        Vietnam       Chim Sao/Dua, 12W       31.9%              2030           1.395        4.6                       Premier Oil                            Premier 53.1%, PVEP 15%                        PSC

        Thailand          Bualuang            100.0%             2025            377         8.2                     MedcoEnergi                                          -                              Concession

                         Sinphuhorm            9.5%              2031            230         1.7                         PTTEP                        PTTEP 55%, APICO 35%, ExxonMobil 0.5%              Concession

                                                                                                                                                  Oman Oil Company 25%, Kuwait Energy 7.5%, Vision
         Oman         Karim Small Fields      58.5%              2040            781         7.5                     MedcoEnergi                                                                       Service Contract
                                                                                                                                                             Oil&Gas 5%, PetroVest 4%
                                                                                                                                                  Calvalley Petroleoum Ltd 42.5%, Hood Oil Ltd 21.3%
         Yemen          Block 9 Malik         21.3%              2030           4,728        1.5                Calvalley Petroleoum Ltd.                                                                   PSA
                                                                                                                                                                     YOGC 15%
        Tanzania        Blocks 1 and 4        20.0%              2020           12,296        -                           Shell                            Shell 60%, Pavilion Energy 20%                    PSC
                                                                                                          Nafusah Oil Operation B.V. (owned by
          Libya
                                                                                                             National Oil Corporation 51%,                  National Oil Corporation 50%,
                           Area 47            25.0%              2045           6,182         -                                                                                                            EPSA IV
                                                                                                         MedcoEnergi 24.5% and Libya Investment            Libya Investment Authority 25%
                                                                                                                   Authority 24.5%)
                                                                5 years
                                                             exploration;
                           Area 47            50.0%                             6,182         -                      MedcoEnergi                           Libya Investment Authority 50%                  EPSA IV
                                                               25 years
                                                              production
                                                           2020 exploration,
         Oman             Block 56            50.0%            20 years         5,808         -                      MedcoEnergi                            Intaj LLC 25%, Biyaq LLC 25%                     PSC
                                                              production
         Mexico           Block 10            20.0%              2053           1,999         -                          Repsol                               Repsol 40%, Petronas 40%                       PSC
                          Block 12            20.0%              2053           3,099         -                         Petronas                              Petronas 60%, PTTEP 20%                        PSC
        Malaysia        Block PM322           85.0%              2020           20,000        -                      MedcoEnergi                                Petronas Carigali 15%                        PSC

         Production        Development          Exploration

21   1) Rimau & Tarakan PSC contract extended for 20 years, will be converted from Cost Recovery to Gross Split after 2023 for Rimau and 2022 for Tarakan
RESERVES AND RESOURCES (AS OF MAR 2021)
                                                                 PROVED RESERVES                PROVED&PROBABLE RESERVES                    CONTINGENT RESOURCES
                                                             Oil       Gas      Total             Oil     Gas      Total                   Oil      Gas      Total
                                                           mbbls       mmscf         mboe       mbbls          mmscf         mboe       mbbls       mmscf       mboe
     Domestic
     West Indonesia                                          19,103        322,289    77,848     37,698         401,154      111,035       28,403   1,261,438    255,837
     East and Central Indonesia                               7,652        347,456    73,846      9,790         374,576       80,857       26,707   1,279,382    268,820
     Total Domestic                                          26,756        669,744   151,694     47,488         775,730      191,892       55,110   2,540,820    524,657
     International
     International Assets                                    57,194         62,692    67,872     96,003          84,900      110,392       54,481   3,154,051    600,769

     Total International                                     57,194         62,692    67,872     96,003          84,900      110,392       54,481   3,154,051    600,769
     Grand Total                                             83,950     732,437       219,566   143,491         860,630       302,285   109,591     5,694,872   1,125,427
                                                            #REF!      #REF!         #REF!      #REF!          #REF!         #REF!      #REF!       #REF!       #REF!
     Domestic Proved Developed Reserves                      22,669     532,597       122,601   #REF!          #REF!         #REF!      #REF!       #REF!       #REF!
     International Proved Developed Reserves                 57,156      49,994        65,620   #REF!          #REF!         #REF!      #REF!       #REF!       #REF!
     Total Proved Developed Reserves                         79,825        582,591   188,221    #REF!          #REF!         #REF!      #REF!       #REF!       #REF!

      2020 2P Reserves Life Index (RLI)              2020 2P Reserves Replacement Ratio (RRR)                       2020 2P Finding and Development Cost

      Years                                    9.9        5-Year Average                                1.2x              5-Year Average                    US$ 10.2/boe

22
ACTIVE GAS CONTRACTS (1)
         Source                Customer                        WI%             Agreement Date               Commitments                                                                                      Length/Expiry

     1 Block B                SembGas Singapore               40%                 15-Jan-99                Total contract quantity of 2,625 TBTU                                                               15-Jul-28
                                                                                                           Total contract quantity of 1,648 TBTU, New TCQ 1,813 TBTU, Additional 165 TBtu triggered
     2 Block B                Petronas Malaysia               40%                 28-Mar-01                as per GSA, Petronas Block B – Duration extension and larger TCQ triggered as per terms             1-Aug-22
                                                                                                           of the GSA. Other terms remains the same.
                                                                                                           10.8 – 11.6 BBTUD of gas with total gas contract quantity of 12,805.3 BBTU (Total joint
     3 Lematang               Meppogen                        100%                17-Oct-19                                                                                                                    31-Dec-27
                                                                                                           supply contact quantity 40,136.2 BBTU – as per Amendment ARGSA)
                                                                                                           9.7 - 14.2 BBTUD of gas with total gas contract quantity of 27,330.9 BBTU (Total joint supply
     4 South Sumatra Block    Meppogen                        65%                 17-Oct-19                                                                                                                    31-Dec-27
                                                                                                           contact quantity 40,136.2 BBTU – as per Amendment ARGSA)
                                                                                                           25 BBTUD ramp down to 20 BBTUD of gas (joint contract between SSB-Lematang) with
     5 Lematang & SSB*        PLN South Sumatera              100%                19-Sep-17                total contract quantity of 19,327 BBTU from Lematang PSC & 50,932.8 BBTU from SSB (Total            31-Jan-27
                                                                                                           joint supply contract quantity 70,260 BBTU).
                                                                                                           30 BBTUD of gas ramp down to 20 BBTUD (joint contract between SSB-Lematang) to PGN
     6 Lematang & SSB*        PGN                             100%                 11-Jul-19               with total contract quantity of 16,440 BBTU from Lematang PSC & 10,960 BBTU from SSB                31-Dec-21
                                                                                                           (Total joint supply contract quantity 27,400 BBTU)
     7 South Sumatra Block    Mitra Energi Buana              65%                  8-Jun-18                Total contract quantity of 30,119 BBTU                                                              31-Dec-27
     8 South Sumatra Block    MEPR JATA                       65%                  2-Dec-20                Total contract quantity of 9,015 BBTU for own use                                                   31-Dec-27
     9 South Sumatra Block    Perusda Mura Energi             65%                  9-Aug-18                1.35 BBTUD of gas with total contract quantity of 6,039 BBTU of gas                                 31-Dec-27
     10 South Sumatra Block   PDPDE BBG                       65%                  4-Jul-19                0.5 BBTUD of gas with total contract quantity of 1,606.5 BBTU                                        7-Feb-23
                                                                                                                                                                                                                8-Sep-20
     11 South Sumatra Block   Pertamina (Jargas palembang)    65%                  31-Jul-19               Supply gas of 0.20 MMSCFD with total contract quantity of 123.40 MMSCF                          (Transferred to the
                                                                                                                                                                                                             contract below)
                                                                                   5-Oct-20
     12 South Sumatra Block   PGN (Jargas Palembang)          65%                                          Supply gas of 0.40 MMSCFD with total contract quantity of 1,931.6 MMSCF                             27-Nov-33
                                                                      (KB, on process of Amendment KB)
                                                                                                           Supply gas to meet the needs of households in Kabupaten Musi Banyuasin of 0.25 BBTUD
     13 South Sumatra Block   PGN (Jargas MUBA )              65%                 4-May-18                                                                                                                     20-Jul-27
                                                                                                           with total contract quantity of 871 BBTU.
     14 South Sumatra Block   Pertamina (Jargas Muara Enim)   65%                 15-Nov-19                Supply gas of 0.25 MMSCFD with total contract quantity of 855.25 MMSCF                              20-Jul-27
                                                                     17-Oct-14 (on process of Amendment –
     15 Simenggaris           PLN                             63%                                         0.5 MMSCFD with total contract quantity of 805 MMSCF.                                                30-Nov-25
                                                                            signed KB on 30-Nov-20)
     16 Simenggaris           PLN                             63%                  6-Feb-18                8 BBTUD of gas with total contract quantity of 21.6 TBTU.                                           23-Feb-28
     17 Simenggaris           PT Kayan LNG Nusantara          63%                 20-May-20                12 – 22 MMSCFD daily with Total Contract Quantity (“TCQ”) of 47,091 MMSCF                           23-Feb-28
     18 Tarakan               PLN Gunung Belah                100%                16-Jan-18                Total contract quantity of 10,134 BBTU                                                              31-Dec-21
     19 Tarakan               PGN                             100%     30-Oct-18 (signed KB on 5-Oct-20)   0.30 MMSCFD of gas for household in Tarakan                                                         13-Jan-22
23   20 Senoro-Toili          DS-LNG                          30%                 13-Dec-10                277.8 BBTUD (equivalent to 250 MMSCFD) of gas                                                       3-Dec-27
ACTIVE GAS CONTRACTS (2)
                                                                Agreement
          Source                   Customer            WI%                       Commitments                                                                                                           Length/Expiry
                                                                  Date
     21 Senoro-Toili              PAU                  30%       11-Jan-18     Total contract quantity of 248,200 MMSCF                                                                                  3-Dec-27
     22 Senoro-Toili              PLN                  30%        6-Feb-18     5 BBTUD of gas with total contract quantity of 15.63 TBTU.                                                                3-Dec-27
     23 Block A                   PT Pertagas Niaga    85%      2-Oct-20     54 BBTUD of gas with total contract quantity of 198 TBTU.                                                                  31-Aug-31
                                                             28-Jan-11 (KB
     24 Bangkanai                 PLN                  70% signed on 20-Dec- 20 BBTUD of gas with Total Contract Quantity of 130,000 BBTU                                                               29-Dec-33
                                                                  2019)
                                                                             To supply gas pursuant to Minister of Energy and Mineral Decree No.1790K/2018 (gas allocation for electricity) up to 31
     25 Sampang- Oyong            PT Indonesia Power   45%     19-Jul-03                                                                                                                                31-Dec-22
                                                                             December 2022
     26 Sampang - Wortel          PT Indonesia Power   45%     26-Nov-10     23-17 BBTUD of gas up to maximum contract quantity of 124 TBTU or 31 December 2022, whichever occurs earlier.              31-Dec-22

     27 Madura Offshore - Maleo   PGN                  68%       31-May-05     15-20 BBTUD of gas up to maximum contract quantity of 27.04TBTU or 31 December 2023, whichever occurs earlier.           31-Dec-23

     28 Madura Offshore – Peluang PLN                  68%       15-May-13     Up to maximum contract 62.8TBTU 31 December 2021, whichever occurs earlier.                                              31-Dec-21

     29 Madura Offshore - Meliwis PGN                  78%       19-Feb-19     20.3 BBTUD of gas up to maximum contract quantity of 22.8 TBTU or 31 August 2023, whichever occurs earlier.              31-Aug-23

24
SIMPLIFIED FUNDS FLOW STRUCTURE

25
Debt Info
DEBT MATURITY PROFILE: BULLET VS INSTALLMENT AS AT MAR 2021
               Restricted Group Debt (US$ mn)                                                            Medco Power Debt (US$ mn)
                                                                    649       645
                                                                                       Bullet Payments
                                                                                       Instalment
               Include fund in Escrow
                                                        525

                                                                                                                                          194

                                                                                       82
         55*                        167                                                             77
               148
         67           103               95                                             50
                                                                                                    57        37
                       68                    53                                                                            27
                                              0                                                               30
         81                             72                                             32                            6     21      6
                       35                    52                                                     19
                                                                                                              8     6 0    6      6 1
        2021          2022          2023     2024      2025        2026       2027    2021          2022     2023   2024   2025   2026    2027
                                                                            onwards                                                      Onwards

27   *) US$55mn before escrow account for bullet payment,
        all data above excludes unamortized cost and includes derivatives
Medco Power Indonesia
MEDCO POWER STATISTICS
                                                                                YoY
       Metricsº                                               Q1-20 Q1-21 ∆%                                                    Gross Installed Capacity, MW

      IPP Sold and O&M Capacity                                                                          IPP                 O&M
        IPP Sold, GWh                                             694     666    (4.0)                 2,788                                2,788                                    2,904
            Renewables, GWh                                       236     217    (8.1)
                                                                                                        638                                    638
            Non Renewables, GWh                                   458     450    (1.7)                                                                                               939
        O&M Capacity, MW
                                                                                                       2,150                                2,150                                 1,965
      Average Realized Price*

        IPP, Cent/kwh                                              4.1    4.1     0.0
                                                                                                       2019                                    2020                         2021 Guidance
      ESG Indicators
                                                                                         Note: Decrease in O&M installed capacity due to contract expiry of Mobile Power Plant in 2021.
                                       1
        Scope-1 GHG Intensity (tCO2 eq/MWh)                       0.51   0.54     5.9
        Power Recordable Incident Rate (TRIR)                     0.75   0.00    N/A                   O&M Power Capacity                                              IPP Power Sold
                                                                                                        Gross 100%, MW                                                Gross 100%, GWh
        °Gross 100% interest and includes geothermal production
        *Excludes Fuel Component
                                                                                                                                                                                                      2,900
                                                                                                                                                                   2,704      2,600          2,639
                                                                                                     2,174
     • Riau IPP construction 97% complete and                                            1,820
                                                                                                                2,150      2,150
                                                                                                                                       1,965           2,174        843
                                                                                                                                                                                                       895
                                                                                                      330        330        330                                                802           817
       on track for place in service Q4-2021                                              330
                                                                                                                                        330             356

     • Ijen Geothermal 3 steam exploration wells                                                     1,844      1,820      1,820                                                                      2,105
                                                                                         1,490                                         1,635           1,818       1,861      1,798          1,822
       being appraised
     • Construction 16% complete on the                                                   2017       2018       2019        2020      2021              2017       2018       2019           2020      2021
       26MWp PV facility in Sumbawa                                                                                                 Guidance                                                         Guidance
                                                                                                          Renewables O&M        O&M                                 Renewables IPP         IPP
29
     1) Q1-21 Scope-1 Intensity number are not yet audited
MEDCO POWER INDONESIA: BUSINESS OVERVIEW
     Focusing on clean and renewable power business

                                                                 638 MW Gross Operating Asset
                                                                 2,150 MW Gross O&M business
               BUSINESS STRATEGY                                                       BUSINESS ENVIRONMENT

               • Clean energy, primarily gas and geothermal assets                     • Contracts are Long Term (20-30 years), Take-or-Pay sales to PLN. PLN
                                                                                         is the single buyer of electricity from various IPPs. PLN also develops
                                                                                         and operates its own power plants
               • Focus on Western Indonesia (access to gas and geothermal resource),
                 also selectively looking for opportunities in Central and Eastern     • Indonesia commitments to International targets to grow clean energy
                 Indonesia                                                               electricity capacity

               • Focus on medium sized power plants (100 - 500MW capacity) and         • Capitalize on regulations to encourage turn-key power generation from
                 selectively larger power plants                                         gas producers

               • Expand the O&M services business                                      • Regional costs of generation as a benchmark for renewable energy
                                                                                         prices
               • Extract greater synergies within MEI Group
30
ASSET PORTFOLIO: LARGE FOOTPRINT IN KEY MARKETS
                                           Gas 75 MW (O&M) -
                                                                                          MEB Gas 85 MW
                                           Duri
                                                                                          Batam Island                                3,300 MW capacity
                                      Gas 75 MW
                                                                                          DEB Gas 85 MW
                                                                                                                                  of IPP and O&M Portfolio
                                      (O&M)
                                      Paya Pasir                                          Batam Island
                         Sarulla Geothermal
                                                                                          TM2500 Gas 20 MW
                                                                                                                                                       IPP
                         330 MW
          Gas to Power   North Sumatera                                                   Batam Island                                                 O&M
                                                                                          ELB Gas 76 MW
                                                                                          Batam Island

                                                                                                                         Gas 100 MW (O&M)
                                                               Riau CCPP
                                                                                                                         Pontianak
                                                               275 MW
                          Sarulla                              Riau
                          Geothermal
             O&M          330 MW (O&M)
                                                                                                                 Sulut-1 100 MW
                          North Sumatera                                                                                                     Luwuk Gas 40 MW
                                                                                                                 (O&M)
                                                                                                                                             (O&M)
                                                                                                                                             Luwuk

                                                                                                                  TJBPS Coal 1320 MW (O&M)
                         Gas 25 MW (O&M)                                                                          Central Java
                         Nias Island
          Geothermal                                                          Gas 50 & 25 MW (O&M)                Ijen Geothermal 110 MW
                                                                              Bangka - Belitung                   East Java
                                                                                                                        Gas 50 MW (O&M)
                                                                                                                        Lombok

                              EPE Gas 12 MW                                                                                 Timor-1 100 MW
                                                                 Gas 100 MW                BJI Mini Hydro 9 MW
                              South Sumatera                                                                                (O&M)
                                                                 (O&M)                     West Java
                                                                 Lampung
          Renewables         MPE Gas 12 MW                                                 PPP Mini Hydro 9 MW
                             South Sumatera                                                West Java

31
SARULLA GEOTHERMAL POWER OPERATION
     The largest single-contract geothermal power operation in the world
                                    Sponsors
      PT Medco Power Indonesia   19.00%
      INPEX                      18.25%                      • Phase 1: 110MW, COD in March 2017, Phase 2 and 3 in
      Itochu                     25.00%
      Kyushu Electric Power Co   25.00%                        October 2017 and May 2018. Total contracted capacity of
      Ormat                      12.75%
                                                               330MW
                                                             • 30 years Energy Sales Contract with PLN with Take or Pay
                                                               90% capacity factor. MPI provides plant O&M
                                                             • Investment cost of US$1.7 billion, project financing with
                                                               JBIC, ADB, and 6 commercial banks

32
RIAU COMBINED CYCLE POWER PROJECT
     Construction started in November 2018, COD expected by 2021

                                                          • Located in Pekanbaru, Riau, Central Sumatera
                                                          • Combined Cycle Gas Power Plant with a total capacity
                                                            of 275MW (COD in 2021)
                                                          • Project Finance by a consortium of international banks
                                                            and achieved Financial Close in November 2019
                                                          • 20 year PPA with PLN
                                                          • Investment cost ~US$290 million

     PT Medco Power Indonesia             51%
     RATCH Group Public Company Limited   49%

33
IJEN GEOTHERMAL AND SUMBAWA SOLAR PV PROJECTS
     Medco Power Indonesia   51%
     Ormat                   49%   Ijen Geothermal
                                   • Located in Ijen, Blawan, East Java.
                                   • Geothermal Power Plan with a capacity of 110MW,
                                      target COD by 2022 – 2023.
                                   • Electricity Sales and Purchase Agreement (PJBTL)
                                      with PT PLN (Persero) for a period of 30 years.
                                   • Well testing on the first two wells, drilling in progress
                                      on the third well.

                                   Sumbawa Solar PV
                                   • Located in Sumbawa, West Nusa Tenggara.
                                   • Developing 26MWp Solar Photovoltaic power plant.
                                   • In progress on detailed engineering design and earth
                                     work.
                                   • Target COD by 2021.

     Ijen Geothermal
34
Amman Mineral Nusa Tenggara
AMMAN  MINERAL
        Amman           STATISTICS
              Mineral Nusa Tenggara
                                                   YoY
         Metrics                 Q1-20    Q1-21    ∆%
                                                                  Copper Gross Reserves & Resources (Mlbs)                           Gold Gross Reserves & Resources (koz)

     Production
         Copper, Mlbs              44.9     48.4      7.9          Batu Hijau           Elang                                                                         15,140
                                                                                                                                      Batu Hijau     Elang
         Gold, koz                 15.9     27.1     70.2                                                       16,650
     Sales
         Copper, Mlbs              32.9     34.5      4.9                                                                                9,190
         Gold, koz                 12.3     21.8     77.0                 7,380                                                                                       31,800
                                                                                                                21,350
     Average Realized Price                                                                                                              15,000
                                                                         10,400
         Copper, USD/lbs           2.52     3.68     45.7
         Gold, USD/oz             1,592    1,828     14.8              Reserves                             Resources                  Reserves                  Resources
                                                                   Note: Reserves and Resources as at 31 December 2020

     •     Phase 7 producing pit ore, remains
           on-track to hit the high-grade ore in                             Copper Production (Mlbs)                                         Gold Production (koz)

           Q4-21
     •     Phase 8 development waste removal
           in progress
     •     Export permit renewed for 579,444                512                                                                        801
                                                                      478
           Wet Metric Ton (WMT)                                                                                               697
                                                                                  288                          294
     •     Smelter EPC on track for award in                                                                                                  398
                                                                                           142       130
           Q4-2021                                                                                                       48                            71     56
                                                                                                                                                                        132
                                                                                                                                                                               27
                                                            2015      2016      2017      2018      2019       2020 1Q-2021   2015     2016   2017    2018   2019      2020 1Q-2021
36
Amman Mineral Nusa Tenggara: Phased Mining Developments
     World-class Copper and Gold Mining operations with long-term upside

                                                 •   Indonesia’s second largest copper concentrate producer with over 20
                                                     years of successful mining operation
                                                 •   Batu Hijau copper and gold mine mine is located on the island of
                                                     Sumbawa, West Nusa Tenggara
                                                 •   Full development of Phase 7 began in 2018
                                                 •   Developing on-site copper smelter
                                                 •   Long established relationship with blue chip customers including PT
                                                     Smelting (Indonesia), LS-Nikko (South Korea), Mitsubishi Materials
                                                     (Japan), PASAR (Philippines) and Trafigura Beheer (the Netherlands)
                                                 •   Elang block is located 62km east of Batu Hijau

37
PT Medco Energi Internasional Tbk
The Energy Building 53rd Floor
SCBD Lot 11A
Jl. Jend. Sudirman, Jakarta 12190
Indonesia
P. +62-21 2995 3000
F. +62-21 2995 3001

Website : www.medcoenergi.com
You can also read