2016 MINISTRY OF EDUCATION - Statistics Report - NET
←
→
Page content transcription
If your browser does not render page correctly, please read the page content below
Government of the Cook Islands

     2016

                    MINISTRY OF EDUCATION
                            Statistics Report
E akapapaa’nga
teia ei tauturu i te
akamarama’anga i
te kaveinga no te
 turanga apii Kuki
      Airani.

                       1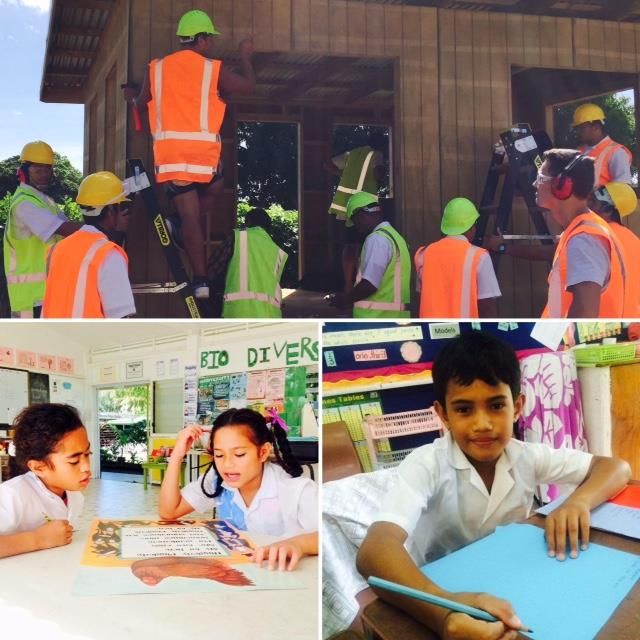
CONTENTS

FOREWORD .............................................................................................. 3

ACKNOWLEDGEMENT ................................................................................... 3

INTRODUCTION .......................................................................................... 3

EDUCATION AT A GLANCE IN THE COOK ISLANDS 2016 ............................................... 4

STRUCTURE OF THE EDUCATION SYSTEM .............................................................. 6

EARLY CHILDHOOD EDUCATION ........................................................................ 8

PRIMARY EDUCATION .................................................................................. 11

PRIMARY - NUMERACY AND LITERACY .............................................................................. 14
PRIMARY NUMERACY ................................................................................................ 14
PRIMACY LITERACY ................................................................................................... 15

SECONDARY EDUCATION ............................................................................... 17

SENIOR SECONDARY STUDENT RETENTION ......................................................................... 20
NATIONAL CERTIFICATE OF EDUCATIONAL ACHIEVEMENT (NCEA) ............................................... 20
SECONDARY LITERACY ................................................................................................ 23
SECONDARY NUMERACY ............................................................................................. 23
NATIONAL CERTIFICATE of EDUCATIONAL ACHIEVEMENT ENDORSEMENTS .................................... 24

INCLUSIVE EDUCATION ................................................................................. 27

SCHOLARSHIPS .......................................................................................... 27

TERTIARY EDUCATION .................................................................................. 28

TEACHER QUALIFICATIONS ............................................................................. 29

MINISTRY OF EDUCATION BUDGET .................................................................... 30

APPENDICES ............................................................................................. 32

Appendix 1: Schools in the Cook Islands - by Region, Island, Status and Education Level ........................ 32
Appendix 2: 2016 Enrolment by Region School and Level.......................................................... 33
Appendix 3: 2016 Enrolments by Age and Level .................................................................... 34
Appendix 4: 2007 – 2016 Enrolments by Level ...................................................................... 35
Appendix 5: 2016 School Teachers and Staff by Region ............................................................ 36

                                                                                                                          2
FOREWORD
I am pleased to introduce the 2016 edition of the Cook Islands Ministry of Education Statistics Report. This series aims
to inform our policy development and guide initiatives that focus on strengthening, supporting and sustaining quality
education in the Cook Islands.
This report covers student outcomes for the 2015 academic year and 2016 enrolment and participation data. Other
sections of the report include finance and programme based data.
The Cook Islands Education Statistics report is available to all our stakeholders to advance broader understanding of
the educational outcomes and factors affecting the outcomes for learners in the Cook Islands.
We sincerely hope that such data and information proves useful to researchers, policy-makers, those who provide
services and support, and to the community at large.
Meitaki Maata.

Gail Townsend
Secretary of Education

ACKNOWLEDGEMENT
The Ministry of Education acknowledges the contributions made by all the schools, providers, ministry divisions,
regional and international agencies who supported the collection and analysis of data of the Education Statistics
Report 2016, an annual publication.

INTRODUCTION
Kia Orana and welcome to the Cook Islands Ministry of Education Statistics Report 2016.

It is the aim of the Ministry of Education to provide all stakeholders as well as national, regional and international
partners with quality educational statistics.

Information in this report is produced from the Education Management Information System and is supported by data
provided by other divisions within the Ministry of Education. Data for this report are collected annually from schools
and the Cook Islands Tertiary Training Institute.

Data are provided for the current year and as a five year time series where appropriate. Student assessment and the
National Certificate of Educational Achievement (NCEA) data is provided for the previous year. Fiscal information is
expressed in line with the financial year.

Should you require any further information, please do not hesitate to contact the Planning and Development Division
of the Ministry of Education. A copy of this publication is also available on the Ministry of Education’s website:
www.education.gov.ck

Danielle Cochrane                                   Maria Enetama
Director                                            Monitoring and Evaluation Officer
Planning & Development Division                     Planning & Development Division
Ministry of Education                               Ministry of Education
dcochrane@education.gov.ck                          maria@education.gov.ck

Photo credit: Carly Ave - cover and back page. Emina Tararo - cover page (top).

                                                                                                                       3
EDUCATION AT A GLANCE IN THE COOK ISLANDS 2016

                                                 4
Table 01: At a Glance Data
Net Enrolment Rates (%):
Early Childhood Primary Education Junior Secondary Senior Secondary
Education Education Education
Male 94 100 90 56
Female 100 100 88 69
Overall 97 100 89 62
Gross Enrolment Rates (%):
Male 96 108 97 62
Female 102 105 94 77
Overall 99 106 95 69
Early Childhood Primary Education Secondary Total
Education Education
Number of Teachers:
Male 0 10 51 61
Female 32 97 74 203
Overall 32 107 125 264
Number of Schools:
25 11 4 14 Area Schools
1 Stand-alone
10 Attached to
Primary Schools
14 Attached to
Area Schools
Figure 01: 2015/2016 Education Budget for Schools
12%
20%
38%
30%
ECE Primary Junior Secondary Senior Secondary
5STRUCTURE OF THE EDUCATION SYSTEM
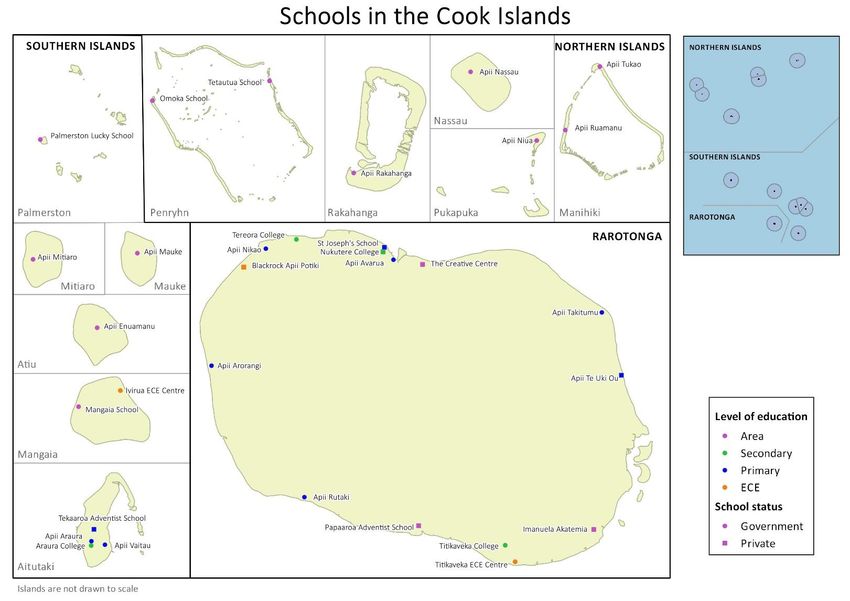
Education in the Cook Islands is mainly provided by government institutions. There are 31 providers including 1 stand-
alone ECE Centre, 11 Primary Schools (10 of which have ECE Centres attached), 4 Secondary Schools, 14 Area Schools1
(all with ECE Centres) and a Tertiary institute.
Figure 02: Map of Schools in the Cook Islands
In the Cook Islands Maori language, the word Apii means School. Other useful terms include;
Akakoukouanaga - summary Paunuanga - evaluation
Akakoroanga - aim Revera - levels
Akameitakianga - acknowledgement Tamariki - children
Apii Potiki - Early Childhood/ Pre-school Tamanakoanga - suggestions
apii - to teach, learn, practice tamou - to learn
Pa Enua - Outer Islands Tauira - Student, Pupil
Pa Enua Tokerau - Northern Group Islands Tuatua - Talk, say, speak, converse
Pa Enua Tonga - Southern Group Islands Vaitoanga Kite - assessment
Pu’apii - Teacher
1
An Area School is a school that provides education from Early Childhood through to secondary level on one site and under one
management structure.
6Figure 03: Cook Islands Education System
All 8 private schools, made up of 5 Church and 3 Independent schools, receive 100% of the equivalent allocation to
government schools from the national education budget, for teachers and operational budget, based on their
enrolment. All Government and Private Schools are required to be open to both educational and financial audit.
Governance of Public Schools sits with the Ministry of Education. However, each school has its own stakeholder
committee which makes decisions on individual school policy, strategic plans and annual goals. Governance of Private
Schools sits with a School Board.
The Cook Islands Tertiary Training Institute (CITTI), established in 2013 provides full and part time vocational
programmes and a wide range of community education courses in Rarotonga and the Pa Enua.
7EARLY CHILDHOOD EDUCATION
Quality Early Childhood Education (ECE) continues to be a priority for the Ministry. Significant investment in teacher
professional development and upgrading of teacher qualifications support this. There is pay parity for ECE teachers
with teachers of other sub-sectors of education.
All Centre’s follow a Play Based curriculum that encourages learning through play. This curriculum focuses on identity,
inquiry and involvement. The skills this curriculum develops in the very young establish a base for positive educational
outcomes in formal schooling. Parents and the community have an important role to play in this development and the
Ministry supports parents in this role.
The following strategies are currently in place and are supporting the continued development of quality ECE:
a. ECE specific media campaigns to promote attendance and increase enrolment in ECE.
b. Tertiary level qualifications are actively supported in ECE specific studies for teachers.
c. Significant resourcing budget that is specific to the requirements of ECE needs, with a focus on personnel and resources.
d. Te Kakaia Programme – Ongoing support offered to parents and families, in their role as the first teachers of their
children, continues. This programme is particularly targeted at families with children from 0-3 years, but does however
support all age groups. Te Kakaia promotes positive parenting through the use of resources for parents, strategies and
community based workshops, in conjunction with other agencies.
The Community Home Garden
Project, a recent initiative in
collaboration with the Ministries of
Agriculture, Health and Education,
grew out of the Edible Gardens
Project that started in ECE Centres
10 years ago. The project has
provided families with simple but
practical steps to start and maintain
their own home gardens.
8Figure 04: Enrolment Rates in Early Childhood Education
2012-2016
97 98 97 99
100 90 91
84
79 78 78
80
Enrolment (%)
60
40
20
0
2012 2013 2014 2015 2016
Year
NER in ECE GER in ECE
9Figure 05: Early Childhood Education Teachers Nationally and
by Region 2012 - 2016
80
70 34 33 33 32
60 31
Number of Teachers
50
40
5 4 5 5
30 9 8 6
8 8
6
20 20 21 20 19 19
10
0
2012 2013 2014 2015 2016
Year
Rarotonga Southern Group Northern Group National
Figure 06: ECE Student : Teacher National Ratio Nationally and by
Region 2012 - 2016
25
20
Students per Teacher
15
10
5
0
2012 2013 2014 2015 2016
Year
Rarotonga Southern Group Northern Group National
10PRIMARY EDUCATION
Equitable access to quality learning and the strengthening of Cook Islands Maori language and culture continue to be a
focus for Primary Education in the Cook Islands. Significant investment in reading resources and professional support
in reading frameworks for teachers remains central to ensuring quality learning opportunities that meet individual needs
and celebrate our learners’ talents.
The current priorities for the Ministry of Education in supporting sustained progress of primary education include:
a) Ongoing professional development of teachers and qualification upgrade programmes
b) Implementation of the ITC integration Plan 2016-2018 with a focus on Years 4 - 6
c) Upgrade of classroom Infrastructure in Years 1 - 3 to underpin the Ministry’s commitment to foundation
years.
d) Pacific Literacy and School Leadership Programme in Years 1 - 3 - With specific support through writing
frameworks and resource development
11Figure 08: Primary Eduction Enrolment by Region
2012 - 2016
3000 2,000
1,900
2500 1,875
1,858
1,843
Total National Number of Students
Number of Students by Region
1,793 1,789 1,800
2000
1,700
197 169 159
171 168
1500 445 434 429 1,600
434 422
1,500
1000
1,400
1,233 1,188 1,240 1,199 1,270
500
1,300
0 1,200
2012 2013 2014 2015 2016
Year
Rarotonga Southern Group Northern Group National
Figure 09: Primary Education Teachers Nationally and by Region
2012-2016
120
111 111
106 107
104
100
Number of Teachers
80
71 71
67 66 67
60
40
27 27 25 26
24
20
16 14
12 13 13
0
2012 2013 2014 2015 2016
Year
Rarotonga Southern Group Northern Group National
12Figure 10: Primary Education Student: Teacher Ratio
Nationally and by Region 2012 - 2016
20
18
16
Students per Teacher
14
12
10
8
6
4
2
0
2012 2013 2014 2015 2016
Year
Rarotonga Southern Group Northern Group National
Table 04: 2016 Primary Education Teachers by Gender and Region 91% of the primary teaching
cohort in the Cook Islands is
Southern Northern female.
Gender Rarotonga National
Group Group
Male 6 2 2 10 80% of all primary school
Female 61 24 12 97 Principals are female (not
Total 67 26 14 107 including area schools).
13PRIMARY - NUMERACY AND LITERACY
Improved numeracy and literacy outcomes for all learners are key goals for the Ministry of Education and relate to many
targets of the Education Master Plan Learning for Life. The Ministry of Education is ensuring that both financial and
professional support are provided to achieve these goals. Student outcomes are tracked against medium and long term
targets.
Increased primary school achievement in Maori Literacy is being maintained. Primary School Literacy and Numeracy
results also demonstrate the effectiveness of targeted professional development programmes.
PRIMARY NUMERACY
The National monitoring of Year 3 numeracy for the past 4 years indicates students are achieving above the annual
targets with the exception of 2015. The 2015 National Year 3 numeracy of 70% was not achieved. However, the 68%
success rate does indicate progression in students’ achievements, as well as highlighting areas for continual professional
development. Ongoing support and professional dialogue around numeracy continues as part of the core work of the
Curriculum & Pedagogy team in the Learning and Teaching division, with this focus in mind.
The tables below show the overall Year 3 numeracy progress against 2019 targets and national achievement.
Figure 11: National Year 3 Numeracy Progress against
the 2019 Target
Numeracy Progress Numeracy Target
100
Numeracy Progress (%)
80
60
40
20
0
2012 2013 2014 2015 2016 2017 2018 2019
Year
Figure 12: Year 3 National Numeracy Achievement (%) by
Student Achievements (%)
Region 2011 - 2015
100
90
80
70
60
50
40
30
20
10
0
2011 2012 2013 2014 2015
Rarotonga 75 74 77 74 69
Southern Group 54 69 68 64 70
Northern Group 59 54 95 52 50
National 68 71 76 69 68
Year
14PRIMACY LITERACY
An increase in primary school literacy will lead to a literate adult population. There has been a focus on literacy in both
English and Maori language since 2002, with the introduction of specific advisors initially in reading and more recently
in literacy. This focus includes both Cook Islands Maori and English and since 2013 the Ministry has been differentiating
funding for schools to provide an additional incentive to their Maori language literacy programmes.
Activities developed under these programmes include:
a. The continuation of the Pacific Literacy and School Leadership Programme – A new writing framework for primary
students has been developed.
b. A promotional campaign for Maori language and cultural heritage - A cross-agency collaboration with the Ministry of
Culture. The Tateni Atu Korero speech competition, signifies the importance of sector-wide partnerships.
c. Maori language and culture resource development - Publishing of new titles for Years 1-3, including reading books to
support the new writing framework for primary students. Reprints in other Cook Islands dialects have been published,
together with Big Book readers in Cook Islands Maori.
d. Books in Homes Project - Promoting the value in reading books at home with families.
Literacy in the primary school has been measured using different instruments over time. Between 1999 and 2006 formal
diagnostic testing at Grade 4 and 6, using a standard test paper from the Ministry, was used to monitor literacy in both
Cook Islands Maori and English. In 2007, this changed to the use of evidence gathered by teachers over the year using
newly developed instruments. This was reported to the Ministry against agreed standards and levels annually.
The figures below show the overall Year 4 literacy progress against 2019 targets, for both Cook Islands Maori and
English.
Figure 13: National Year 4 Maori Literacy
Progress against the 2019 Target
Literacy Progress Literacy Target
100
Student Achievements (%)
In 2012, a large number of
80
schools shifted to Cook
60 Islands Maori as first
language. The English
40
indicator was therefore
20 adjusted to recognize Year
4 students had only one
0
year of English language
2012 2013 2014 2015 2016 2016 2018 2019
instruction.
Year
Further tracking at Year 8
Figure 14: National Year 4 English Literacy
and Year 11 shows this
Progress against the 2019 Target
does self-correct.
Students Achievements (%)
Literacy Progress Literacy Target
100
The 2015 decrease is
80 showing the first cohort of
60 students coming through.
More schools have since
40
adopted the Maori First
20 policy.
0
2012 2013 2014 2015 2016 2016 2018 2019
Year
15The figures below show the summary of the Year 4 Literacy Achievement from 2011 to 2015 nationally and by region,
for both Cook Islands Maori and English.
Figure 15: Year 4 National Maori Literacy Achievement
by Region 2011 - 2015
100
90
80
Number of Students (%)
70
60
50
40
30
20
10
0
2011 2012 2013 2014 2015
Rarotonga 59 86 72 88 77
Southern Group 60 41 43 45 73
Northern Group 29 29 52 20 67
National 58 69 65 74 75
Year
Figure 16: Year 4 National English Literacy Achievement
by Region 2011 - 2015
100
90
80
Number of Students (%)
70
60
50
40
30
20
10
0
2011 2012 2013 2014 2015
Rarotonga 78 81 75 82 65
Southern Group 75 41 57 60 74
Northern Group 33 - 52 27 71
National 73 69 69 74 68
Year
The Ministry have always known that the change in emphasis from English to Maori by our primary schools at Years 1-
3 would impact on Year 4 English results. This will be an ongoing trend while we build second language acquisition
programmes.
Note: Number of students at individual levels in the Northern Pa Enua are often very small and longitudinal data
should not be used for trend purposes.
16SECONDARY EDUCATION
Young Cook Islanders need to have the opportunity to gain the knowledge, skills and qualifications that will equip them
for the career and lifestyle of their choice.
Ongoing development work and recent rebuild opportunities of schools, has provided considerable opportunity to
reflect on what the Ministry of Education wants education to look like in the future. These conversations have
predominantly been about what do we want learning and teaching to be and therefore what physical spaces do we
need to achieve that. With these new developments in place, the Ministry will continue to provide support to schools
to ensure that learning programmes being offered to senior students allow for greater subject choice, academic success
and qualifications and provides a pathway for higher levels and career opportunities.
This support includes:
a. Individual learning programmes that meet student’s individual needs.
b. Precise and regular monitoring of academic results and feed forward to students on the next steps in their learning.
c. Life Skills Programmes – These courses provide Cook Island secondary students attending Pa Enua schools with the
opportunity to integrate modern and traditional skills and values to equip them for a sustainable lifestyle. Courses
delivered meet the life skills needs of the students, the island and its community, and utilize community experts in the
delivery of the course. There have been a number of courses delivered ranging from traditional art and craft, motor
mechanics and cooking.
d. Alternative Pathways – Pathways are offered by way of academies that provide senior students with a specialist learning
programme and industry based work experiences which lead to New Zealand recognized vocational qualifications of
which is also accredited towards student’s level 2 and level 3 NCEA results. Current academies include; Building and
Construction; Trades; Sport and Recreation; Hospitality; Business; and Horticulture.
e. Increased scope of careers education programmes – noting that young people are looking for relevancy between what
they are learning at school and their future lives and livelihoods, careers education has been extended to Y7 -13
students. The programmes for the younger students are particularly important in our Pa Enua schools where students
may not be exposed to as many career options in their daily lives.
f. Te Kura Uira: Online learning for the Cook Islands – The online school providing education to year 9 and 10 students in
isolated areas, has been consolidated. The programme now utilizes the language and mathematics programmes
developed by the National College and these have been adapted for online delivery modality. In 2016, there are Te Kura
Uira cohorts in Penrhyn, Manihiki and Mitiaro. Rakahanga is expected to join the programme in 2017.
17Figure 18: Secondary Education Enrolment by Region
2012 - 2016
2,500 2000
Total National Number of Students
Number of Students by Region
1850
1796
1746 1718 1724
2,000 1685 1700
151 1550
157 154 151 140
1,500 396 1400
384 374 391 344
1250
1,000 1100
950
1249 1205 1190 1182 1201
500 800
650
0 500
2012 2013 2014 2015 2016
Year
Northern Group Southern Group Rarotonga National
Figure 19: National Secondary Education Teachers by
Region 2012 - 2016
140
128 125
120 124 121
119
Number of Teachers
100
80 83 82 81
78 78
60
40
36 36 34 35
27
20
9 10 10 9 9
0
2012 2013 2014 2015 2016
Year
Rarotonga Southern Group Northern Group National
Table 06: 2016 Secondary Education Teachers by Gender and Region
Southern Northern
Gender Rarotonga National
Group Group
Male 36 11 4 51
Female 45 24 5 74
Total 81 35 9 125
18Figure 20: Secondary Education Student : Teacher Ratio
2012 - 2016
18
Number of Students per Teacher
16
14
12
10
8
6
4
Year 2
0
2012 2013 2014 2015 2016
Rarotonga 15 15 15 15 15
Southern Group 15 11 10 12 10
Northern Group 17 16 15 17 16
National 15 14 14 14 13
Year
Of the 50% of funding that
goes to Secondary
Education, 30% is allocated
to Junior Secondary (Years 7-
10).
20% is for Senior Secondary
(Years 11 - 13).
19SENIOR SECONDARY STUDENT RETENTION
Providing secondary education that engages young people and retains them in schooling is a focus for the Ministry.
The Education Act 2012 increased the minimum leaving age from 15 to 16 years which will impact on retention
particularly from Year 11 to Year 12. The change towards 100% retention from Year 10 – 11 suggests that students are
now moving through secondary school with their appropriate age cohort.
Figure 22: Senior Secondary Student Retention
Rates 2012-2016
120%
100%
Student Retention
80%
60%
40%
20%
0%
2012 2013 2014 2015 2016
Y10 - Y11 106% 101% 93% 89% 97%
Y11 - Y12 60% 67% 75% 79% 71%
Y12-13 69% 65% 54% 71% 70%
Year
NATIONAL CERTIFICATE OF EDUCATIONAL ACHIEVEMENT (NCEA)
The Cook Islands uses the New Zealand Qualification Authority NCEA as its national qualification. NCEA is a standards
based qualification where students gain credits by providing evidence against particular performance criteria. This
evidence can be provided through external examination and/or work completed internally over the school year.
Achievement may be awarded with merit or excellence for exceptional performance either in the overall qualification
or individual subject areas.
This qualification has three levels of attainment which align to the final three years of secondary schooling.
National Certificate of Educational Achievement by Participation
Figures 23-27 are the NCEA results based on the year level cohort. However, many students now progress through the
final years of secondary education taking programmes at multiple levels. They may achieve the qualification in a year
that does not correlate to their cohort year at school.
The figure below shows NCEA results by Participation. In this figure, only those students undertaking a programme of
study that contains enough credits to be eligible for the award of the qualification are considered.
20Figure 23: NCEA Level 1 to Level 3 National Results by
Participation for 2012 - 2015
Student Achievement (%) 100
90
80
70
60
50
40
30
20
10
0
2012 2013 2014 2015
Level 1 70.5 85.0 84.0 83.0
Level 2 76.0 75.0 88.0 79.1
Level 3 71.0 77.0 80.0 85.7
Unversity
45.0 49.0 61.0 40.4
Entrance
Year
National Certificate of Educational Achievement by Enrolment
In the Cook Islands, we focus on the results ‘by enrolment’ as it is a measure of the system as a whole and counts every
child.
These figures are based on cohort tracking. For Level 1 therefore, the figures report the percentage of Year 11 students
achieving Level 1; Level 2 responds to a Year 12 cohort; and Level 3 a Year 13 cohort. It is recognized however that
students participate in NCEA at different levels. The cohort tracking is a measure of the efficiency of the system and
does not show all assessment results which would in fact increase each of these outcomes.
Figure 24: NCEA Level 1 to Level 3 National Results for 2012-
2015 by Enrolment
100
90
Student Achievement (%)
80
70
60
50
40
30
20
10
0
2012 2013 2014 2015
Level 1 65.0 73.0 67.0 76.8
Level 2 76.0 62.0 75.0 78.6
Level 3 71.0 64.0 52.0 81.0
Year
21Annual targets are set based on 2008 baselines and results are tracked to ensure that suitable progress is
being made. The Education Master Plan (2008-2023) sets a 2023 target of 75% for Level 1 achievement. At
the times this was set the expectation of the New Zealand Qualifications Authority was that 70% of all students
should be able to achieve the Level 1 qualification.
100
Figure 25: NCEA Level 1 Achievement Progress against the 2019
90 Target
Student Achievement %
80
70
60
50
40
30
20
10
0
2012 2013 2014 2015 2016 2017 2018 2019
Year Level 1 NCEA Target
100
Figure 26: NCEA Level 2 Achievement Progress against the 2019
90 Target
80
Student Achievement %
70
60
50
40
30
20
10
0
2012 2013 2014 2015 2016 2017 2018 2019
Year Level 2 NCEA Target
100 Figure 27: NCEA Level 3 Achievement Progress against the
90 2019 Target
Student Achievement %
80
70
60
50
40
30
20
10
0
2012 2013 2014 2015 2016 2017 2018 2019
Year Level 3 NCEA Target
22SECONDARY LITERACY
Figure 28: NCEA Level 1 Literacy Progress against the
EMP Target
NCEA L1 Literacy Progress NCEA L1 Literacy Target
100
90
80
70
Percentage (%)
60
50
40
30
20
10
0
2012 2013 2014 2015 2016 2017 2018 2019
Year
SECONDARY NUMERACY
Figure 29: NCEA Level 1 Numeracy Progress against the
EMP Target
NCEA L1 Numeracy Progress NCEA L1 NumeracyTarget
100
90
80
70
Student Progress (%)
60
50
40
30
20
10
0
2012 2013 2014 2015 Year 2016 2017 2018 2019
23NATIONAL CERTIFICATE OF EDUCATIONAL ACHIEVEMENT ENDORSEMENTS
NCEA Certificate Endorsement
The NCEA Certificate may be endorsed with merit or excellence at each level. For excellence endorsement, at least 50
credits achieved at that level must have been achieved with excellence. For merit endorsement, at least 50 credits
achieved at that level must have been achieved with merit or excellence.
Table 07: NCEA Level 1 to Level 3 Merit and Excellence Endorsements 2012 - 2015
Year 2012 2013 2014 2015
Merit
NCEA Level 1 12 36 33 19
NCEA Level 2 5 6 14 19
NCEA Level 3 1 2 14 13
Excellence
NCEA Level 1 2 6 8 5
NCEA Level 2 0 2 3 4
NCEA Level 3 1 - 3 3
Figure 30: National Certificate of Education Achievement Level 1 to Level 3 National Results Endorsed with Merit or
Excellence for 2012 – 2015
L1 Achieved with Merit L1 Achieved with Excellence
2015 19 5
2014 33 8
2013 36 6
2012 12 2
- 5 10 15 20 25 30 35 40 45
Endorsements
24L2 Achieved with Merit L2 Achieved with Excellence
2015 19 4
2014 14 3
2013 6 2
2012 5 -
0 5 10 15 20 25 30 35 40 45
Endorsements
L3 Achieved with Merit L3 Achieved with Excellence
2015 13 3
2014 14 3
2013 2 -
2012 1 1
0 5 10 15 20 25 30 35 40 45
Endorsements
25NCEA Course Endorsement
An individual course may also be endorsed with merit or excellence. To gain this endorsement, the student must gain
at least 14 credits in a subject at excellence or merit level. The majority of subjects have a requirement of minimum
internally assessed and externally assessed credits within that 14. To be eligible for endorsement, a student must be
enrolled in at least 14 credits in an individual subject area. The following graphs and tables show the percentage of
course endorsements gained from the total number of eligible courses, for example, a student taking an 18 credit course
in Science, a 20 credit course in Mathematics and a 10 credit course in Social Science, would only be eligible for course
endorsement in two subjects - Science and Mathematics.
Figure 31: Percentage of Courses Endorsed with Excellence
by Level 2012-2015
Excellence Endorsements
15
12
9
(%)
6
3
0
2012 2013 2014 2015
NCEA Level 1 1.9 4.5 5.0 7.5
NCEA Level 2 1.0 5.3 3.5 8.0
NCEA Level 3 1.9 1.1 6.0 8.4
Year
Figure 32: Percentage of Courses Endorsed with Merit
by Level 2012-2015
15
Merit Endorsements %
12
9
6
3
0
2012 2013 2014 2015
NCEA Level 1 10 10.3 11.1 11.3
NCEA Level 2 6.4 6.6 10.4 11.5
NCEA Level 3 8 9.7 13.5 12.1
Year
26INCLUSIVE EDUCATION
Wide community support and understanding of Inclusive Education is a key goal for the Ministry of Education and the
Education Master Plan Learning for Life. Through the provision of funding for a local counterpart we are building the
capacity and improving the sustainability of Inclusive Education programmes.
The current initiatives for the Ministry of Education in support of Inclusive Education include:
a. The Certificate in Teacher Aiding (Level 3) - Delivered by the Ministry of Education Inclusive Education staff, this
professional development opportunity has been important in securing further achievements in Inclusive Education.
b. The Ministry, in collaboration with Internal Affairs and the National Council of People with Disabilities, introduced the
Meitaki Awards in December of 2015 for people with disabilities, inviting the general public to submit nominations of
those with disabilities and deserving of recognition for their contribution to their community.
The below table shows the breakdown of teacher aide support in Cook Islands schools. School Support teacher aides
provide resource support for learning programmes across all levels. Student Support teacher aides provide one on
one support for students with individual education plans.
Table 08: 2016 Inclusive Education Teacher Aides by Gender and Region
Teacher Aides
Student Support 31
School Support 20
Total 51
SCHOLARSHIPS
Efficient and effective management of Scholarships and Student Assistance programmes remains as a priority
deliverable for the Ministry of Education Business Plan. Financial support to Cook Islanders to access formal tertiary
education through the Scholarships Programme has been in existence for a number of years. Scholarship schemes
available to Cook Islanders include:
a) The Cook Islands Government Scholarship
b) The In-Country Tuition Awards Scholarship
From 2016, all scholarships are managed through the Cook Islands Ministry of Education.
Table 09: Number of Awards by Scheme and Gender 2012 - 2016
Year Cook Islands Government In-country Tuition New Zealand Pacific New Zealand Regional
Scholarship Scheme Awards Scholarship Scholarship Scheme Scholarship Scheme
M F M F M F M F
2016 5 11 2 11 - - - -
2015 1 9 2 5 0 5 0 2
2014 1 1 1 6 2 4 1 1
2013 1 2 0 0 2 4 3 0
2012 1 3 7 10 3 3 0 3
27TERTIARY EDUCATION
The Cook Islands Tertiary Training Institute (CITTI), established in July 2013 provides quality vocational training in the
Cook Islands.
The goals of lifting the skills level of the population through expanding post-school training options, increasing the
range of qualifications on offer, and connecting training more directly to the needs of local industry remains the
institutes main focus.
Since the establishment of CITTI there has been strong growth in the provision of both full time vocational courses,
including apprenticeships, and continuing education courses.
More recently the focus has been on:
Expanding and further developing the apprenticeship programme - The number of apprentices has increased across
both the City and Guild’s Certificate and Diploma qualification since 2015. Apprentices are involved in Food &
Beverage and Culinary courses.
Developing and growing the partnerships with schools - Building & Construction and Trades Academies are now being
delivered with students from the National College.
Embedding literacy & numeracy into the delivery of all programmes - With the introduction of a Literacy and
Numeracy Coordinator specific support is provided to students and tutors.
Growing the delivery of tertiary training in the Pa Enua - Island Broker positions have been established on the islands
of Aitutaki, Atiu, Mangaia and Pukapuka. The role of the broker is to coordinate life skills and continuing education
programmes on their individual islands. Plans are in place to extend this position across all Pa Enua communities.
Enhancing the Continuing Education programme that has been delivered in Rarotonga and in the Pa Enua since 2013.
Use of online learning modules in trades for the Pa Enua.
Figure 33: National Tertiary Enrolments FTE Students
2013-2015
35
30
25
FTE Students
20
15
10
5
0
2013 2014 2015
Trades and Technology 0.5 29.5 29
Hospitality and Services 15 17 24
Hair and Beauty 0 6 4.1
Nursing 0 11 26
Year
28TEACHER QUALIFICATIONS
The Ministry of Education continues its partnership with the University of the South Pacific (USP), encouraging teachers
to upgrade their qualifications. Teachers are currently enrolled in the following programmes;
a) Diploma in ECE
b) Bachelor of Education (ECE and Primary)
c) Post Graduate Certificate in Education (Teaching)
d) Post Graduate Diploma in Educational Leadership
e) Post Graduate Professional Certificate in Educational Policy and Planning
f) Master of Education
Courses are delivered through mixed modalities including DFL semester courses, online courses, summer and winter
schools, and face to face intensives with ongoing semester support. The graph below indicates the number of teachers
with specific teaching qualifications. The small number without a Teaching Certificate reflects previous requirements
of subject specific qualifications only at senior secondary specialist level. A teaching qualification is now also a
requirement.
Figure 34: Percentage of Teachers with a Teaching Certificate for the Years 2012 – 2016
100
Number of Teachers (%)
80
60
40
20
0
2012 2013 2014 2015 2016
Teaching Certificate 93 91 91 97 94
Year
Figure 35: Percentage of Teachers with a University Degree or Higher for the Years 2012 – 2016
100
80
Number of Teachers (%)
60
40
20
0
2012 2013 2014 2015 2016
Teachers with a Degree or Higher 38 35 38 41 48
Year
29MINISTRY OF EDUCATION BUDGET
The Ministry of Education’s annual planning responds to the Annual Budget Policy Statement from
government and aligns with the goals of the Education Master Plan, Statement of Intent and other
mandates. An Annual Education Business Plan and Budget is developed for consideration by the
government appointed Budget Support Group and central agencies. When preparing its submission,
the Ministry considers the national priorities and how these can be supported through the education
sector.
Figure 36: Education Budget 2011/2012 - 2015/2016
20M
18M
Education Budget ($NZ)
16M
14M
12M
10M
8M
6M
4M
2M
M
2011/2012 2012/2013 2013/2014 2014/2015 2015/2016
Education Total 13.8M 15.7M 17.8M 17.8M 18.9M
Government Appropriation 10.1M 10.M 11.2M 11.1M 15.2M
POBOC 1.6M 2.9M 3.3M 3.3M 3.7M
Donor Budget Support 2.1M 2.9M 3.3M 3.4M
The education budget for 2013/2014 shows a larger increase in funding due to teacher salaries being
moved up into the minimum of the Public Service Commission salary band, in an effort for pay parity
with other public servants.
Table 10: 2015/2016 Education Budget by Output
EDUCATION Gross ($NZ)
In 2016/ 2017, the Ministry
Taku Ipukarea Kia Rangatira 1,080,556 was part of a higher order
Learning and Teaching 1,196,460 funding modality, which saw
Learning and the Community 1,113,864
a shift from separate grant
funding arrangements to
Infrastructure and Support 10,409,272
central appropriation.
Corporate Services 920,203
Total 14,720,355Table 11: Education Budget as percentage of Nominal GDP
Year 2011/2012 2012/2013 2013/2014 2014/2015 2015/2016
Government $ $ $ $ $
Appropriation to 11,736,984 12,847,333 14,497,982 14,380,737 18,432,237
Ministry of
Education
Nominal GDP $ $ $ $ $
388,687,000 393,200,000 429,722,000 395,700,000 418,364,000
% 3.0 3.3 3.4 3.6 4.4
Table 12: Education POBOC, Capital Expenditure & Donor Budget Support
2015/15 Education POBOC $3,711,882
Subsidies
University of the South Pacific Contribution $ 285,000.00
Social Assistance
Government Funded Scholarships $ 520,000.00
Private School Funding $ 2,147,027.00
Cook Islands Trade Training Centre and the Hospitality Training Centre $ 759,855.00
2015/2016 Education Capital Expenditure $448,000
2015/2016 Budget Data Source: Cook Islands Government Budget Estimates 2015/2016
31APPENDICES
APPENDIX 1: SCHOOLS IN THE COOK ISLANDS - BY REGION, ISLAND, STATUS AND EDUCATION LEVEL
REGION ISLAND SCHOOL STATUS EDUCATION LEVELS
Rarotonga Rarotonga Government:
- Apii Arorangi ECE – Year 8
- Apii Avarua ECE – Year 8
- Apii Nikao ECE – Year 7
- Apii Rutaki ECE – Year 6
- Apii Takitumu ECE – Year 6
- Tereora College Year 8 – Year 13
- Titikaveka College Year 7 – Year 11
- Cook Islands Tertiary Adult Education
Institute
Private – Church:
- Imanuela Akatemia ECE – Year 13
- St Joseph’s School ECE – Year 6
- Nukutere College Year 7 – Year 11
- Papaaroa Adventist School ECE – Year 10
Private – Independent:
- Blackrock Apii Potiki ECE
- Apii Te Uki Ou ECE – Year 8
- The Creative Centre Adult Inclusive Education
Southern Group Aitutaki Government:
- Apii Araura ECE – Year 6
- Apii Vaitau ECE – Year 6
- Araura College Year 7 – Year 13
Private – Church:
- Tekaaroa Adventist School ECE – Year 6
Mitiaro Government:
- Apii Mitiaro ECE – Year 11
Atiu Government:
- Apii Enuamanu ECE – Year 13
Mauke Government:
- Apii Mauke ECE – Year 11
Mangaia Government:
- Mangaia School ECE – Year 12
(ECE satellite unit at Ivirua)
Northern Group Manihiki Government:
- Apii Ruamanu ECE – Year 11
- Apii Tukao ECE – Year 11
Penrhyn Government:
- Omoka School ECE - Year 10
- Tetautua School ECE – Year 8
Rakahanga Government:
- Rakahanga School ECE – Year 11
Pukapuka Government:
- Apii Niua ECE – Year 11
Nassau Government:
- Apii Nassau ECE – Year 11
Palmerston Government:
- Palmerston Lucky School ECE – Year 11
(Island Administration)APPENDIX 2: 2016 ENROLMENT BY REGION SCHOOL AND LEVEL
APPENDIX 3: 2016 ENROLMENTS BY AGE AND LEVEL
APPENDIX 4: 2007 – 2016 ENROLMENTS BY LEVEL

 Year        ECE      Year 1    Year 2   Year 3    Year 4   Year 5   Year 6   Year 7   Year 8   Year 9   Year 10   Year 11   Year 12   Year 13   Total

 2007        479       369       292      319       357      335      359      302      397      337      307       299       191       118      4,461

 2008        470       344       328      307       318      352      330      368      329      369      327       333       193        98      4,466

 2009        430       399       311      306       297      296      331      322      342      295      346       357       204        81      4,317

 2010        452       335       330      298       301      285      292      309      330      317      266       351       212       108      4,186

 2011        517       346       293      330       307      295      290      290      324      297      286       292       205       110      4,182

 2012        482       308       324      308       340      294      300      292      280      317      280       306       179       142      4,152

 2013        513       301       307      311       277      311      286      288      285      267      302       283       204       117      4,052

 2014        460       374       277      302       321      271      298      286      270      283      277       280       211       111      4,021

 2015        514       280       321      298       311      309      270      283      282      274      267       247       222       149      4,027

 2016        528       307       301      309       307      327      307      271      288      275      261       258       176       156      4,071

Average      485       336       308      309       314      308      306      301      313      303      292       301       200       119      4,194
APPENDIX 5: 2016 SCHOOL TEACHERS AND STAFF BY REGION

*Total by Level includes

** Creative Centre Principal
Meitaki Maata e Kia Manuia
You can also read