2021 PACIFIC NORTHWEST WATER YEAR - impacts assessment
←
→
Page content transcription
If your browser does not render page correctly, please read the page content below

2021
    PACIFIC
NORTHWEST
WATER YEAR
impacts assessment
Authors
Karin Bumbaco1, Matthew Rogers2, Larry O’Neill3, David Hoekema4, Crystal Raymond2

Design and graphics editing by Fiona Martin5

Affiliations

                  Acknowledgement
                 This work was supported by NOAA’s National Integrated Drought
                 Information System. We thank David Huggins (USDA Agricultural
                 Research Station), Stefanie Krantz (Nez Perce Tribe), and Julie
                 Smitherman (Medford Water) for their presentations at the Oregon/
Washington 2021 Water Year Meeting and contributions to this report. We would also
like to thank Kelly Smith (National Drought Mitigation Center) for providing the CMOR
on Drought survey data. This report was edited by members of the PNW Drought
Coordination Committee, organized by NIDIS, and we thank them for their thoughtful
comments and would like to acknowledge Erica Fleishman (Oregon Climate Change
Research Institute), Ryan Andrews (Oregon Water Resources Department), Holly
R. Prendeville (USDA Northwest Climate Hub), Jeff Marti (Washington Department
of Ecology), Nicholas Bond (Office of the Washington State Climatologist), Russell
Qualls (Idaho State Climatologist), Britt Parker (NIDIS/University of Colorado-Boulder
CIRES), and Scott Oviatt (Natural Resources Conservation Service) for their efforts.

Suggested Citation
Bumbaco, K.A., M.H. Rogers, L.W. O’Neill, D.J. Hoekema, C.L.
Raymond. 2022. 2021 Pacific Northwest Water Year Impacts
Assessment. A collaboration between the Office of the
Washington State Climatologist, Climate Impacts Group, Oregon
State Climatologist, Idaho Department of Water Resources, and
NOAA National Integrated Drought Information System.

1   Office of the Washington State Climatologist, Cooperative Institute for Climate, Ocean, and
    Ecosystem Studies, University of Washington
2   Climate Impacts Group, University of Washington
3   Oregon Climate Service, College of Earth, Ocean, and Atmospheric Sciences, Oregon State
    University
4   Idaho Department of Water Resources
5   Visualizing Science® LLC

2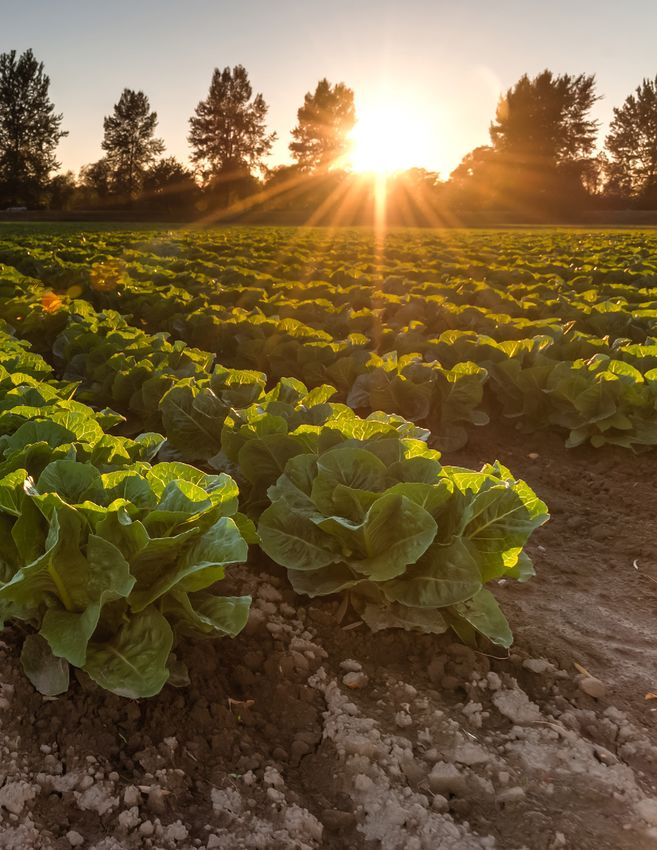
TABLE OF                        Executive Summary                                     4
                                1   Purpose                                               5
   CONTENTS
                                2   Lessons Learned                                       6
                                3   Water Year Evolution                                  8
                                    Water Year Summary Statistics
                                    Seasonal Progression

      2021
                                      • October 2020–January 2021
                                      • February 2021
                                      • March–May 2021
                                      • June–August 2021
                                      • September 2021
                                    Multi-Year Drought
       PACIFIC
                                4   Water Year Impacts                                   25
   NORTHWEST                        Condition Monitoring Observer Reports

   WATER YEAR                       Annual Pacific Northwest Water Year Impacts Survey
                                    Sector-Specific Water Year Impacts
                                      • Drinking Water
                impacts               • Agriculture
             assessment               • Forestry
                                      • Fisheries
                                      • Hydropower
                                      • Recreation

     Supported by the           5   Individual, Organizational,
NOAA National Drought
  Information System                & State Level Responses                              36
                                    Drought Declarations
                                    Other State Responses
                                    Organizational or Individual Response
                                      • Sector-Specific Water Year Changes in Operations
                                      • Changes in Operations Based on Forecast Conditions

                                6   Forecast Verification                                42
                                    November 2020–January 2021
                                    April–June 2021
           ON THE COVER:
        Field of lettuce near       References                                           45
          Kent, Washington.
      Credit: Trong Nguyen.

                                                                                     3
2021 PACIFIC NORTHWEST WATER YEAR

 EXECUTIVE SUMMARY
 Regional Water Year Conditions at a Glance
• The 2021 water year in Washington, Oregon, and Idaho (the Pacific Northwest; PNW) tied as the 5th
  warmest and 17th driest since records began in 1895. Parts of western Washington and coastal Oregon
  were the exceptions, with near-normal water year temperatures and precipitation.

• The winter of 2020–2021 was characterized by La Niña, but a typical La Niña atmospheric pattern over
  the PNW did not emerge until February 2021, which was wetter than normal and critical in building
  mountain snowpack. By April 1, most of the basins in the PNW had normal to above normal snowpack,
  with notable exceptions throughout southern Idaho and in the southern Cascade Mountains of Oregon.

• Drought worsened region-wide throughout the water year and a record dry spring was a major
  contributor to deteriorating conditions. For the PNW, March–May precipitation was the 2nd driest (45%
  of the 1981–2010 normal) since 1895 and the driest since 1924.

• An exceptionally warm summer, including a record-breaking heat wave in late June, worsened drought
  conditions and caused high evaporative demand. Averaged throughout the PNW, June–August ranked
  as the warmest on record (+4.5°F above the 1981–2010 normal).

• The exceptionally dry spring and summer combined with the warm summer caused the 2021 PNW
  drought, and the persistence of drought conditions over at least the last 2 water years in parts of the
  region also contributed.

 Impacts at a Glance
• The agriculture, forestry, drinking water, fisheries, and recreation sectors were affected by the abnor-
  mally dry conditions. Impacts included less surface water available for agriculture and fishes, water
  rights restrictions, reduced crop yields, plant stress, tree mortality, and voluntary water restrictions.

• Impacts were particularly widespread in central and southern Oregon, eastern Washington, and the Big
  Wood, Little Wood, Big Lost, and Little Lost River basins in Idaho.

• The June heat wave scalded and scorched crops, caused tree seedling mortality and mortality of
  shellfish in the intertidal, and damaged transportation infrastructure. Human health impacts from the
  heat, such as increased hospitalization and even death, were widespread.

 Response Actions at a Glance
• Portions of Idaho, Oregon, and Washington issued State drought declarations as early as March 31 and
  as late as November 17, 2021. Burn bans were issued for parts of Washington, Oregon, and Idaho and
  the use of certain recreational areas was limited during the wildfire season.

• Organizations and individuals responded to the drought conditions in a variety of ways. Examples
  of these responses include water systems requesting voluntary water restrictions and agricultural
  operators changing cattle feeding routines and watering schedules.

 Forecast Verification at a Glance
• A qualitative examination of two separate seasonal forecasts from the NOAA Climate Prediction Center,
  one for November 2020 through January 2021 and one for April through June 2021, showed that the
  region was drier than predicted. Seasonal forecasts indicated a drier than normal April–June for Oregon
  and southern Idaho, but both the magnitude of dry conditions and their extent into Washington and
  northern Idaho was unforeseen.

 4

F
    or several years, researchers,
    practitioners, and organizations
    working across practitioner–research
boundaries in Oregon and Washington
have held a joint Water Year1 Recap and
                                                                        PURPOSE
                                                         The purpose of this
                                                         assessment is to summarize
                                                         the water year conditions
                                                                                        1
Outlook meeting. A separate but similar                  and sector impacts as
meeting in Idaho is also held each year.
                                                         a resource for future
Two main objectives of the water year                    management of drought and
meetings are:                                            other climate extremes.
    1. To summarize the climate conditions
       of the previous water year;
    2. To review climate and weather-related             The assessment primarily reflects the
       impacts on various sectors, focusing              information from the meeting discussions,
       on drought and other extremes.                    the survey, and author expertise. Drought
                                                         and, to a lesser extent, the June 2021 heat
In addition to these impact discussions, an              wave and its impacts are the focus of this
Annual Pacific Northwest Water Year                      report.
Impacts Survey is used to collect
information on water year impacts for
multiple sectors.

1   A water year is defined as the 12 months beginning on October 1 and ending on September 30 of the
    following year (e.g., water year 2021: October 1, 2020-September 30, 2021).

                                                                                                        5
2
2021 PACIFIC NORTHWEST WATER YEAR

LESSONS LEARNED
1. Lessons Learned Based On the Assessment of Water
Year 2021 Conditions and Associated Impacts

Lesson 1.1: Rapid changes in the spring       temperatures during the heat wave remained
of 2021 demonstrated the importance           relatively cool despite high air temperatures
of considering a broader set of potential     because snow was still melting in many
conditions when planning for drought. The     areas. This likely mitigated potential impacts
La Niña winter brought normal to above-nor-   on fisheries relative to a late season heat
mal snowpack on April 1 to much of the        wave. In contrast, impacts in the forestry
region, which generally means no worse        and agriculture sectors may have been
than modest drought during the following      more severe because the heat wave
summer. The exceptionally dry spring          occurred before plants were acclimated
and warm summer combined with rapid           to seasonal hot and dry conditions.
snowmelt associated with an early warm
spell in mid-April, accelerated development   Lesson 1.3: Multiple-year impacts of
of drought and compounded its effects.        drought are possible and warrant planning.
                                              The PNW, particularly Washington, rarely
Lesson 1.2: The widespread impacts            experiences multi-year drought because
on multiple sectors associated with           precipitation in fall and winter usually is
the unprecedented June heat wave              sufficient for recovery. The 24-month pre-
demonstrates the importance of planning       cipitation deficits ending in September 2021
and preparing for short duration extreme      in some regions of the PNW are a reminder
temperatures, in addition to monthly and      of the potential for multi-year impacts. The
seasonal temperatures that are typically      severity of the drought in the 2021 water
monitored for drought. Additionally, the      year means that complete recovery is
timing of heat waves can influence natural    unlikely during the 2022 water year, setting
resource impacts. For example, stream         up more of the region for a multi-year event.

6
2021 PACIFIC NORTHWEST WATER YEAR

2. Lessons Learned From Water Year 2021 For
Improving Regional Drought Response

Lesson 2.1: Regular collaboration and         programs beyond water management and
coordinated drought status updates            hydrology, and now includes more interest
among key state and federal agencies          from the general public. This suggests a
throughout the water year are valuable        need to expand the water year meeting
opportunities to share information on         discussions to include ecological drought
evolving conditions and response              and aspects of water supply beyond drinking
measures. Ongoing collaboration enabled       water, hydropower, and irrigation. Content of
coordinated messaging and press releases      the water year meetings is also shifting away
that served as important communication        from technical information on forecasting
tools for the drought response.               water supply to information that serves
                                              the needs of this more diverse audience.
Lesson 2.2: Compounded impacts of
climate change and variability are becom-     Lesson 2.4: Water supply conditions were
ing more diverse and affecting natural        experienced differently by different types
resources, agriculture, and water supply.     of agricultural producers depending on the
For example, during the 2020 water year,      source of their water supply, revealing a
extensive impacts were associated with        gap in the state drought response. During
drought and widespread wildfires. During      the 2021 water year, irrigation production
the 2021 water year, extensive impacts were   was more resilient than dryland production
associated with the June heat wave and        in the areas with normal to above normal
extreme drought. In efforts to document       snowpack. Since state drought response
impacts associated with abnormal              is centered on facilitating emergency
climate combinations, it is undeniable that   withdrawals for entities with water rights,
complex factors lead to consequences for      state resources for dryland producers
natural resource managers, agricultural       were limited. While dryland producers
producers, and water providers. Interest      do have resources to mitigate drought
in documenting sector-specific impacts        impacts through the federal government
is high, but the complexity involved with     (i.e., crop insurance and USDA agricultural
identifying the mechanisms behind each        disaster proclamations), the 2021 water
impact may warrant a different approach.      year could be used as a catalyst for state
                                              governments to explore strategies that
Lesson 2.3: Interests and needs for           dryland producers may use to reduce
information related to the climate of the     their vulnerability to drought impacts.
water year and its impacts are becoming
more diverse. In the PNW, participants
at annual water meetings now include
members of sectors such as forestry and
recreation, in addition to professionals in
the water resource sectors. The audience
has expanded to a wider range of agency

                                                                                            7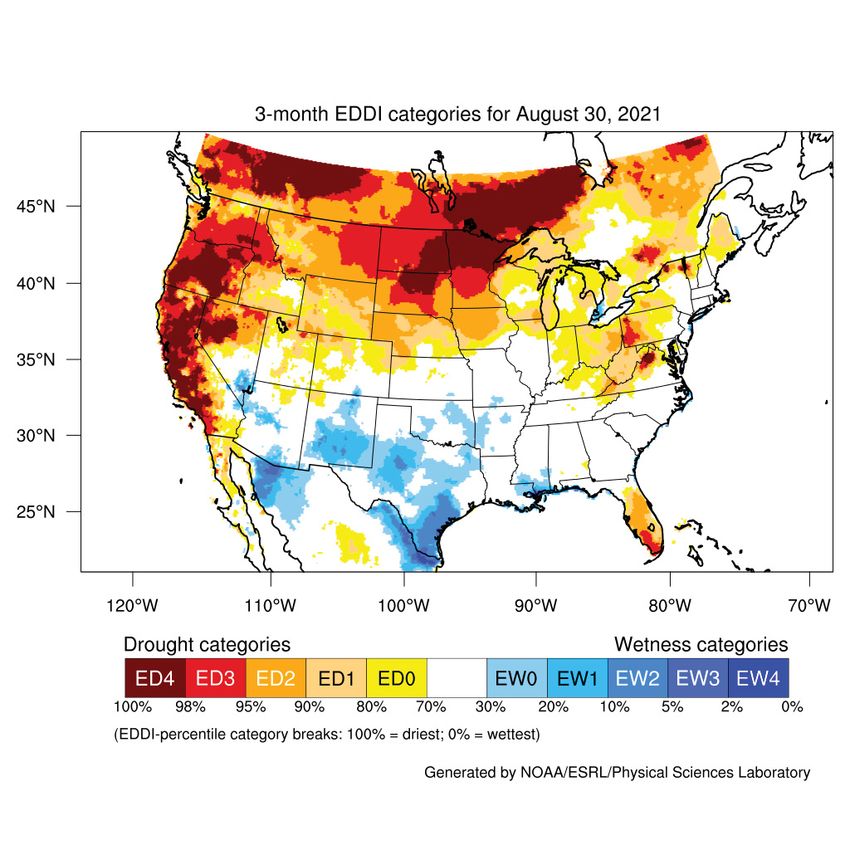
3
WATER YEAR EVOLUTION

WATER YEAR 2021
AT A GLANCE*
                                                   The 2021 water year was
                                                   warmer and drier than
                                                   normal for the PNW.
                                                   For the PNW, the 2021
       OR
                 4th        warmest; +1.9°F
                                                   water year tied 2016 as
                 16th       driest; –6.80 inches
                            (79% of normal)
                                                   the 5th warmest and
                                                   tied 1915 as the 17th
                                                   driest (83% of normal

       WA
                 8th        warmest; +1.7°F
                                                   precipitation) on record
                                                   (since 1895; NOAA NCEI).
                 45th       driest; –3.08 inches
                            (93% of normal)

                 8th        warmest; +1.7°F

      ID
                 10th       driest; –5.91 inches
                            (75% of normal)

*Anomalies relative to 1981–2010 normal;
 records since 1895 (Source: NOAA NCEI 2021)

8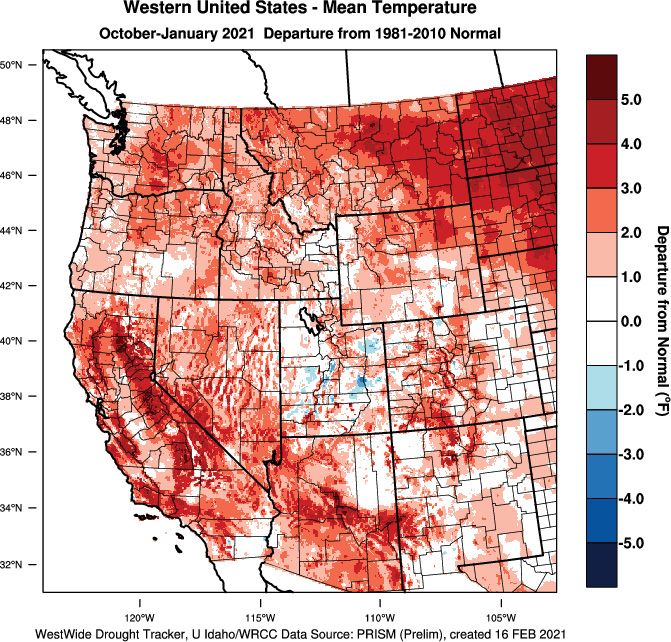
2021 PACIFIC NORTHWEST WATER YEAR

             October–September 2021                                   October–September 2021

      –5.0   –3.0   –1.0    1.0    3.0    5.0                    30     70     90     110    130      200
             Temperature anomaly (°F)                                 Precipitation (% of normal)

W
        ater year temperature       Figure 1: October 2020–             66% of the state in either
                                    September 2021 average
        and precipitation                                              “severe” or “extreme” drought.
                                    temperature departures
        anomalies were spa-                                             Many of Oregon’s reservoirs
                                    and precipitation percent of
tially consistent throughout        normal. The normal period is        had much below average
much of the PNW (Figure 1).         1981–2010. Source: WestWide         carryover from the 2020
Averaged over the 2021 water        Drought Tracker.                    water year, particularly in
year, temperatures were                                                 areas outside of northwest
above normal2 throughout nearly the entire              Oregon. Drought in Washington was limited
region and for each state. Drier than normal            to eastern Washington, with 17% of the
conditions were widespread in Oregon and                state in “severe” or “extreme” drought as
Idaho, with more variability in Washington.             a result of below normal 2020 water year
Southern Idaho and the east slopes of the               precipitation. Nevertheless, the reservoir
southern Cascade Mountains in Washington                storage at the start of the water year was
and Oregon were the driest locations, with              adequate. For example, the Yakima Basin
30 to 70% of normal precipitation. Most                 started the water year with above normal
of western Washington had near-normal                   storage. Similarly, almost all reservoirs
precipitation, with a few small areas                   in Idaho began the water year with above
above normal. Idaho was the driest of                   average carryover. The Wood and Lost
the three states relative to its normal.                River basins, in the 4% of Idaho that was
                                                        in “severe” or “extreme” drought, were the
At the start of the 2021 water year, there              exceptions, with below normal reservoir
was significant variability in drought across           volumes at the start of the water year.
the PNW as defined by the U.S. Drought
Monitor (Figure 2, next page). Oregon had               Drought conditions worsened throughout
the most extensive drought coverage, with               the water year, however, and not necessarily

2   The period of 1981–2010 is used as the “normal” throughout this report unless stated otherwise.

                                                                                                            9
2021 PACIFIC NORTHWEST WATER YEAR

                   September 29, 2020                                       September 28, 2021
           6%              6%                    3% 1%               4%
                                                                                                           9%
             9%          11%                  13%                                         27%       24%
     34%                         37%                   29%     27%    24%          29%
             19%                                                                                              28%
                      27%
                                                 54%              45%              18%   18%            39%
       32%                      19%                                                    8%

      Oregon             Washington               Idaho          Oregon            Washington           Idaho

                Washington                                                Washington

                                         Idaho                                                  Idaho

                Oregon                                                    Oregon

                               Intensity
                                      None                      D2: Severe Drought
                                      D0: Abnormally Dry        D3: Extreme Drought
                                      D1: Moderate Drought      D4: Exceptional Drought

 due to lack of snowpack.          Figure 2: Pie charts and maps of     year better than water year
 Worsening drought conditions      drought conditions    from the U.S.  averages and totals. This fact
 were primarily caused by          Drought Monitor on September         is illustrated by the water year
 an exceptionally dry spring       29, 2020  (left) and September       total precipitation percent of
                                   28, 2021 (right).
 and warm and dry summer.                                               normal (Figure 3, next page).
 By the end of the water                                               The Washington total water
 year, about 25% of each state’s area was               year precipitation is neutral relative to the
 in “exceptional drought,” the worst drought            historical rank because it is an average of
 category recognized by the U.S. Drought                wetter than normal conditions in the early
 Monitor. About 39% of Idaho, 45% of                    part of the water year and drier than normal
 Oregon, and 18% of Washington were in                  conditions during the spring and summer.
“extreme drought”. The following section                By contrast, total water year precipitation for
 describes the weather conditions that led              Oregon and Idaho rank in the moderately dry
 to drought expansion in more detail.                   and severely dry categories, respectively.

Seasonal Progression                                         Precipitation ranks for individual months
The seasonal progression of temperature                      clearly show the extent to which spring
and precipitation characterizes the water                    conditions were dry (Figure 3). In each state,

10
2021 PACIFIC NORTHWEST WATER YEAR
March, April, and May were moderately, Washington June precipitation ranked as
severely, or extremely dry. There is more neutral. In contrast, August was abnormally
variability among the states during summer wet in Idaho but neutral, although drier
months. In June, Idaho was extremely dry than normal, in Oregon and Washington.
whereas Oregon was abnormally dry and Washington’s July precipitation rank was
as low as in April, and was extremely dry
200
compared to the historical record. Few
180 ID months ranked amongst the wettest in the
160 Aug historical record. February, which finally
140 looked like a typical winter month during
Feb
120 La Niña, was abnormally wet for all three
100 Jan Nov states. The water year ended moderately wet
Oct–Sep Oct
80
for Washington and Oregon, but September
60 Mar Sep Jul
May Dec was still drier than normal for Idaho.
40 Apr
20 Jun
Precipitation (% of 1981–2010 average)
0 The relative dry and wet periods are also
200 illustrated by the October 2020–September
180 OR Sep 2021 average streamflow for the PNW
160
(Figure 4, next page). Streamflow was
140
Feb below normal in early December and March
120
100
Jan through mid-September, corresponding
Oct–Sep
80 Nov well with the drier periods of the water
Oct Dec
60 Mar
Jun year. Streamflows in mid-October and
40 May late December through mid-January
Jul Aug
20 Apr were above normal. The monthly and
0 seasonal conditions are discussed in
200
further detail in the next sections.
180 WA Sep
160
140 Feb
120 Oct
Dec Jan
100
Oct–Sep Figure 3: Monthly percent of normal (compared
80 Mar Nov
Jun to 1981–2010 baseline) statewide precipitation
60 Aug
May as a function of the monthly precipitation rank
40
Apr during the last 126 water years for Idaho (top),
20 Jul
Oregon (middle), and Washington (bottom). The
0
1 12 25 37 63 89 101 114 126 water year 2021 total is shown as the red circle.
Historical dryness rank out of The colors corresponding to dry conditions follow
126 water years (1896–2021) the U.S. Drought Monitor and those corresponding
to wet conditions follow the Climate Toolbox U.S.
Wet/dry spectrum Water Watcher tool. The sizes of the circles are
Exceptionally wet Abnormally dry scaled according to each month’s relative average
Extremely wet Moderately dry contribution to the water year total precipitation,
Severely wet Severely dry from dry (small) to wet (large). NCEI nClimDiv data
Moderately wet Extremely dry accessed on December 31, 2021; panels adapted
Abnormally wet Exceptionally dry from L. O’Neill.
Neutral
112021 PACIFIC NORTHWEST WATER YEAR
8
in the Pacific Northwest (mm)
7-day average runoff
1
Oct Nov Dec Jan Feb Mar Apr May Jun Jul Aug Sep
2020 2021
Percentile classes
Lowest 5 10–24 25–75 76–90 95 Highest Runoff
(10th percentile) (90th percentile)
Much below normal Below Normal Above Much above normal
normal normal
Figure 4: Seven-day average
October 2020– Precipitation
runoff over the PNW for
January 2021 Precipitation from
water year 2021 (top) and the
Temperature percentiles as the runoff relates
October–January was
The 2021 water year began to the historical record (bottom). more spatially variable
with near-normal to above Source: USGS. than temperature, and was
normal October 2020 below-normal across most
temperatures throughout the PNW. The of Oregon and central and southern Idaho,
majority of the region was warmer than which is atypical during La Niña winters.
normal through the next several months. The driest part of Idaho during this period
Temperatures from October through January were the basins along the southern border,
in Oregon, Washington, and Idaho ranked as which received 30–70% of their normal
the 9th, 11th, and 17th warmest, respectively, precipitation, and statewide it was the 25th
and temperature anomalies were between 1 driest on record. In Washington, the only
and 5°F above normal (Figure 5, next page). area with below-normal October–January
precipitation was the Lower Columbia
122021 PACIFIC NORTHWEST WATER YEAR
OCTOBER 2020–JANUARY 2021 STATISTICS*
OR WA
ID
9th warmest; +1.8°F
11th warmest; +2.0°F
17th warmest; +1.8°F
40th driest; –2.17”,
87% of normal 74th driest; +1.15”,
105% of normal 25th driest; –1.93”,
81% of normal
*Anomalies relative to 1981–2010 normal; records since 1895. Source: NOAA NCEI 2021
October–January 2021 October–January 2021
–5.0 –3.0 –1.0 1.0 3.0 5.0 30 70 90 110 130 200
Temperature anomaly (°F) Precipitation (% of normal)
Figure 5: October 2020–January
Basin in eastern Washington, one of areas that was dry during
2021 average temperature
the 2020 water year. Conversely, the rest of Washington and
departures from normal (left)
northern Idaho had normal to above-normal precipitation. and precipitation percent
of normal (right). Normal
Snowpack period is 1981–2010. Source:
Mountain snowpack accumulated early in the water year, WestWide Drought Tracker, using
with statewide percentages on December 1, 2020 at 148% provisional PRISM data.
132021 PACIFIC NORTHWEST WATER YEAR
and 129% of median for Oregon and a particularly dry month throughout the
Washington, respectively. On December PNW, except in the Puget Sound region of
1, average basin snowpack in Idaho was Washington. December–January combined
lagging behind at 73 and 89% of median was dry except in northern Washington,
for areas south of and north of the Salmon western Washington, and northwest Oregon,
River, respectively. However, December was resulting in below normal snowpack for
DECEMBER 1, 2020 SNOW WATER EQUIVALENT*
OR WA
ID
148% of median
129% of median
89% of median North
of Salmon River
73% of median South
of Salmon River
*Statewide on Dec 1, 2020; compared to 1981–2010 median. Source: National Resources Conservation Service
FEBRUARY 1, 2021 SNOW WATER EQUIVALENT*
OR WA
ID
78% of median
102% of median
82% of median North
of Salmon River
79% of median South
of Salmon River
*Statewide on Dec 1, 2020; compared to 1981–2010 median. Source: National Resources Conservation Service
142021 PACIFIC NORTHWEST WATER YEAR
most basins in Oregon and Idaho. As a result, February 1, 2021,
Figure 6: February 2021 average
statewide average snow water equivalent was 78%, 102%, and
temperature departures from
80% of normal for Oregon, Washington, Idaho, respectively.
normal (left) and precipitation
percent of normal (right). Normal
February 2021 period is 1981–2010. Source:
The atmospheric pattern shifted in February to one that is WestWide Drought Tracker, using
more typical during La Niña winters. Anomalous flow from provisional PRISM data.
February 2021 February 2021
–12.0 –8.0 –4.0 0.0 4.0 8.0 12.0 5 50 90 110 150 300
Temperature anomaly (°F) Precipitation (% of normal)
FEBRUARY 2021 STATISTICS*
OR WA
ID
53rd coldest; –1.8°F
34th coldest; –3.2°F
44th coldest; –2.1°F
39th wettest; +0.95”,
127% of normal 37th wettest; +1.45”,
134% of normal 33rd wettest; +0.92”,
143% of normal
*Anomalies relative to 1981–2010 normal; records since 1895. Source: NOAA NCEI 2021
152021 PACIFIC NORTHWEST WATER YEAR
the northwest brought cooler and wetter March–May 2021
than normal conditions, greatly increasing
snowpack in Washington, northeastern
Oregon, and northern Idaho. The lee side
of the Cascade Mountains in Oregon
and Washington remained dry, as did
south-central Idaho (Figure 6, previous page).
Regionwide, February precipitation ranked
as the 36th wettest for the PNW as a whole.
Average February temperatures were below
normal throughout the PNW, especially
in Washington, where the month ranked
as the 34th coldest February on record.
March–May 2021 30 70 90 110 130 200
Temperature Precipitation (% of normal)
Average spring temperatures were
near-normal throughout the PNW. In general, Figure 7: March–May 2021 precipitation percent of
normal. Normal period is 1981–2010. Source: West-
temperatures were relatively cool in March,
Wide Drought Tracker, using provisional PRISM data.
warm in April, and near-normal in May.
Precipitation precipitation ranked as the 2nd driest for
Regional precipitation was much below Oregon, Idaho, and Washington, separately,
normal for spring as a whole, and for each with individual statewide totals ranging from
individual month (Figure 7). March–May 41 to 50% of normal. Eastern Washington,
MARCH–MAY 2021 STATISTICS*
OR WA
ID
32nd warmest; +0.6°F
34th warmest; +0.5°F
40th warmest; +0.2°F
2nd driest; –5.07”,
41% of normal 2nd driest; –5.37”,
46% of normal 2nd driest; –3.43”,
50% of normal
*Anomalies relative to 1981–2010 normal; records since 1895. Source: NOAA NCEI 2021
162021 PACIFIC NORTHWEST WATER YEAR
APRIL 1, 2021 SNOW WATER EQUIVALENT*
OR WA
ID
113% of median
126% of median
99% of median North
of Salmon River
87% of median South
of Salmon River
*Statewide on Dec 1, 2020; compared to 1981–2010 median. Source: National Resources Conservation Service
Snow water
equivalent (%)
≥ 200
175
150
125
100
75
50
25
≤0
Figure 8: April 1, 2021 snow water equivalent (SWE) percent of 1981–2010 median. Source: NRCS.
172021 PACIFIC NORTHWEST WATER YEAR
Historic
the driest area relative to Upper Deschutes- snowpack
normal, received less than 30% Crooked Basin
of normal spring precipitation. 90%
Basin snowpack index
70%
Snowpack
Despite the dry conditions, 30%
snow water equivalent (SWE) 10%
90%
on April 1, 2021 was normal
to above normal for most of
Washington, Oregon, and northern 2021
snowpack
Idaho (Figure 8, previous page).
Average statewide snowpack,
Median
compared to normal, was 126%
1- t
ov
c
n
b
n
l
ar
1- r
ay
Ju
c
Ap
De
Ja
Ju
Fe
snowpack
O
M
M
N
1-
1-
1-
1-
1-
1-
1-
1-
in Washington, 113% in Oregon, 2021 water year
and 87% in Idaho. Snowpack in
most basins south of the Salmon Figure 9: The Upper Deschutes-Crooked Basin, Oregon, water
River in Idaho was below normal. year 2021 snowpack trace (red line) compared to normal
(dashed line), illustrating faster than usual melt-out even
with above-normal snowpack by April 1. Source: Scott Oviatt
At this point in the season, the
USDA-NRCS.
severity of the forthcoming drought
was unforeseen. While Idaho had
the lowest snowpack of the three June–August 2021
states, excellent carryover in the reservoir Temperature
system promised to significantly mitigate Summer temperatures were much above
the impacts of any potential drought. Based normal throughout the PNW. Average state
on the April 1 snowpack, the only areas temperatures from June–August were the
where drought was expected to intensify warmest on record for Oregon and Idaho
were the Klamath basin of southern Oregon and the second warmest for Washington.
and the eastern portion of the mountains Average June–August temperatures
of central Idaho. A warm spell in mid-April, were between 2 and 6°F above normal
however, caused snowpack in Oregon and regionally (Figure 10, next page), and there
Idaho to melt faster than usual. Snowpack was an unprecedented heat wave at the
ultimately melted out 1–3 weeks early, even end of June (see “The June 2021 Heat
in basins with above-normal April 1 SWE Wave,” page 22) that sent temperatures
(Figure 9). By April 15, the NOAA Seasonal soaring across the region. For a few days
Drought Outlook for April through July 2021 during that event, temperatures in the
reflected the increasingly dry conditions temperate coastal cities of Portland and
and predicted drought development Seattle exceeded those in Las Vegas.
across the entire PNW except western
Washington and northwest Oregon. Summer temperatures remained elevated
beyond the duration of the extreme heat
event, causing very high evaporative demand
that increased drought severity. Values of
the June–July–August Evaporative Demand
182021 PACIFIC NORTHWEST WATER YEAR
June–August 2021 June–August 2021
–6.0 –4.0 –2.0 0.0 2.0 4.0 6.0 30 70 90 110 130 200
Temperature anomaly (°F) Precipitation (% of normal)
Figure 10: June–August 2021 average temperature departures from normal (left) and precipitation percent of
normal (right). Normal period is 1981–2010. The small area of below-normal temperatures on the Washington
coast is an artifact of unreliable data that were removed from the PRISM data during the quality control
process but are still visible in the mapping application used here. Source: WestWide Drought Tracker, using
provisional PRISM data.
JUNE–AUGUST 2021 STATISTICS*
OR WA
ID
RECORD warmest; +4.8°F
2nd warmest; +4.2°F RECORD warmest; +4.4°F
14 49% of normal
th driest; –1.39”,
16th driest; –1.79”,
55% of normal 27 67% of normal
th driest; –1.16”,
*Anomalies relative to 1981–2010 normal; records since 1895. Source: NOAA NCEI 2021
193-Month EDDI Categories for August 30, 2021
Driest ED4 ED3 ED2 ED1 ED0 EW0 EW1 EW2 EW3 EW4 Wettest
100 98 95 90 80 70 30 20 10 5 2 0
Evaporative demand drought index (%)
Figure 11: Evaporative Demand
Drought Index (EDDI) show receiving less than 70% of
Drought Index (EDDI) for the
extremely and exceptionally normal precipitation (Figure
3-month period ending on
dry conditions throughout August 30, 2021. Source: PSL.
10, previous page). For the
the PNW (Figure 11, page PNW, June through August
20). The high evaporative precipitation ranked as the
demand meant that the little precipitation 11th driest on record. Some of the dryness
that fell was even less likely to meet can be attributed to a lack of monsoonal
water supply demands. Soils were also rainfall that is mainly associated with thun-
extremely dry throughout the summer derstorms. Parts of western and southern
with historically low soil moisture in the Idaho and far eastern Oregon, including
upper 1 meter of the surface as measured the Owyhee and Wallowa Mountains,
by the NASA Grace satellite (not shown). received well above normal precipitation
during August 2021 (not shown). However,
Precipitation central Oregon, eastern Washington, and
The dry spring conditions continued into northern Idaho received below-normal
summer, with a majority of the PNW precipitation during these months.
20Vineyards in the Columbia
River Gorge, Washington.
Credit: Rigucci
March–August 2021 Conditions
The exceptionally dry spring and summer in combination with the warm summer drove drought
development throughout the PNW. In parts of southern Oregon and southern Idaho, below
normal winter snowpack also contributed to the drought severity and subsequent impacts.
Averaged across the PNW, the March–August period was the second driest on record, with
49% of normal precipitation, and the driest March–August since 1924. PNW March–August
average temperatures ranked as the 4th warmest on record, with an anomaly of 2.5°F.
Although the individual state rankings are included for the March–May and June–August
periods, separately, we are also highlighting those numbers for the March through August
period as a whole since 2021 was anomalous even over the longer 6-month period.
MARCH–AUGUST 2021 STATISTICS*
OR WA
ID
3rd warmest; +2.7°F
4th warmest; +2.3°F
5th warmest; +2.3°F
2nd driest; –6.45”,
43% of normal 2nd driest; –7.16”,
49% of normal 3rd driest; –4.59”,
56% of normal
*Anomalies relative to 1981–2010 normal; records since 1895. Source: NOAA NCEI 2021
21The June 2021 Heat Wave
On June 25, an extraordinary heat
wave impacted the PNW for several
days. Triple-digit temperatures were
common throughout Washington and
Oregon, even west of the Cascade
Mountains. The heat dissipated by June
30 throughout most of Washington
and Oregon as the high pressure
shifted inland, causing extreme
temperatures in Idaho through early
July. All-time high maximum and
minimum temperature records were set
at many weather stations throughout
the region, and possible new state
records are still being evaluated.
The ridge of high pressure associated
with this heat event is a classic
and notable feature of PNW heat
waves, but the strength of the ridge
was unprecedented in the record as
measured by the upper air sounding
station at Quillayute, Washington.
The location of the ridge during the
hottest day in western Washington and
western Oregon was similar to historic
heat waves in the region (Bumbaco
et al. 2013), but the magnitude of the
ridge was greater than that of any
other known historical heat events. A
rapid attribution analysis found that a
warming climate made the heat event
150 times more likely to occur and
3.6°F (2°C) warmer than it otherwise
would have been (Philip et al. 2021).
Air temperature anomalies
recorded across North America
on June 27th, 2021. Red areas
were more than 27°F (15°C)
higher than the 2014–2020
average for the same day.
Source: NASA GEOS
–15 –10 –5 0 5 10 15
2-Meter air temperature anomaly (°C)
22September 2021
Figure 12: September 2021
Temperature
average temperature departures
Temperatures moderated in September, with monthly aver-
from normal and precipitation
ages near normal for most of Washington and Oregon, except percent of normal. Normal
southeastern Oregon where temperatures were above normal period is 1981-2010. Source:
(Figure 12). In Idaho, temperatures were 1–4°F above normal, WestWide Drought Tracker, using
and September ranked as the 23rd warmest on record. provisional PRISM data.
September 2021 September 2021
–5.0 –3.0 –1.0 1.0 3.0 5.0 30 70 90 110 130 200
Temperature anomaly (°F) Precipitation (% of normal)
SEPTEMBER 2021 STATISTICS*
OR WA
ID
29th warmest; +1.0°F
43rd warmest; +0.2°F
23rd warmest; +1.7°F
22nd wettest; +0.87”,
184% of normal 20th wettest; +1.47”,
190% of normal 42nd driest; –0.31”,
73% of normal
*Anomalies relative to 1981–2010 normal; records since 1895. Source: NOAA NCEI 2021
232021 PACIFIC NORTHWEST WATER YEAR Precipitation September 2021 An atmospheric river event began on September 17, ushering in fall and offering the first glimpse of relief from the dry conditions. Overall, September was much wetter than normal for Washington and Oregon, but drier than normal for Idaho, except in the northern panhandle. There was minor alleviation of drought conditions, mostly west of the Cascade Mountains, but much more precipitation was required to make a significant dent in the drought conditions. At the end of the water year, the U.S. Drought Monitor still classified nearly the entire PNW in “moderate 2.5 1.5 0.5 –0.5 –1.5 –2.5 drought” or worse (Figure 2, page 10). 24-Month SPEI Multi-Year Drought Figure 13: 24-month Standardized Precipitation The weather and seasonal climate Evapotranspiration Index (SPEI) for the period conditions for water year 2021 are ending September 30, 2021. Source: WestWide reviewed above, but there are longer-term Drought Tracker, using provisional PRISM data. precipitation deficits across much of the PNW when considering the previous were likely the main drivers of the drought 2020 water year. The Standardized throughout much of the PNW, longer-term Precipitation Evapotranspiration Index drought in the region also played a role. (SPEI), a standardized index that has both a precipitation and temperature component, is At the time of this writing, the 2022 water shown for the 24 months ending September year is underway, and exceptionally wet fall 2021 in Figure 13. Indices less than –1 conditions have alleviated drought in some typically signify the beginning of drought, areas of the PNW. Western Washington and drought severity increases as the index in particular has greatly improved, in part becomes more negative. The 24-month SPEI because drought across most of that shows drought throughout the PNW, with area had not persisted for multiple years. values less than –2.0 east of the Cascade However, drought is persisting and is likely Mountains in Oregon and Washington and to continue in some of the areas that were in southern Idaho. The 24-month SPEI the driest during the last two water years. As ending with the 2021 water year, averaged of early January 2022, the NOAA Drought statewide and compared to all consecutive Termination and Amelioration tool shows two water years on record, indicated the that about 200% of normal precipitation is 2nd worst drought on record (since 1897) needed for the driest areas (SPEI of –2.0 or for Oregon (–1.66), the 5th worst for Idaho less in Figure 13) to completely erase the (–1.41), and the 14th worst for Washington drought conditions by April 2022, and the (–0.97). Although the exceptionally dry probability of that occurring is less than 1%. spring and summer and warm summer 24
WATER YEAR IMPACTS
                       4
      Information on drought and other
      climate conditions are critical to
      connecting those conditions to
      their effects on local resources,
      people, and economies. Here we
      summarize impacts on multiple
      sectors in Oregon, Idaho, and
      Washington from three sources:

       • The national Condition
         Monitoring Observer
         Reports (CMOR)

       • The Annual Pacific Northwest
         Water Year Impacts Survey

       • Presentations and
         discussions from the 2021
         water year meetings

                                      25
2021 PACIFIC NORTHWEST WATER YEAR
I
nformation on impacts is collected hydropower, recreation, and stormwater),
throughout the water year and retro- and is distributed at the end of the water
spectively at the end of the water year. year. Characterization of abnormally dry
CMOR, started in 2018, allows members or wet conditions is made by the survey
of the public to submit drought impact respondents. Respondents are able to select
reports for their specific location at any impacts from a list or specify other impacts.
time of year. The Annual Pacific Northwest Impacts due to abnormally wet conditions
Water Year Impacts Survey is distributed were omitted from this report due to the
at the end of the water year to natural very few responses in the 2021 water year.
resource managers and agency staff, as
well as everyone who registers to attend We distributed the 2021 water year survey in
the water year meetings. Information from October 2021 via listservs of NIDIS, Office
presentations and discussions from the of the Washington State Climatologist
2021 water year meetings detailed here (OWSC), Climate Impacts Group (CIG), and
highlights particularly compelling drought regional water associations. Fifty-two
impacts and responses within the region. people responded; 47% were employees
Neither these sources nor the impacts of local, state, and federal agencies, and
presented in this report are exhaustive. others were affiliated with Tribes, nonprofit
organizations, universities, irrigation
Condition Monitoring Observer districts, and power and water utilities.
Reports (CMOR) Most responses were from Oregon and
CMOR, organized by the National Drought Washington. We include responses from
Mitigation Center (NCMC) and the National agencies, as well as resource producers, and
Integrated Drought Information System in some cases responses may describe the
(NIDIS), collects local observations same impacts. While the survey asked for
of drought impacts to aid in drought impacts related to stormwater, no responses
monitoring and research. The observations were recorded for the 2021 water year, so
inform the U.S. Drought Monitor process stormwater sector impacts are omitted.
and agencies that make drought-related The sector-specific survey results depicted
decisions. Observers submitted 94 in the pie charts are from this survey, and
reports for the PNW—50 from Oregon, 23 do not include results from CMOR.
from Washington, and 11 from Idaho—to
CMOR during the 2021 water year. An
additional 316 reports were submitted on
a supplemental CMOR survey that focused
solely on forestry impacts. Specific results
from CMOR can be found on page 32.
Annual Pacific Northwest
Water Year Impacts Survey
The PNW survey is designed to collect
information on impacts of abnormally
dry or wet conditions on multiple sectors
(drinking water, agriculture, forestry, fisheries,
262021 PACIFIC NORTHWEST WATER YEAR
SECTOR-SPECIFIC WATER YEAR IMPACTS
Drinking water
Impacts on the drinking water sector were mainly reported for watersheds in Oregon,
including the Bull Run and Clackamas. Respondents indicated that the primary causes of
these impacts were a combination of a lack of winter precipitation, low spring snowpack,
and extreme summer heat. Of the 19 respondents, 18 (95%) reported impacts due to
abnormally dry conditions and 1 (5%) reported impacts due to abnormally wet conditions.
DRINKING WATER IMPACTS SURVEY
Abnormally dry
18 responses
33% 28% 22% 22% 5% 5% 5%
Declining Water rights Use of backup Lower than
groundwater restrictions or alternative normal reservoir
levels water source levels or inflows
Voluntary water Water quality
conservation impacts Harmful algal
blooms
Dry bed of
Emigrant Lake
(near Ashford,
Oregon) in October
2020. Emigrant
Lake is associated
with the Talent
Irrigation District
Credit: Julie
Smitherman
27Rogue Valley, Oregon Water Resources
Drought conditions in water year 2021 and in previous years, caused by below-normal precip-
itation and snow accumulation, created challenges for water providers in southern Oregon.
Medford Water, the largest municipal water provider in the area, serves water to approximately
140,000 customers across eight cities from their primary source, Big Butte Springs, and their
secondary source, the Rogue River.
Streamflow values for Big Butte Springs throughout the year were considerably below average.
Precipitation at Big Butte Springs from October 2020–May 2021 was about 70% of average,
and snowpack on May 1 was about 52% of average. This led to spring flows at Big Butte
Springs that were 20% less than average, and the lowest in the last 20 years.
Municipal supply was also restricted by record high demand earlier in the year. Flow limitations
at Big Butte Springs required Medford Water to rely more heavily on the Rogue River. 2021
marked the earliest use of that secondary source, with the start-up of the Duff Water Treatment
Plant on April 1.
Recognizing the growing concern over water supply in the Rogue Valley, Medford Water
requested voluntary water reductions throughout the summer. Ultimately, Medford Water was
able to supply sufficient water to meet customer demands thanks to a stable water supply and
water conservation efforts.
Other water providers were not as fortunate. Some southern Oregon irrigation districts were
highly impacted by the multiple-year drought, resulting in late irrigation start-ups, late rotations,
and early shut-offs in mid-July through August 1, two months earlier than normal. In some
cases, crops were not planted, yields were greatly reduced, or crop quality was poor, leaving
many property owners looking for alternative water supplies.
50
45
20-year average
Cumulative precipitation (in)
40
2021 water year
35
30
25
20
15
10 25th and 75th percentiles
5 Maximum and minimum
0
Oct Nov Dec Jan Feb Mar Apr May Jun Jul Aug Sep
Cumulative precipitation at Big Butte Springs, Oregon for the 2021 water year (yellow dashed line) and the
20-year average (red dotted line). The dark blue bars represent the 25th and 75th percentiles and the light
blue bars show the maximum and minimum cumulative precipitation in the 20-year record. Precipitation for
the 2021 water year was less than previous water years, with only about 70% of the previous 20-year average.
Source: Julie Smitherman, Medford Water.
282021 PACIFIC NORTHWEST WATER YEAR
Agriculture
Deschutes, Malheur, and Clackamas counties in Oregon and Yakima County in Washington had
numerous impacts on agriculture due to abnormally dry conditions. Dry conditions in Oregon
affected dryland and irrigated agriculture, as well as beef production through reduced forage
and stressed cattle. Crop yields and values were reduced in Klamath and Deschutes counties,
Oregon. Many respondents also reported reduced surface water availability and water right
restrictions due to abnormally dry conditions. Reports of such impacts were prevalent through-
out central and eastern Oregon into southern Washington. Thirty-one (31) survey respondents
reported impacts on agriculture and all of these impacts were due to abnormally dry conditions.
AGRICULTURE IMPACTS SURVEY
Abnormally dry
31 responses
65% 58% 55% 52% 42% 39% 35% 32% 26%
Less surface Reduced Reduced Use of backup Animal
water and crop yield pasture/forage or alternative stress
streamflow water source
available Plant stress
Declining
Water right restrictions or Reduced crop groundwater
reduced water availability value levels
Forestry
Impacts on forestry were reported throughout Oregon and Washington, with specific impacts
reported in Clackamas County in Oregon, and Okanogan and Skagit counties in Washington.
Many of the impacts
reported were related
FORESTRY IMPACTS SURVEY to the extreme heat
event in June 2021.
Abnormally dry Nineteen (19) survey
18 responses
respondents reported
impacts on forestry, 18
72% 67% 39% 33% 22% 17% 17% (95%) of which were
due to abnormally
Leaf or needle Seedling Change in Loss of dry conditions.
drop or sparse mortality timing of tree timber due to
canopy growth wildfire
Limited access Greater
Tree mortality for operations incidence of
due to wildfire disease
29Dryland Wheat 120
110
Impacts
100
Temperature (°F)
Heat and drought stress 90
led to a combined 40% 80 Maximum
reduction in winter and Minimum
70
spring wheat yield for
60
the PNW. Based on
calculations from data 50
compiled by the National 40
Agricultural Statistics
l
n
un
un
l
l
l
l
l
Ju
Ju
Ju
Ju
Ju
Ju
Ju
-J
-J
Service (NASS), the impact
2-
4-
6-
8-
-
-
12
-
10
28
26
30
Date
was most significant in
southeast Washington and
Daily temperatures at Lind, Washington during the June and
northern Idaho counties,
July 2021 heat wave. The daily maximum and minimum optima
where winter wheat yields for wheat are 75˚F and 63˚F, respectively. The daily maximum
(bushels/acre) were and minimum temperatures at which wheat becomes heat
reduced by 46% and spring stressed are 90˚F and 75˚F, respectively. The maximum
wheat yields were reduced temperatures were well above the temperatures at which heat
by 52% for the 2021 stress occurs for wheat for this time period. Source: David
calendar year from yields Huggins, USDA.
in 2020. The southeast
Washington and northern Idaho yield reductions occurred over nearly 2.73 million
acres of land planted in wheat, representing 83% of the wheatland in the PNW and a
reduction of more than 98 million bushels from 2020.
The composition, weight, and quality of the wheat yield was also affected. The
reduced wheat yield had a higher protein percentage (11.3% versus the 5-year
average of 9.7%), lower test weight (59.3 lb/bu versus the 5-year average of 61.4 lb/
bu), and overall quality (grade no. 2 rather than the usual grade, no. 1) (Idaho Wheat
Commission, Oregon Wheat Commission, Washington Grain Commission, U.S.
Wheat Associates, Wheat Marketing). Prices of wheat increased by over $2/bu from
2020 to 2021.
Conditions at the end of a given water year can affect the following year’s crop
because planting occurs in fall. Low soil water after annual fallow and a deficit
of seed-zone water can inhibit the establishment and growth of wheat. High
precipitation in some parts of the PNW during September–November 2021 aided in
the establishment of winter wheat at the time of this writing. However, above-average
winter precipitation is needed to promote soil water recharge and for wheat yield to
return to normal.
302021 PACIFIC NORTHWEST WATER YEAR
Fisheries
Impacts on fisheries were reported for Oregon (statewide and in the upper Deschutes
Basin), Washington (Yakima and Klickitat counties), and Idaho. Fourteen (14) survey
respondents reported impacts on fisheries due to abnormally dry conditions.
FISHERIES IMPACTS SURVEY
Abnormally dry
14 responses
100% 71% 64% 36% 36% 29% 21% 21%
Reduced Poor water Decreased Less food
streamflow quality due to dissolved available for
low flows oxygen fish
Timing of fish
Warmer stream Fish mortality migration Fish passage
temperatures changed blocked
Hydropower
Primary impacts on hydropower associated with abnormally dry conditions were
loss of hydropower generation due to lower streamflows across the PNW. Two
respondents reported impacts on hydropower; both reported impacts due to abnormally
dry conditions and one reported impacts due to abnormally wet conditions.
HYDROPOWER IMPACTS SURVEY
Abnormally dry
2 responses
50% 50% 50%
Reduced Lower-than-
power normal
generation reservoir
levels
Reduced
revenues
31CMOR on Drought Impacts
The main CMOR received 94 reports for the 2021 water year. Sixty of these reports
referenced Oregon, especially western Oregon, although drought severity was worse
in eastern Oregon during the 2021 water year. A large spike in reports occurred during
late June and early to mid-July, which coincided with the major heat wave in the PNW.
Most of the main CMOR reports were associated with reduced crop and livestock production.
Reports also identified impacts on public health, households, wildlife habitat, and municipal
water supply, and impacts from wildfires. Observations in Malheur County and Baker County,
Oregon, reflected the persistence of drought conditions through spring and summer, with
severe impacts reported as early as April. The two reports shown below for Malheur County
three months apart demonstrate the long lifetime and increasing severity of the drought.
“It is severely dry throughout all of
Malheur County” — 4/18/2021
“All of Malheur County is in an
extreme drought.” — 7/15/2021
During the 2021 water year, the Oregon Department of Forestry developed a supplemental
CMOR survey focused on forestry impacts in the US. Due to their outreach efforts, this
survey had numerous reports (316 total) with the vast majority reported for locations
in Oregon (293). Common impacts from these reports included discolored leaves, dead
branch tips, dead trees, excess leaf/needle drop, and sparse canopy. Reports were
steadily recorded throughout the summer of 2021, but spiked considerably on July 15
(20 reports), September 8 (35 reports), and September 9 (51 reports). Reports from the
CMOR for these days were representative of many other forestry impacts reported through
the summer of 2021, all of which implicated severe and ongoing drought conditions.
“Trees along the highway from Willapa Bay near
Ilwaco, north to at least South Bend, WA were
browned on many of the branch tips closest
to the blacktop.” — 7/15/21 PACIFIC, WA
“The big leaf maples all around were hard hit by the heat
wave and dry conditions. A lot of other landscaping has
died, even with supplemental water, the heat was just
too much for so many plants.” — 9/8/21 CLACKAMAS, OR
“Had to spend $2,000 to have more pipe added to
well so I wouldn't run out of water. I live in [the]
country and can see dying trees [that] I believe
are [from] lack of water.” — 9/9/21 LINN, OR
322021 PACIFIC NORTHWEST WATER YEAR
Recreation
Impacts on recreation were reported for areas throughout Oregon, with many counties
in north and south central Oregon highlighted. Impacts were also reported throughout
Washington, including Klickitat and King counties. Fourteen respondents reported impacts
on recreation. Of these, all fourteen (100%) reported impacts associated with abnormally
dry conditions and 1 (7%) reported impacts associated with abnormally wet conditions.
A reduction in the number of sites for recreation activities was the most commonly
reported impact. Other commonly reported impacts included a shortened river rec-
reation season and closures of recreational lands due to wildfire and wildfire smoke.
Respondents highlighted that water levels along the Willamette reservoir system, Upper
Deschutes River, and Owyhee River were so low as to limit whitewater rafting.
RECREATION IMPACTS SURVEY
Abnormally dry
14 responses
43% 36% 36% 29% 21% 14% 14%
Limited sites Shortened Shortened Closures due
for activities river recreation snow recreation to wildfire
season season smoke
Change in
Closures due visitation amount Reduced
to wildfire or timing revenue
33Drought Impacts Discussed in the Idaho Water Supply Meeting The exceptional spring drought in Idaho’s central mountains resulted in significant shortages in surface water deliveries in the Big Wood, Little Wood, Big Lost, and Little Lost River basins. Water year 2021 was the second consecutive year of drought in these basins. Under normal conditions, water deliveries typically start on May 1 and end around September 15. In 2021, storage deliveries to members of the Big Wood Canal Company ceased on June 10, when Magic Reservoir ran out of storage water. As reported in the Idaho Mountain Express on June 23, “…growers across the state are already reporting devastating crop losses. That’s especially true in south-central Idaho, where farmers and ranchers have been left reeling after Magic Reservoir was shut on June 10, just 26 days after the headgates opened. The dam usually isn’t shut off until mid-to-late September; last year it shut off Sept. 1.” According to the Natural Resources Conservation Service (NRCS), inflow into Magic Reservoir during the water year was the lowest in the 103 record of reservoir inflows. Inflows in Mackay Reservoir were the second lowest in the 105 years of observed streamflow. Mackay Dam ran out of storage water on July 20. Preliminary streamflow data provided by the NRCS also indicate that new records in minimum water year streamflow volumes were set for the Little Wood River above High Five Creek (57 year period of record) and the Little Lost River below Wet Creek near Howe (63 year period of record). Similarly, the Salmon River Canal Company south of Twin Falls, Idaho, which diverts water from Salmon Falls Creek Dam near the Idaho- Nevada border, ceased deliveries on August 22. In the larger, federally operated reservoir systems of the Boise, Snake, and Owyhee basins, lower than expected runoff and warmer than normal temperatures resulted in higher than expected demand for storage water. All three reservoir systems ended the season with minimal carryover storage for water year 2022. The rainfed agricultural region in northern Idaho also was heavily impacted by drought. National Agricultural Statistics Service (NASS) estimates indicate that chickpea yields in Idaho dropped by 45%, lentils by 25%, and peas by 21%. An experiment on the timing of planting on crop yield found that winter peas yielded 380 lb per acre (normally 3,000 lb/acre), but spring peas failed because of heat stress during the flowering stage (Kurtis Schoder, University of Idaho, personal communication). Spring wheat yield reductions were most severe in Lewis and Idaho Counties, where they dropped by 63% and 61%, respectively, in calendar year 2021 compared to 2020, based on calculations from NASS data. University of Idaho Extension reported that soft winter wheat yields in the towns of Genesee, Nez Perce, and Tammany dropped by 47%, 60%, and 45%, respectively. In some locations in northern Idaho, wheat farmers described losing entire fields of wheat. While a rise in crop prices helped offset some of the impact due to reduced yield, poor quality product reduced prices in many cases. For example, soft winter wheat grown without adequate soil moisture produces kernels with higher protein content. The Asian market for winter wheat prefers low-protein wheat. Farmers with high-protein wheat could not sell at the higher than normal prices being offered for low-protein wheat. 34
You can also read


