TRANSMISSION OUTLOOK 20-YEAR - January 31, 2022 - California ISO
←
→
Page content transcription
If your browser does not render page correctly, please read the page content below
20-YEAR
TRANSMISSION OUTLOOK

             January 31, 2022
             Draft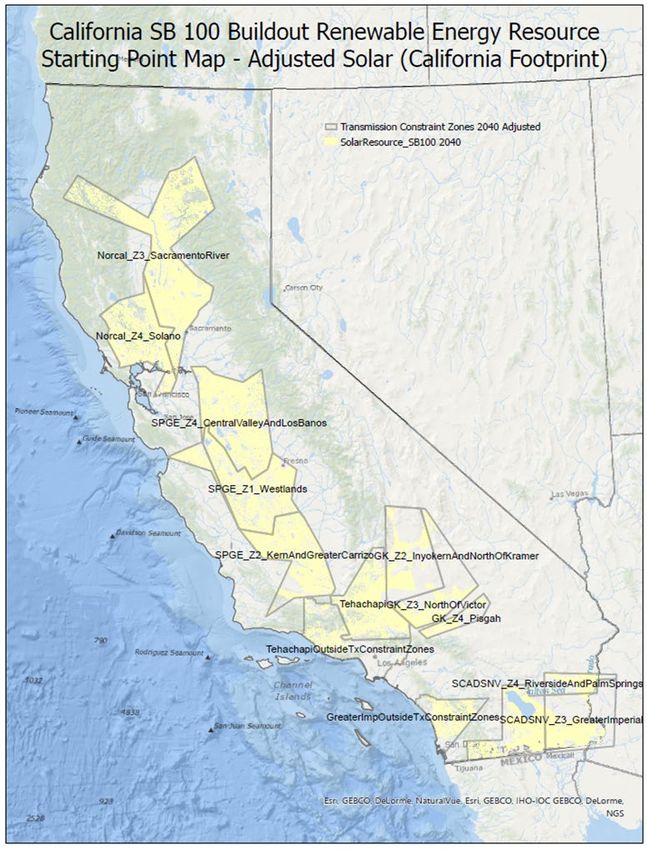
Foreword to 20-Year Transmission Outlook
Thank you for your participation in the CAISO transmission planning process, and your review
of this draft 20-Year Transmission Outlook. The development of the long-range blueprint of the
interconnected high-voltage wires was conducted in parallel with the CAISO’s customary annual
10-year Transmission planning process.
In reviewing the draft transmission plan, it is important to remember that the draft 20-Year
Outlook is structured and written as a draft and not as a final document. It is open to change
based on stakeholder input and new information as we move to finalizing the 20-Year Outlook in
March.
CAISO 20-Year Transmission Outlook January 31, 2022
Table of Contents
Executive Summary ................................................................................................................. 1
Chapter 1 ................................................................................................................................... 5
1 Introduction .................................................................................................................... 5
1.1 Purpose ........................................................................................................ 5
1.2 Challenges.................................................................................................... 5
1.3 Other Process Issues ................................................................................... 6
1.3.1 Infrastructure........................................................................................... 6
Chapter 2 ................................................................................................................................. 11
2 Coordination with State Agencies ................................................................................ 11
2.1 SB100 Workshops ...................................................................................... 11
2.1.1 Joint agency workshop on next steps to plan for SB 100
resource build – Transmission .............................................................. 12
2.1.2 Joint agency workshop on next steps to plan for SB 100
resource build – Resource Mapping ..................................................... 13
Chapter 3 ................................................................................................................................. 15
3 Process and Inputs ...................................................................................................... 15
3.1 Key Inputs................................................................................................... 15
3.1.1 Load Forecasting and Distributed Energy Resources Growth
Scenarios .............................................................................................. 16
3.1.2 Resource Planning and Portfolio Development .................................... 19
3.1.3 Natural gas fired power plants .............................................................. 20
3.1.4 Battery energy storage ......................................................................... 21
3.1.5 Long-duration energy storage............................................................... 21
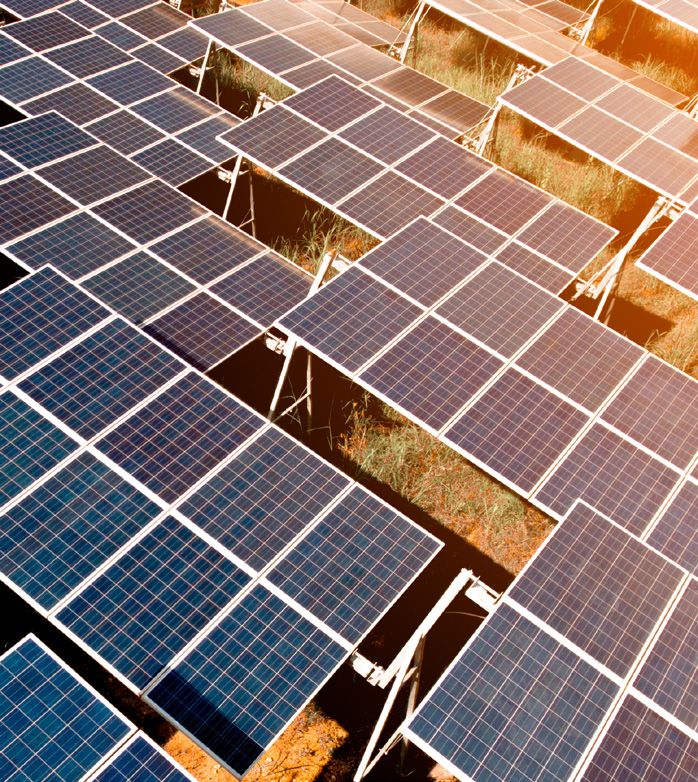
3.1.6 Utility-scale solar................................................................................... 22
3.1.7 In-state Wind......................................................................................... 23
3.1.8 Offshore Wind ....................................................................................... 23
3.1.9 Out-of-state wind .................................................................................. 25
3.1.10 Geothermal ........................................................................................... 25
Chapter 4 ................................................................................................................................. 26
4 Integration of Resources .............................................................................................. 26
3.1 Mapping of solar resources ........................................................................ 27
4.1 Offshore Wind Interconnection ................................................................... 32
4.1.1 Interconnection of Central Coast Offshore Wind .................................. 32
4.1.2 Interconnection of North Coast Offshore Wind ..................................... 33
Chapter 5 ................................................................................................................................. 35
5 High-Level Assessment ............................................................................................... 35
5.1 Introduction ................................................................................................. 35
5.2 System Data and Study Assumptions ........................................................ 36
5.2.1 Load Forecast Assumptions ................................................................. 36
5.2.2 Generation Assumptions ...................................................................... 36
California ISO/TP&ID i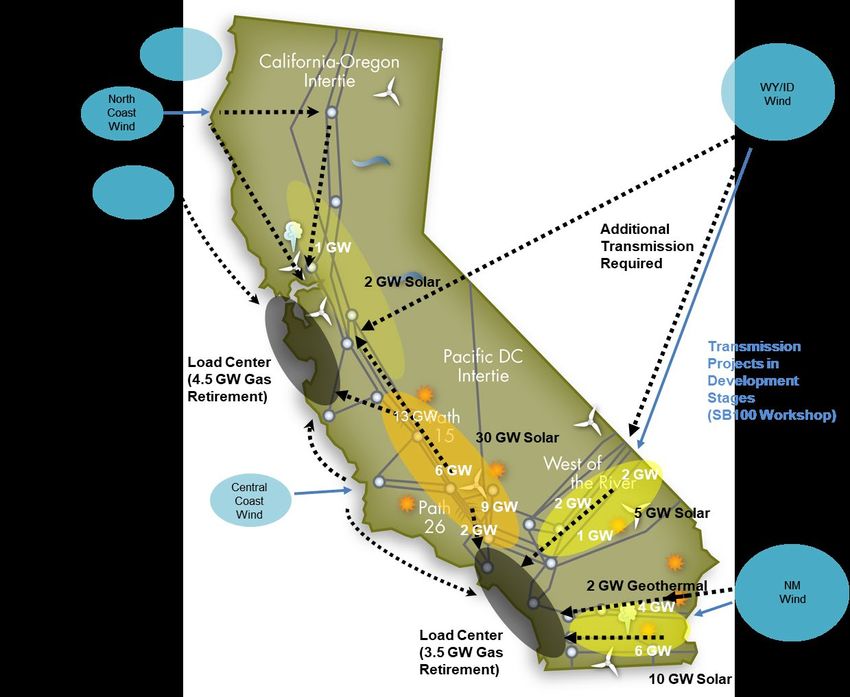
CAISO 20-Year Transmission Outlook                                                                January 31, 2022

       5.2.3          Transmission Projects .......................................................................... 37
       5.3         Study Methodology and Results ................................................................. 38
       5.3.1          Study Methodology ............................................................................... 38
       5.3.2          2040 Peak Consumption Study Results ............................................... 39
       5.3.3          2040 Net Peak Study Results ............................................................... 41
       5.3.4          2040 Off Peak Study Results................................................................ 43
       5.4         Transmission Development Alternatives .................................................... 45
       5.4.1          CAISO System Transmission Development ......................................... 45
       5.4.2          Offshore Wind Transmission Development .......................................... 50
       5.4.3          Out-of-State Wind Transmission Development .................................... 51
       5.4.4          Transmission Development Estimated Costs ....................................... 54
       5.5         Summary and Conclusions ......................................................................... 56

Appendices
Appendix A SB100 Starting Point Scenario                                                                             A-1

California ISO/TP&ID                                      ii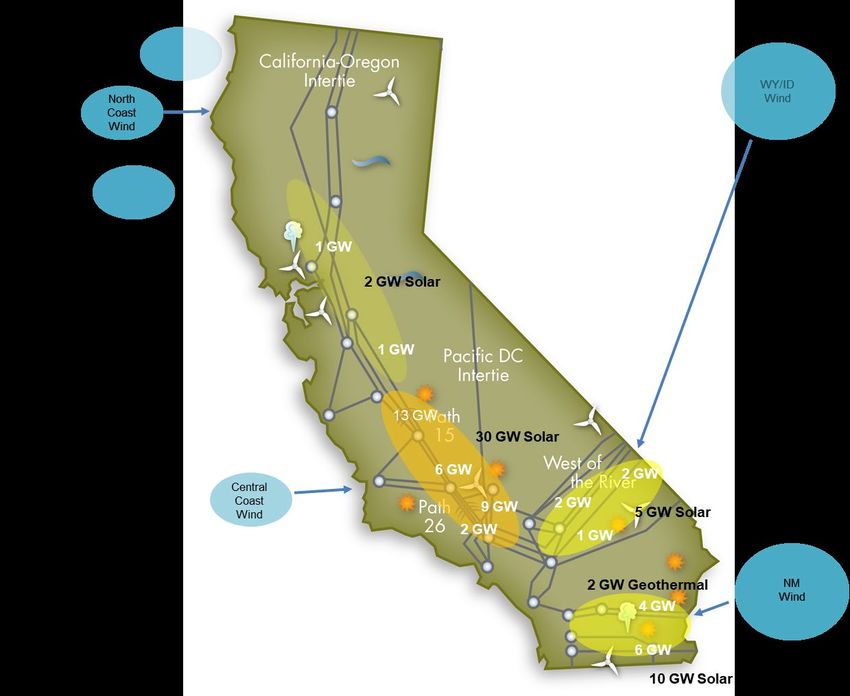
CAISO 20-Year Transmission Outlook                                            January 31, 2022

Executive Summary
California is facing an unprecedented need for new renewable resources over the next 10 to 20
years. This heightened requirement is being driven by increased customer demand for clean
energy, the continuing electrification of transportation and other industries and by the
requirements of Senate Bill 100 that renewable energy and zero-carbon resources supply 100
percent of electric retail sales to end-use customers by 2045. This transformation will not only
drive significant investment in a technologically and geographically diverse fleet of resources,
including storage, but also significant transmission to accommodate all the new capacity being
added. The transmission needs will range from high-voltage lines that traverse significant
distances to access out-of-state resources, as well as major generation pockets, including
offshore wind and geothermal resources located inside the state. Given the lead times needed
for these facilities primarily due to right-of-way acquisition and environmental permitting
requirements, the CAISO has found that a longer-term blueprint is essential to chart the
transmission planning horizon beyond the conventional 10-year timeframe that has been used
in the past.

The CAISO embarked on creating this 20-Year Transmission Outlook for the grid in
collaboration with the California Public Utilities Commission (CPUC) and the California Energy
Commission (CEC) with the goal of exploring the longer-term grid requirements and options for
meeting the State’s greenhouse gas reduction and renewable energy objectives reliably and
cost-effectively.

We also intend for this expanded planning horizon to provide valuable input for resource
planning processes conducted by the CPUC and CEC, and to provide a longer-term context and
framing of pertinent issues in the CAISO’s ongoing annual 10-Year Transmission Plan.

To achieve this, the objective of the 20-Year Transmission Outlook is to provide a long-term
conceptual plan of the transmission grid in 20 years, meeting the resource and electric load
needs aligned with state agency input on integrated load forecasting and resource planning. In
particular, it was critical that the resource planning was developed through a transparent
process, taking into account the best currently available information, including potential
transmission costs, in establishing a baseline resource profile.
This 20-year outlook for transmission planning therefore focused on meeting the needs
identified through the CEC’s SB100-related processes for achieving the state’s 2045 objectives.
The CEC, CPUC, and the CAISO, in fact, collaborated on an approach to translate the analyses
conducted for the first SB 100 joint-agency report into a Starting Point scenario for use by the
CAISO in this 20-year outlook 1. The CAISO started with the SB100 Core statewide high
electrification load projection, in which the 2040 peak load is 82,364 megawatts (MW). This is
an 18,288 MW, or 28.5 percent increase from the CEC’s Integrated Energy Policy Report
(IEPR) 2020 load forecast of 64,076 MW in 2031 2. The CAISO footprint’s share of the forecast

1 https://efiling.energy.ca.gov/Lists/DocketLog.aspx?docketnumber=21-SIT-01

2 The load forecast scenario is the CEC’s “Mid 1-in-2 forecast”

California ISO/I&OP                                               1
CAISO 20-Year Transmission Outlook January 31, 2022
load is 73,909 MW. The load to be served by the system was then again lowered by the
forecast of behind-the-meter resources.
The Starting Point then identified the resource development that could meet these needs as well
as a projected reduction of 15,000 MW of natural gas-fired generation while also providing an
effective trajectory to achieving 2045 state greenhouse gas reduction objectives. The reduction
in natural gas-fired generation enabled analysis of not only system-wide needs, but also the
local need of major load centers dependent on natural gas-fired generation for reliable service
today, and the retirement assumptions focused on age and proximity to disadvantaged
communities. To meet these needs, the Starting Point called for 37 GW of battery energy
storage, 4 GW of long-duration storage, over 53 GW of utility scale solar, over 2 GW of
geothermal, and over 24 GW of wind generation – the latter split between out-of-state and in-
state resources. The bulk of the in-state resources consist of offshore wind. These total 120.8
GW
The CAISO identified the system needs by mapping resources to the appropriate regions,
identifying the transmission additions necessary to add those resources to the grid, and then
examining the need to deliver those resources over the bulk transmission system.
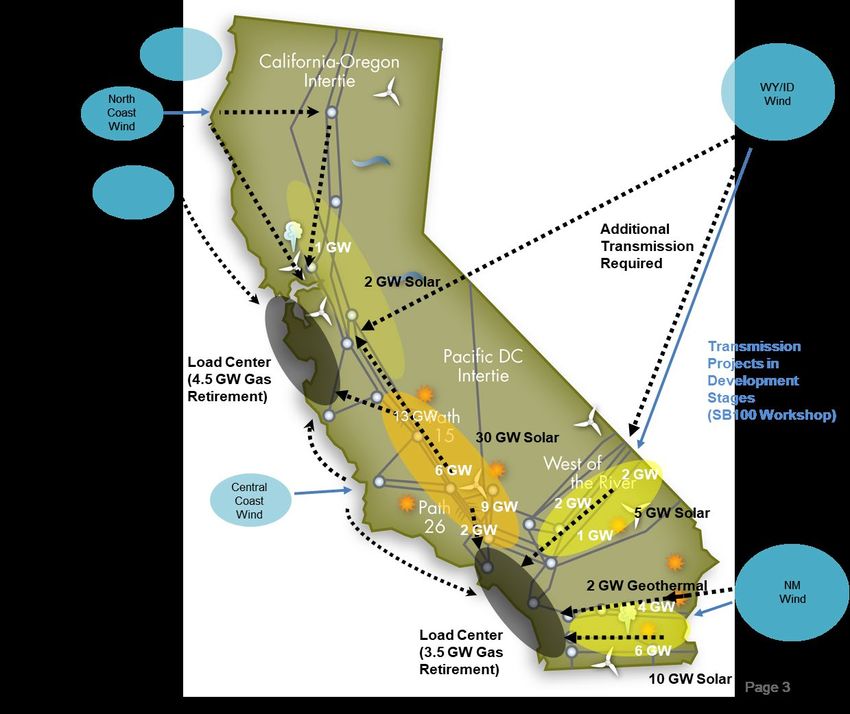
The resulting transmission plan calls for significant 500 kV AC and HVDC development to
access offshore wind and out-of-state wind, and reinforce the existing CAISO footprint. Figure
ES-1 provides an illustrative diagram of the transmission development required to integrate the
resources of the SB100 Starting Point scenario and high electrification load projection by 2040.
ES-1: Illustrative Diagram of Transmission Development
California ISO/I&OP 2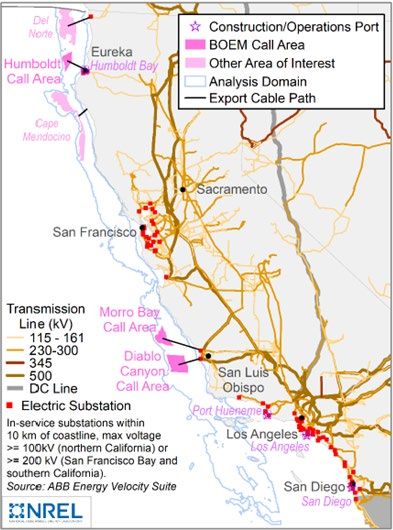
CAISO 20-Year Transmission Outlook                                                                         January 31, 2022

Table ES-1: provides the high-level summary of the transmission development required for
upgrades to the existing CAISO footprint, offshore wind integration and out-of-state wind
integration.
 Table ES-1:         Cost estimate of transmission development to integrate resources of SB100 Starting
                                                Point scenario

                                                                                                              Estimated Cost
 Transmission Development
                                                                                                                 ($ billions)

 Upgrades to existing CAISO footprint consisting of:
      •    230 kV and 500 kV AC lines                                                                            $ 10.74 B
      •    HVDC lines
      •    Substation upgrades

 Offshore wind integration consisting of:
     • 500 kV AC lines                                                                                            $ 8.11 B
     • HVDC lines

 Out-of-state wind integration consisting of:
     • 500 kV AC lines                                                                                           $ 11.65 B
     • HVDC lines

 Total estimated cost of transmission development 3                                                               $ 30.5 B

This analysis focuses on the high-voltage bulk transmission, and that local transmission needs
will ultimately need to be addressed as well.
The transmission additions are significant investments, and for a number of these additions,
lead times of eight to 10 years are reasonable or even optimistic. This highlights the need for
longer-term decisions to be made and development activities to be initiated in the annual
transmission planning processes, and the CAISO will be working with state agencies and
stakeholders to refine these options to develop the most cost-effective solutions to meet
California’s reliability and clean-energy objectives.
The 20-Year Outlook provides a baseline to establish expectations for longer-term planning,
recognizing that resource planning and procurement decisions will differ over the years ahead
from the assumptions used to establish this baseline. Those changes will be managed by
adapting future plans around the baseline architecture in subsequent updates, and in the
CAISO’s annual transmission planning processes that approve and initiate specific projects.
The CAISO also expects to conduct additional stakeholder dialogue through 2022 about next
steps as well as the long-term architecture set out in this 20-Year Outlook.

3 These values represent the capital cost of the identified projects; several are currently being developed under a subscriber model
– with the transmission costs incorporated into the energy costs – and not rate-base projects receiving cost-of-service cost recovery
that would be added to CAISO transmission access charges.

California ISO/I&OP                                               3
CAISO 20-Year Transmission Outlook                                            January 31, 2022

Finally, this effort could not have been undertaken without the collaboration and support of the
CPUC and CEC, and the CAISO appreciates the efforts of both organizations in supporting the
development of this document.

California ISO/I&OP                             4
CAISO 20-Year Transmission Outlook                                              January 31, 2022

Chapter 1
1 Introduction
1.1 Purpose
The 20-Year Transmission Outlook for the CAISO grid explores the longer-term grid
requirements and options for meeting the State’s greenhouse gas reduction and renewable
energy objectives reliably and cost-effectively.

The outlook provides:

   •   A transparent process to develop transmission information responsive to supporting and
       informing the CPUC’s Integrated Resource Planning processes, the CEC’s Integrated
       Energy Policy Report and the joint agencies’ SB100 efforts.
   •   Longer-term context for and framing of issues in the 10- Year Transmission Plan
The CAISO launched the effort to develop a 20-year outlook for the CAISO grid in parallel with
the 2021-2022 transmission planning cycle to provide a less structured framework for open
discussion outside of the tariff-based 10-Year Transmission Plan that focuses on transmission
project needs and approvals over the 10 year planning horizon. The 20-year outlook is not a
tariff-based project approval process that focuses on project approvals. Instead, it is meant to
engage with stakeholders in more informal yet meaningful discussion.

A number of current circumstances call for this effort to be launched at the present time.
Resource requirements to meet state policy goals and reliability needs are climbing sharply over
the next 10 years from the pace established over the last five years, and the pace will escalate
again for the following decade. This acceleration will stress all aspects of the resource
planning, procurement, engineering, supply chain and construction. It will also accelerate the
need for new transmission approvals, permitting and construction.

The 20-year outlook provides a baseline to establish expectations for longer-term planning,
recognizing that resource planning decisions and procurement decisions will differ over the
years ahead from the assumptions used to establish this baseline. Those changes will be
managed by adapting future plans around the baseline architecture in future updates, and in the
CAISO’s annual transmission planning processes that approve and initiate specific projects.

1.2 Challenges
Senate Bill (SB) 100 establishes a policy that renewable and zero-carbon resources supply 60
percent of California’s retail sales and electricity procured to serve all state agencies by 2030,
and 100 percent by 2045.

California ISO/I&OP                              5
CAISO 20-Year Transmission Outlook January 31, 2022 These goals are in addition to those established earlier via Senate Bill (SB) 350 4 and update the 2030 renewables goal. SB 350 set the requirement to achieve the 2030 greenhouse gas reduction targets established by the California Air Resources Board (CARB), in coordination with the California Public Utilities Commission (CPUC) and California Energy Commission (CEC) that would also meet or exceed the current 2030 renewables portfolio standard requirement established by SB 100 5. It is also critical that goals focused on 2030 objectives reasonably establish a trajectory to meeting 2045 renewables portfolio standard goals that were also established in SB 100. The CAISO relies extensively on coordination with the state energy agencies for resource planning input, in particular with the CPUC, which takes the lead role in developing resource forecasts for the 10-year planning horizon and with input from the CEC and the CAISO. In looking beyond the 10-year horizon, the CEC takes a more central role in establishing forecast resource requirements via the analysis the CEC leads pursuant to its SB 350 responsibilities. The CAISO turned to the two state agencies for input to support the development of the 20-year outlook. The assumptions include demand, supply, and system infrastructure elements, including the renewables portfolios, and are discussed in more detail in section three. . 1.3 Other Process Issues 1.3.1 Infrastructure In the over 10 years since the CAISO redesigned its transmission planning process and subsequently adapted it to meet FERC Order No. 1000 provisions, the challenges placed on the electricity system – and correspondingly on the transmission system - have evolved and grown. While these challenges appeared significant in the past and at the time, the CAISO considers that the industry is at an inflection point marking a significant increase in the rate of growth in renewable resources and renewable integration resources. Last year’s transmission plan was based on state agency-provided forecasts calling for approximately 1,000 MW of additions per year over the next 10 years. This year’s plan is based on a 10-year projection adding 2,700 MW per year, and current drafts being proposed for next year’s plan call for over 4,000 MW per year 6. This latter value represents a fourfold increase in annual requirements from the 2020- 2021 Transmission Plan approved in March, 2021. The 2021-2022 transmission plan will 4 SB 350, The Clean Energy and Pollution Reduction Act of 2015 (Chapter 547, Statutes of 2015) was signed into law by Governor Jerry Brown on October 7, 2015. Among other provisions, the law established clean energy, clean air, and greenhouse gas (GHG) reduction goals, including reducing GHG to 40 percent below 1990 levels by 2030 and to 80 percent below 1990 levels by 2050. The law also established targets to increase retail sales of qualified renewable electricity to at least 50 percent by 2030 that have now been superseded by the provisions of Senate Bill (SB) 100. 5 SB 100, the 100 Percent Clean Energy Act of 2018, also authored by Senator Kevin De León, was signed into law by Governor Jerry Brown on September 10, 2018. Among other provisions, SB 100 built on existing legislation, including SB 350, and revised the previously established goals to achieve the 50 percent renewable resources target by December 31, 2026, and to achieve a 60 percent target by December 31, 2030. The bill also set out the state policy that eligible renewable energy resources and zero-carbon resources supply 100 percent of retail sales of electricity to California end-use customers and 100 percent of electricity procured to serve all state agencies by December 31, 2045. https://leginfo.legislature.ca.gov/faces/billNavClient.xhtml?bill_id=201720180SB100 6 Page 11, Day 2 Presentation, September 27-28, 2021 Stakeholder Meeting, http://www.caiso.com/InitiativeDocuments/Day2Presentation-2021-2022TransmissionPlanningProcessSep27-28-2021.pdf California ISO/I&OP 6
CAISO 20-Year Transmission Outlook                                                                    January 31, 2022

provide a transitional step recognizing the CAISO and industry at large are not yet positioned
inside the current planning cycle to address the full impact of this pivot to the new challenges.
The accelerating resource requirements over the next 10 years are driven by a number of
circumstances, including the escalating need to decarbonize the electricity grid in light of
emerging climate change impacts, the expected electrification of transportation and other
carbon-emitting industries driving higher electricity forecasts, concerns regarding reduced
access to imports as neighboring systems also decarbonize, higher than anticipated impacts of
peak loads shifting to later-day hours when solar resources are not available, and the need to
maintain system reliability in light of retiring gas-fired generation relying on coastal waters for
once-through cooling and the Diablo Canyon Power Plant. These resource requirements, on the
path to total decarbonization of the grid, will call for greater volumes of solar photovoltaic
resources and battery storage, as well as greater diversity beyond the current focus on those
resource types. Geothermal resources, out-of-state resources and offshore resources all are
expected to play greater roles, and create unique challenges in the planning and
interconnection processes. Meeting those challenges requires adaptations and enhancements
to existing processes and efforts. At the same time as this shift in longer-term resource
requirements was being established, the CPUC authorized more mid-term procurement in its
June 24, 2021 decision than last year’s 10-year plan was based on, and which was the largest
single procurement authorization by the CPUC. Responding to these signals and previously
approved authorizations, the resource development industry came forward with a record-setting
number of new interconnections requests in April, 2021, with 373 new interconnection requests
being received in the ISO’s Cluster 14 open window, layered on top of an already heavily
populated interconnection queue. 7 The 605 projects totaling 236,225 MW now in the queue
exceeds mid-term requirements by an order of magnitude. This level of hyper competition
actually creates barriers to moving forward effectively with the resources that do need to be
added to the grid, and commandeers precious planning, engineering and project management
resources from the ISO and transmission owners.
In parallel with enhancements in the transmission planning process, enhancements are also
being pursued in the coordination of state agency resource planning processes as well as the
CAISO’s resource interconnection process, and in the overall coordination of the procurement
and construction of new resources and related transmission network upgrades.
Transmission Planning:
In addition to the incremental improvements the CAISO makes in each year’s transmission
planning cycles, the CAISO has re-examined the effectiveness of certain planning processes
both due to emerging concerns in our own footprint, and also in response to the recent FERC
Advance Notice of Proposed Rulemaking (ANOPR) regarding transmission planning, cost
allocation and generator interconnection.

7 ISO Board of Governors July 7, 2021 Briefing on renewable and energy storage in the generator interconnection queue,
http://www.caiso.com/Documents/Briefing-Renewables-GeneratorInterconnection-Queue-Memo-July-2021.pdf

California ISO/I&OP                                            7
CAISO 20-Year Transmission Outlook                                                                          January 31, 2022

The CAISO noted in its comments responding to the ANOPR 8 that the “CAISO’s existing
transmission planning and generator interconnection processes reflect many of the reforms and
concepts discussed in the ANOPR. That being said, the CAISO has escalating challenges
arising from existing supply conditions, the need to accelerate and then sustain the pace of
procurement and interconnection to meet climate goals, and an “overheated” generation
interconnection queue. Accordingly, the CAISO must “get in front” of these issues and move
forward with transmission planning and generation interconnection process enhancements
ahead of the likely timeline for any Final Rule in this proceeding.” Enhancements and
improvements to the CAISO regional transmission planning processes are already moving
forward, such as the introduction of the 20-year outlook framework that it is outside of the tariff-
based project approval planning process, and other enhancements that do not require tariff
changes to implement.
The CAISO also acknowledged that the interregional coordination process has not met
expectations and that there are opportunities to remove certain barriers, foster collaboration with
state regulators, and promote more rigor in, and reporting on, interregional coordination efforts.
Accordingly the CAISO is exploring a few alternative courses of action to explore potential
interregional opportunities in addition to meeting all expectations, responsibilities and
obligations associated with the CAISO tariff provisions related to FERC Order No.1000
interregional coordination. The CAISO also intends to continue to participate in the ANOPR
process and seek broader reforms within that process as well.
Resource Interconnection:
Consistent with the CAISO comments responding to the ANOPR, the CAISO has initiated a
2021 Interconnection Process Enhancement initiative focused on the interconnection process
and enhancements specifically, and other tracks of process improvement will proceed through
other efforts. Accordingly, the 2021 IPE initiative is discussing and addressing interconnection-
related issues the CAISO and stakeholders have identified given current circumstances, and
seeks to resolve concerns that have surfaced since the last IPE initiative in 2018. 9 The CAISO
seeks to consider potential changes to address the rapidly accelerating pace of new resources
needing connection to the grid to meet system reliability needs and exponentially increasing
levels of competition among developers resulting in excessive levels of new interconnection
requests being received.
Procurement and Project Execution:
In addition to the above processes, the CAISO is also taking on additional efforts to
     -    Coordinate with the CPUC, CEC, and GO-Biz office to identify and help mitigate issues
          that could delay new resources meeting in-service dates.

8 COMMENTS OF THE CALIFORNIA INDEPENDENT SYSTEM OPERATOR CORPORATION ON ADVANCE NOTICE OF
PROPOSED RULEMAKING, submitted October 12, 2021, FERC Docket No. RM21-17-000, Building for the Future Through Electric
Regional Transmission Planning and Cost Allocation and Generator Interconnection http://www.caiso.com/Documents/Oct12-
2021-Comments-AdvanceNoticeOfProposedRulemaking-BuildingTransmissionSystemoftheFuture-RM21-17.pdf
9 For more information on the 2018 IPE initiative please refer to the initiative webpage at: California CAISO - Interconnection
process enhancements (caiso.com).

California ISO/I&OP                                               8
CAISO 20-Year Transmission Outlook January 31, 2022
- Together with the CPUC, working with the participating transmission owners to improve
the transparency of the status of transmission projects focusing on network upgrades
approved in prior CAISO transmission plans, or that resources with executed
interconnection agreements are dependent on.
- Providing more information publicly regarding where resources are able to connect to
the grid with no or minimal network upgrade requirements, to assist load serving entities
to shape their procurement activities towards areas and resources that are better
positioned to achieve necessary commercial operation dates.
- Coordinating with CPUC regarding the progress of procurement activities by load
serving entities and assessing the timeliness of those procured resources meeting near
and mid-term reliability requirements.
These enhancements and coordination efforts will collectively support and enable the state
reaching its renewable energy objectives reliably.
California ISO/I&OP 9CAISO 20-Year Transmission Outlook January 31, 2022
Intentionally left blank
California ISO/I&OP 10CAISO 20-Year Transmission Outlook January 31, 2022
Chapter 2
2 Coordination with State Agencies
The development of the 20-Year Transmission Outlook has been coordinated with the 2021-
2022 transmission planning process along with the initiatives of the California Energy
Commission and the California Public Utilities Commissions. These have included CAISO
stakeholder calls and joint agency workshops as a part of the SB100 process.
Figure 1.3-1: 20-Year Transmission Outlook coordination with other initiatives and agencies
On September 13, 2022 the California Energy Commission docketed the SB100 Starting Point
for the CAISO 20-Year Transmission Outlook.
2.1 SB100 Workshops
The CAISO has coordinated with the joint agencies on the next steps to plan for the SB100-
driven resource build that has been used as inputs to the 20-Year Transmission Outlook. These
steps have included workshops on potential transmission projects and resource mapping. 10
The CAISO actively participated in the following joint agency workshops:
10 https://www.energy.ca.gov/sb100/sb-100-events-and-documents
California ISO/I&OP 11CAISO 20-Year Transmission Outlook January 31, 2022
• June 2, 2021 Joint agency workshop on next steps to plan for SB 100 resource
build
• July 22, 2021 Joint agency workshop on next steps to plan for SB 100 resource
build – Transmission
• August 12, 2021 Joint agency workshop on next steps to plan for SB 100 resource
build – Resource Mapping
2.1.1 Joint agency workshop on next steps to plan for SB 100 resource build –
Transmission 1112
The CAISO participated in the CEC joint agency workshop on July 22, 2021 with the focus on
transmission currently under various stages of development that should be considered to
facilitate the integration of the resource by 2040. Workshop presentations were made on the
following transmission projects by the project developers, 13 with the projects being presented
primarily to facilitate the integration of out-of-state wind into the CAISO system:
• Pacific Transmission Expansion Project
• North Gila Imperial Valley #2 Transmission Project
• TransWest Express Transmission Project
• Southwest Intertie Project (SWIP) North
• Cross Tie Project
• Sunzia Southwest Transmission Project
• Starwood Energy – Ten West
• Southline Transmission
• Lucky Corridor Transmission Project
• GridLiance West
11 https://www.energy.ca.gov/event/workshop/2021-07/session-1-joint-agency-workshop-next-steps-plan-senate-bill-100-resource
12 https://www.energy.ca.gov/event/workshop/2021-07/session-2-joint-agency-workshop-next-steps-plan-senate-bill-100-resource
13 https://www.energy.ca.gov/sites/default/files/2021-
07/July%2022%20Workshop%20SB%20100%20Transmission_Master%20v4.pdf
California ISO/I&OP 12CAISO 20-Year Transmission Outlook January 31, 2022
Figure 2.1-1: Illustration of potential transmission projects identified at CEC SB100 workshop
2.1.2 Joint agency workshop on next steps to plan for SB 100 resource build –
Resource Mapping 14
The CEC jointly conducted a workshop with the CPUC and the California ISO to discuss an
approach to examine potential environmental and land-use implications of developing
renewable energy resources required to achieve the goals of Senate Bill 100 (SB 100).
The purpose of the workshop was to present and solicit stakeholder feedback on the methods
and data to be used for developing the resource mapping of the Starting Point scenario to be
provided to the CAISO for use in the 20-Year Transmission Outlook, taking into consideration
environmental and land use data.
14 https://www.energy.ca.gov/event/workshop/2021-08/joint-agency-workshop-next-steps-plan-senate-bill-100-resource-build
California ISO/I&OP 13CAISO 20-Year Transmission Outlook January 31, 2022
Intentionally left blank
California ISO/I&OP 14CAISO 20-Year Transmission Outlook January 31, 2022
Chapter 3
3 Process and Inputs
The objective of CAISO’s 20-Year Transmission Outlook is to explore longer-term grid
requirements and options for meeting the state’s greenhouse gas reduction goals reliably. The
20-Year Transmission Outlook will provide a “baseline” vision for future planning activities. To
achieve this, the CAISO:
• Used a “Starting Point” resource development scenario developed through the CEC
SB100-related activities that considers:
– Diverse resources known to require transmission development such as offshore
wind energy, out-of-state resources, and geothermal resources; and,
– Gas power plant retirements that may require transmission development to
reduce local area constraints.
• Developed conceptual transmission system additions and conducted high-level technical
studies to test feasibility of these alternatives, focusing on the bulk transmission system.
This basis for the 20-year outlook will help scope the challenges the electricity industry faces in
meeting California’s aggressive climate policies, allow the state to further refine long-term
resource planning inputs, and provide longer-term context for decisions made in the CAISO’s
10year transmission planning process.
The high-level analysis to determine feasible transmission alternatives considered load scaled
to high electrification levels and bulk system power flow assessment case development of a
range of load periods.
Particular focus was applied to conducting a high-level assessment of local area (focus on Bay
Area and LA Basin) needs with gas retirement, building off of past informational studies
conducted in recent CAISO transmission planning studies and other technical studies.
3.1 Key Inputs
This section provides background and detail on key load and resource forecast inputs into the
20-year outlook process.
SB 100 requires the CEC, CPUC, and California Air Resources Board to develop and submit a
joint-agency report to the Legislature by January 1, 2021, and at least every four years
thereafter. The CEC, CPUC, and the CAISO collaborated on an approach to translate the
analyses conducted for the first SB 100 joint-agency report into a Starting Point scenario for use
by the CAISO in the 20-year outlook 15. The Starting Point scenario, and the criteria for using
that scenario to study the transmission required for a particular portfolio of resources studied in
the 2021 SB 100 Report, are described below. This initial portfolio is not an endorsement of any
15 https://efiling.energy.ca.gov/Lists/DocketLog.aspx?docketnumber=21-SIT-01
California ISO/I&OP 15CAISO 20-Year Transmission Outlook January 31, 2022 particular resource or potential transmission solution. The CEC and CPUC expect that the information from the 20-year outlook will help inform future electric sector planning, including the next SB 100 joint-agency report. 3.1.1 Load Forecasting and Distributed Energy Resources Growth Scenarios The CAISO 20-Year Transmission Outlook assessed the CAISO transmission system in the year 2040. The Starting Point scenario is largely based on the 2021 SB 100 Report Core (SB 100 Core) scenario, which also assumes high electrification of load. The CAISO used the same high electrification load assumption in the 20-Year Transmission Outlook; however the transmission planning studies require the modeling of detailed load information the joint agencies did not have. Specifically, the transmission planning studies need the geographic location where loads increase and the load profiles. To overcome this challenge, the CAISO developed an approach to apply the high electrification load assumption in the SB 100 Core scenario to the 20-Year Transmission Outlook. The CAISO started with the SB 100 Core statewide high electrification load projection of 82,364 MW in 2040. The load forecast from the CEC 2020 IEPR for 2031 Mid-Mid (1-in-2 weather) scenario for the total coincident statewide load is 64,076 MW. This is an 18,288 MW (28.5 percent) increase from the IEPR 2020 load forecast in 2031 to the high electrification forecast base of the SB 100 Core scenario in 2040. The CAISO then scaled the load in California up at each load bus in the 2031 base case by 28.5 percent. The CAISO and joint agencies recognize that an across-the-board scaling was a simplifying assumption due to the lack of a detailed high electrification forecast with sufficient granularity necessary for transmission modeling. In actuality, electrification may result in uneven increases in loads at individual buses, dependent on the geographic distribution of the end-uses that are electrified. For the high-level assessment and technical studies of the bulk transmission system (500 kV and 230 kV) within the 20-Year Transmission Outlook, it is expected that the even upscaling of bus bar loads provides representative results. It is expected, based on the SB 100 Core scenario, that the total behind-the-meter PV (BTM- PV) in the state of California to reach 33,807 MW in year 2040. Within the technical studies of the 20-year outlook, the following three study cases were assessed: • Peak consumption; • Net peak, and; • Off-peak loading conditions. The above assumptions on statewide peak load of 82,364 MW in 2040 along with hourly CEC load profile in year 2030 are used to estimate the load and behind-the-meter PV generation for the three study cases. Figure 3.1-1 provides hourly power consumption in California in per unit of the peak load. In this study the same profile is assumed in different areas of the state and therefore load across the state is scaled to the required levels. California ISO/I&OP 16
CAISO 20-Year Transmission Outlook                                              January 31, 2022

          Figure 3.1-1: CEC 2020 IEPR California state annual hourly load profile for 2030

Figure 3.1-2 provides the hourly behind-the-meter generation in California in per unit of the
installed capacity. In this study, the same profile is assumed in different areas of the state and
therefore behind the meter generation across the state is scaled to the required levels.

California ISO/I&OP                              17
CAISO 20-Year Transmission Outlook January 31, 2022
Figure 3.1-2: CEC 2020 IEPR behind-the-meter hourly profile for 2030
California Hourly Behind-the-Meter Generation based on CEC 2030 hourly Load Forecast
0.9
Hourly BTM-PV Generation Profile in Per Unit of the Installed Capacity
0.8
0.7
0.6
0.5
0.4
0.3
0.2
0.1
0
The following table provides a summary of the load, installed BTM-PV capacity and the BTM-PV
generation in the state as well as the CAISO system.
Table 3.1-1: Load and installed behind-the-meter solar forecast
Load and Installed BTM-PV State 1 CAISO 2
CEC peak consumption forecast in 2031 64,076 3 57,498 4
SB-100 peak consumption in 2040 82,364 5 73,909 7
BTM-PV installed capacity in CEC 2031 forecast 25,092 7 22,655 4
BTM-PV in SB-100 in 2040 33,807 6 30,336 7
1
State load is 1-in-2 peak load
2
CAISO load refers to the 1-in-5 load in areas SDG&E (area 22), SCE (area 24), and PG&E (area 30). Note that
while area 30 is named PG&E in our study cases, it also includes the load of SMUD and other balancing
authorities that are geographically located in northern California.
3
as per CEC 2020 IEPR
4
as per 2021-2022 TPP studies
5
20-year outlook study assumptions
6
CEC forecast for 2040
7
These values are calculated assuming that the 1-in-5 CAISO load and the CAISO BTM-PV are 90 percent of the
1-in-2 state load and the state BTM-PV installed capacity.
California ISO/I&OP 18CAISO 20-Year Transmission Outlook January 31, 2022
Table 3.1-2 provides the load (consumption) and the BTM-PV generation for the three study
cases. The values are calculated based on the profiles discussed and shown in figures 1 and 2
above.
Table 3.1-2: Load and BTM-PV
Load BTM-PV Generation
Study Cases Date/Time assumption
(MW) (MW)
Peak Consumption (SSN) 9/2/2040 3 pm 73,909 18,966
Net peak load (HSN) 9/2/2040 7 pm 65,199 ~0
Off peak 4/6/2040 1 pm 34,851 23,114
3.1.2 Resource Planning and Portfolio Development
The Starting Point scenario was developed by taking the 2040 SB 100 Core scenario and
increasing assumed natural gas power plant retirements to 15,000 MW. This allows for an
evaluation of the impact of more gas power plant retirements on the transmission system than
was identified in the SB 100 Core scenario, in conjunction with bringing new energy storage and
renewable energy resources online. Additionally, to generally offset the additional assumed
natural gas power plant retirements, geothermal, offshore wind, out-of-state wind and battery
energy storage systems capacity was added to levels that are generally reflective of other 2021
SB 100 Report scenarios.
Table 3.1-3 provides the base resource portfolio provided by the CPUC for use in the 2021-
2022 transmission planning process for the year 2031 and the resource portfolio of the SB100
Starting Point scenario used in the 20-Year Transmission Outlook.
Table 3.1-3: Resource assumptions in 2021-2022 transmission planning process for 2013 and the
SB100 starting point scenario for 2040
2021-2022 TPP Base Portfolio for 2040 Starting Point Scenario
Resource Type
2031 (MW) (MW)
Natural gas fired power plants 0 (15,000)
Battery energy storage 9,368 37,000
Long-duration energy storage 627 4,000
Utility-scale solar 13,044 53,212
In-state wind 1918 2,237
Offshore wind 0 10,000
Out-of-state wind 2,087 16 12,000 17
Geothermal 651 2,332
16 1,062 MW on new transmission and 1,025 MW on existing transmission.
17 9,900 MW on new transmission and 2,100 MW on existing transmission.
California ISO/I&OP 19CAISO 20-Year Transmission Outlook January 31, 2022
3.1.3 Natural gas fired power plants
The SB100 Starting Point scenario includes an assumption that 15,000 MW of natural gas
power plant capacity would be retired by 2040. The Starting Point scenario did not specifically
identify which resources should be retired and provided a criteria to select the resources
assumed to be retired in the assessment as follows.
• That the oldest natural gas power plants retire first, with a priority on those that are in
and adjacent to disadvantaged communities (DAC).
o Disadvantaged communities are defined and identified by the California Office of
Environmental Health Hazard Assessment and are available in the
CalEnviroScreen 3.0 webtool. 18
o For purposes of this Starting Point scenario a DAC adjacent community is within
a 2.5-mile radius of a natural gas power plant.
• At least 3,000 MW of the 15,000 MW of retirements are assigned to gas power plants
that rely on the Aliso Canyon storage facility as provided by the agencies, with a priority
on the oldest power plants and those that are in and adjacent to DACs.
For the 20-Year Transmission Outlook, the CAISO assessed approximately 15,000 MW of gas-
fired generation retired in the CAISO system. There is approximately 2,000 MW of gas-fired
generation connected to the CAISO system that rely on the Aliso Canyon storage facility as
provided by the agencies.
Applying the age, DAC and DAC-adjacent criteria with the 2,000 MW of gas-fired generation in
the CAISO system relying on Aliso Canyon, the following is retirement of gas-fired generation by
local capacity area:
Table 3.1-4: Assumed gas-fired generation retired by local capacity area
Local Capacity Area Capacity
(MW)
Greater Bay Area 4427
Sierra 153
Stockton 361
Fresno 669
Kern 407
LA Basin 3,632
Big Creek-Ventura 695
San Diego-IV 131
CAISO System 3,933
Total 14,408
18 https://oehha.ca.gov/calenviroscreen/report/calenviroscreen-30.
California ISO/I&OP 20CAISO 20-Year Transmission Outlook January 31, 2022
There is approximately the following gas-fired generation outside CAISO identified in DAC and
DAC 2.5 adjacent based upon the data provided by the state agencies.
• 3.8 GW within a DAC
• 0.6 GW within DAC 2.5 adjacent.
The agencies also identified approximately 2,000 MW of gas-fired generation connected outside
of the CAISO system that rely on the Aliso Canyon storage facility with allow the resources
identified being within a DAC or DAC 2.5 adjacent.
3.1.4 Battery energy storage
The SB100 Starting Point scenario identified 37,000 MW of battery energy storage resources in
2040. The approach used for assigning battery energy storage to transmission zones for the 20-
year transmission outlook utilizes the approach applied to battery energy storage in the CPUC’s
IRP process for the CAISO’s 2021-2022 transmission planning process.
The 37,000 MW of selected battery energy storage is allocated as follows:
• 9,368 MW of battery storage already allocated in the IRP resource portfolio for the 2021-
2022 TPP base case has been carried over without any changes.
• The remaining battery energy storage were to be allocated by expanding upon the
approach from the 2021-2022 TPP base case:
o Co-locate in transmission zones where renewable resources are concentrated.
o Allocate battery storage based on system needs identified in the study.
3.1.5 Long-duration energy storage
The SB100 Starting Point scenario identified 4,000 MW of long duration energy storage
resources in 2040. The long-duration energy storage in the SB 100 Core scenario was to be
allocated by building off the current 2021-2022 transmission planning process base case as well
as current commercial interest.
The 4,000 MW of LDES was to be allocated by:
• 627 MW of pumped hydroelectric already mapped in the IRP resource portfolio for the
2021-2022 TPP base case.
• 2,400 MW of pumped hydroelectric as described in the current CAISO interconnection
queue.
• 1,600 MW of location unconstrained LDES that is unassigned should be assigned to
transmission zones based on a combination of geologic and technological factors and
system needs.
California ISO/I&OP 21CAISO 20-Year Transmission Outlook January 31, 2022
3.1.6 Utility-scale solar
The Starting Point scenario identified 53,212 MW of utility-scale solar resources in 2040. In
allocating the utility-scale solar to the transmission zones, the Starting Point scenario utilizes
known commercial interest to allocate solar development to transmission zones rather than
carrying forward the allocations made by the RESOLVE model. In addition the CEC utilized a
high-level environmental screen to assess whether the commercial interest allocation had
resulted in a clearly disproportionate assignment of solar build out to any of the transmission
zones relative to the availability of “lower implication” land in each zone.
Figure 3.1-3 shows the in-state transmission zones as a starting point for where solar might be
developed based on the re-allocation of solar based on commercial interest.
Figure 3.1-3: SB100 Starting Point Solar in Transmission Zones
California ISO/I&OP 22CAISO 20-Year Transmission Outlook January 31, 2022
The 53,212 MW installed capacity of utility-scale solar identified SB100 Starting Point scenario
was allocated to the following transmission zones in Table 3.1-5.
Table 3.1-5: Solar resource allocation to transmission zones
Resource Transmission Zone Capacity (MW)
Greater_Imperial_Solar SCADSNV_Z3_GreaterImperial 6,407
Inyokern_North_Kramer_Solar GK_Z2_InyokernAndNorthOfKramer 2,162
Kern_Greater_Carrizo_Solar SPGE_Z2_KernAndGreaterCarrizo 6,154
North_Victor_Solar GK_Z3_NorthOfVictor 674
Sacramento_River_Solar Norcal_Z3_SacramentoRiver 998
Solano_Solar Norcal_Z4_Solano 169
Tehachapi_Solar Tehachapi 9,544
Westlands_Solar SPGE_Z1_Westlands 12,655
Pisgah_Solar GK_Z4_Pisgah 674
RiversideAndPalmSprings Solar RiversideAndPalmSprings 4,922
CentralValleyAndLos Banos Solar CentralValleyAndLosBanosSolar 1,079
Tehachapi Outside of Constraint Zones Tehachapi Outside of Constraint Zones 2,066
Greater ImpOutside Constraint Zones 995
Mountain_Pass_El_Dorado_Solar Mountain_Pass_El_Dorado 248
Southern_Nevada_Solar SCADSNV‐GLW_VEA 2,024
Arizona_Solar SCADSNV‐Riverside_Palm_Springs 2,352
3.1.7 In-state Wind
The Starting Point scenario identified 2,237 MW of in state wind in 2040. In the SB 100 Core
scenario, the RESOLVE model selected all of the available in-state wind resource potential.
This is similar to the 1,918 MW included in the CPUC IRP portfolios being studied in the 2021-
2022 transmission planning process base case portfolio.
3.1.8 Offshore Wind
The Starting Point scenario identified 10,000 MW of offshore wind in 2040 which is consistent
with other SB 100 scenarios. Within the 2021-2022 TPP the CAISO is studying offshore wind
energy as a sensitivity and in an outlook study.
Detailed studies have been performed to identify the transmission needs for resources in the
following offshore wind call areas.
California ISO/I&OP 23CAISO 20-Year Transmission Outlook January 31, 2022
• Humboldt: 1.6 GW
• Morro Bay: 2.3 GW
• Diablo Canyon: 4.4 MW
In addition, an outlook assessment has been undertaken to accommodate an additional 12.8
GW of offshore wind resources at the following call areas:
• Del Norte: 6.6 GW
• Cape Mendocino: 6.2 GW
The sensitivity analysis on offshore wind in the 2021-2022 Transmission Plan, section 3.5.7 has
been utilized for the analysis of the 10 GW of offshore wind in the SB100 Starting Point
scenario. Figure 3.1-4 illustrates the call areas of the offshore wind that were assessed.
Figure 3.1-4: BOEM Offshore Wind Call Areas 19
19 NREL “The Cost of Floating Offshore Wind Energy In California Between 2019 and 2032”
https://www.nrel.gov/docs/fy21osti/77384.pdf
California ISO/I&OP 24CAISO 20-Year Transmission Outlook January 31, 2022
The Bureau of Ocean Energy Management (BOEM) current California activities 20 are in the
Morro Bay and Humboldt offshore wind areas where they are planning for potential offshore
renewable energy leasing and development activities.
3.1.9 Out-of-state wind
The Starting Point scenario identified 12,000 MW of out-of-state wind resources in 2040. The
out-of-state wind that has been identified as either requiring new transmission to bring the
resource to the CAISO transmission grid (9,900 MW) or on existing transmission (2,100 MW) as
On new transmission
• Wyoming 4,685 MW
• New Mexico 5,215 MW
On existing transmission
• Northwest 1,500 MW
• Baja California 600 MW
As indicated in section At the July 22, 2021 CEC SB100 workshop 21 a number of projects were
identified that could bring out-of-state wind power to CAISO system. The identified transmission
development projects could provide for a portion of the transmission required to access 10,000
MW of out-of-state wind resources. Additional transmission either to the border of the CAISO
system or to interconnection points within the CAISO will likely be required.
3.1.10 Geothermal
The Starting Point scenario identified 2,332 MW of geothermal resources in 2040. As a starting
point for the 20-year outlook, and to more fully understand the ability for geothermal to scale in
and around the Salton Sea region the agencies allocated most (2,012 MW), but not all, of the
geothermal capacity to the Imperial transmission zone. The remainder of the geothermal
capacity (320 MW) was identified in the southern Nevada area.
20 https://www.boem.gov/renewable-energy/state-activities/california
21 https://efiling.energy.ca.gov/GetDocument.aspx?tn=238965&DocumentContentId=72387
California ISO/I&OP 25CAISO 20-Year Transmission Outlook January 31, 2022 Chapter 4 4 Integration of Resources To assess the transmission impacts and identify feasible alternatives for the transmission development necessary to integrate the resources they need to be mapped more granularly to the substations and bus bars in the models. Figure 3.1-1 provides an illustration of the solar, wind and geothermal resources in the transmission zones within the CAISO system. Figure 3.1-1: High-level illustration of the areas of solar, wind and geothermal resource allocation California ISO/I&OP 26
CAISO 20-Year Transmission Outlook                                                                                    January 31, 2022

3.1    Mapping of solar resources
The SB100 Starting Point scenario identified 53,212 MW of solar capacity in the following
transmission zones as indicated in Table 3.1-4. The solar resources have been mapped to the
following substations within each of the transmission zones identified in the SB100 Starting
Point scenario.
The solar resources have been mapped to existing facilities with the exception of the Westlands
area. The Manning Substation project recommended for approval in the 2021-2022
Transmission Plan has been included to interconnect the resources within this transmission
zone.

           Figure 3.1-1: Interconnection of solar resources to substation in CAISO system

                                                                                                                                                  G
                                                                    Cottonwood

  Sacramento River: 998 MW
                                                                                                                                   Caribou

                                                                                                                                              NVLY
                                                                                                                                                      NO
                                                                                                                                                           G
                                                          Glenn                                                                                                Belden
                                                                                 Logan
                                                                                 Creek    Table              G Thermalito 1-4
                                                     200 MW
  Zone Total                       998.0
                                                              G                                                                                                     G   Bucks Creek
                                                                                         Mountain
                                                                                                                                  G       Hyatt 1&2                 G   Grizzly
                                                                                                        G        NO
                                                         Colusa                                                                                                         Oak Flats PH
                                                                             Delevan                198 MW                        G       Hyatt 3&4

  Delevan 230kV                      200                                                                                                                                    #1 Rock
                                                              G                                                                                                         G
                                                                                                                                  G       Hyatt 5&6            NO
                                                                                 G                                                                                             Creek
                                                                                                                                                                        G   #2
                                                                            200 MW
  Glenn 230kV                        200                  Cortina
                                                                                                                         Palermo                                    G   Cresta

                                                                                                                         G      200 MW                                  POE
  Palmero 230kV                      200
                                                                                                                                                                    G
                                                                                                                                Colgate
                                                                                                                                      G

  Rio Oso 230kV                      200
  Thermalito 230kV                   198
                                                                                 Vaca
                                                                                 Dixon

                                                                                                       Rio Oso
                                                                                                                           G    200 MW

       Norcal Solano: 169 MW                                                169 MW
                                                                            G
                                                         Fulton                                     Lakeville
 Zone Total                        169.0                                                                                                                       Vaca Dixon
                                                                                                                         Tulucay
 Fulton 230kV                        169                          Ignacio
 Contra Costa 230kV                     0
 Tulucay 230kV                          0               C&H         G        Crokett

 Vaca-Dixon 500kV                       0

                                                       Sobrante

California ISO/I&OP                             27
CAISO 20-Year Transmission Outlook January 31, 2022
To Gold Hill
Central Valley and Los Banos:
Bellota
1,079 MW Lodi
G
Zone Total 1,079.0 Eight
Mile 269 MW Weber G
Wilson 230 kV 270.0 G
Collierville
Stagg
Borden 230 kV 270.0 To
Warnerville 230 kV 270.0 Tesla
Eight Mile 230 kV 269.0 Warnerville Cottle
CCSF G 270 MW
GNew
Melones
Wilson
270 MW G
Storey
270 MW G
Helms
Borden PGP
G
Gregg
Kern and Greater Carrizo:
6,154 MW
Zone Total 6,154.0
Arco 230kV 700.0
Midway 230kV 1,500.0
Renfro 230kV 600.0
Stockdale 230kV 700.0
Wheeler Ridge 230kV 1,500.0
Kern PP 800.0
Lamont 115 kV 354.0
California ISO/I&OP 28CAISO 20-Year Transmission Outlook January 31, 2022
To Midway
Tehachapi: 9,544 MW 2,300 MW
G
Windhub
Zone Total 9,544.0
G
WindHub 500kV 2,300.0 2,600 MW
Whirlwind 500kV 2,600.0 Whirlwind
Antelope 230kV 2,500.0
Vincent 230kV 2,144.0 To
G 2,500 MW
Magunden
Antelope
To Santa Clara Vincent
G
Pardee 2,144 MW
To Mesa
Santa Clara Vincent
Tehachapi Outside of Constraint Goleta
Zones: 2,066 MW G
Moorpark
Pardee
1,000 MW
Zone Total 2,066.0
G To Mesa
S.CLARA 230kV 1000
1,066 MW
MOORPARK 230kV 1066
Sylmar
Gould
Ormond Beach
Eagle Rock
To BLM West
Inyokern and North of Kramer:
2,162 MW New Inyokern 230 kV
substation
G
Zone Total 2,162.0 1,000 MW
KRAMER 230kV 1162
INYOKERN 230kV 1000
Kramer
G
1,162 MW
California ISO/I&OP 29CAISO 20-Year Transmission Outlook January 31, 2022
Sandlot
North of Victor: 674 MW Kramer
Coolwater
G 224 MW
Zone Total 674.0
Victor 230kV 450.0
Coolwater 230kV 224.0
G 450 MW
Victor
Pisgah
Pisgah: 674 MW
G 200 MW
Calcite
Zone Total 674.0
G
Calcite 200.0 200 MW
Lugo 274.0
Pisgah 200.0
Lugo G 274 MW
Primm
Mountain Pass - Eldorado: 248 MW
Ivanpah
Zone Total 248.0 80 MW
G
El Dorado 230kV 80.0 Mead
EL Dorado 500kV 168.0
G
Eldorado
168 MW
450 MW
Southern Nevada: 2,024 MW G Desert G
350 MW
Northwest
View
Innovation
Zone Total 2,024.0
Innovation 230kV 450.0 Pahrump
Desert View 230kV 350.0 Trout Canyon
Crazy Eyes/Trout Canyon 230kV 1,224.0 G
Harry
1,224 MW
Sloan Allen
Canyon
Primm Hoover
Ivanpah
Mead
Eldorado
California ISO/I&OP 30You can also read