THE 2021 ANNUAL UPDATE TO THE COMPREHENSIVE ECONOMIC DEVELOPMENT STRATEGY FOR ELKO COUNTY, NEVADA AND FOR THE INDIVIDUAL COMMUNITIES OF THE CITY ...
←
→
Page content transcription
If your browser does not render page correctly, please read the page content below
TECHNICAL REPORT
                                      UCED 2021/22-14

THE 2021 ANNUAL UPDATE TO THE COMPREHENSIVE
 ECONOMIC DEVELOPMENT STRATEGY FOR ELKO
   COUNTY, NEVADA AND FOR THE INDIVIDUAL
COMMUNITIES OF THE CITY OF ELKO, JACKPOT, AND
        SPRING CREEK, 2020 THROUGH 2025

                             UNIVERSITY OF NEVADA, RENO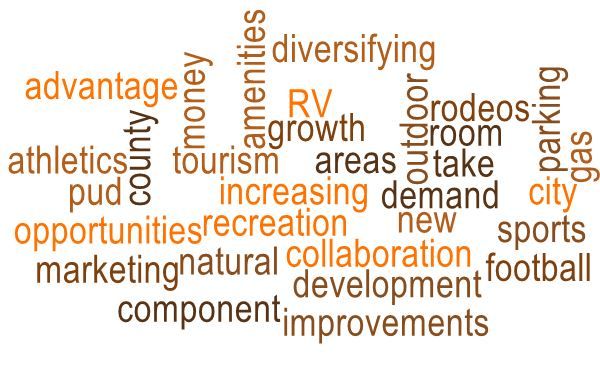
THE 2021 ANNUAL UPDATE TO THE COMPREHENSIVE
    ECONOMIC DEVELOPMENT STRATEGY FOR ELKO
      COUNTY, NEVADA AND FOR THE INDIVIDUAL
   COMMUNITIES OF THE CITY OF ELKO, JACKPOT, AND
           SPRING CREEK, 2020 THROUGH 2025

                                       Frederick A. Steinmann

Frederick Steinmann is an Assistant Research Professor with the University Center for
       Economic Development, College of Business at the University of Nevada, Reno.

                                           December 2021

The 2021 Annual Update to the Comprehensive Economic Development Strategy for Elko County, Nevada and   ii
       the Individual Communities of the City of Elko, Jackpot, and Spring Creek, 2020 through 2025
                                                12/19/2021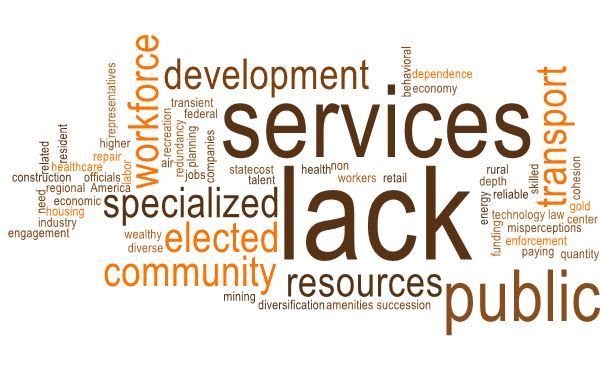
This publication, The 2021 Annual Update to the Comprehensive
                Economic Development Strategy for Elko County, Nevada and the
                Individual Communities of the City of Elko, Jackpot, and Spring
                Creek, 2020 through 2025, was published by the University
                Center for Economic Development in the College of Business at
                the University of Nevada, Reno. This publication's statements,
                findings, conclusions, recommendations, and/or data represent
                solely the findings and views of the authors and do not necessarily
                represent the views of Elko County, the City of Elko, the town of
                Jackpot, the Spring Creek Association, the Northeastern Nevada
                Regional Development Authority, the University of Nevada,
                Reno, or any reference sources used or quoted by this study.
                Reference to research projects, programs, books, magazines, or
                newspaper articles does not imply an endorsement or
                recommendation by the authors unless otherwise stated.
                Correspondence regarding this document should be sent to:

                                 Frederick A. Steinmann, DPPD
                           University Center for Economic Development
                                    University of Nevada, Reno
                                      The College of Business
                                          Mail Stop 204
                                       Reno, Nevada 89557
                                       Phone: 775.784.1655

                                              UCED
                                    University of Nevada, Reno
                           University Center for Economic Development
                                      The College of Business

The 2021 Annual Update to the Comprehensive Economic Development Strategy for Elko County, Nevada and   iii
       the Individual Communities of the City of Elko, Jackpot, and Spring Creek, 2020 through 2025
                                                12/19/2021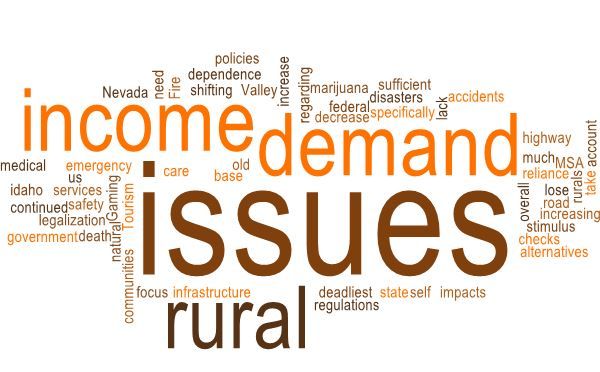
TABLE OF CONTENTS

Table of Contents                                                                                iv

List of Tables                                                                                   vi

List of Figures                                                                                  vii

The Comprehensive Economic Development Strategy 2020 through 2025 for                            1
Elko County, Nevada and for the City of Elko and the Communities of Jackpot
and Spring Creek

1.0 Introduction                                                                                 5

        Overview                                                                                 5

2.0 Analysis: Existing Community and Regional Conditions                                         8

        2.1 Socio-Demographic and Economic Trends for the Northeastern Nevada                    8
            Regional Development Authority Region
               2.1.a Total Population                                                            8
               2.1.b Median Age                                                                  10
               2.1.c Total Number of Households                                                  11
               2.1.d Average Household Size                                                      13
               2.1.e Median Household Income                                                     15
               2.1.f Median Family Income                                                        16
               2.1.g Per Capita (Mean) Income                                                    17
               2.1.h Percent of Total Population Living Below the Poverty Line                   18
               2.1.i Civilian Workforce (Individuals 16 Years or Older)                          20
               2.1.j Civilian Unemployment Rate (Individuals 16 Years or Older)                  21
               2.1.k Total Employment by Major Industry Sector                                   23

        2.2 Evaluating Existing Conditions and Identifying New Conditions in the       25
            Socio-Demographic and Economic Data
               2.2.a Evaluating the Current Conditions from the Existing Comprehensive 25
                     Economic Development Strategy
               2.2.b Identification of New Critical Conditions                         27

        2.3 An Updated Strengths, Weaknesses, Opportunities, and Threats (SWOT)                  32
            Analysis
               2.3.a Strengths                                                                   32
               2.3.b Weaknesses                                                                  37
               2.3.c Opportunities                                                               42
The 2021 Annual Update to the Comprehensive Economic Development Strategy for Elko County, Nevada and   iv
       the Individual Communities of the City of Elko, Jackpot, and Spring Creek, 2020 through 2025
                                                12/19/2021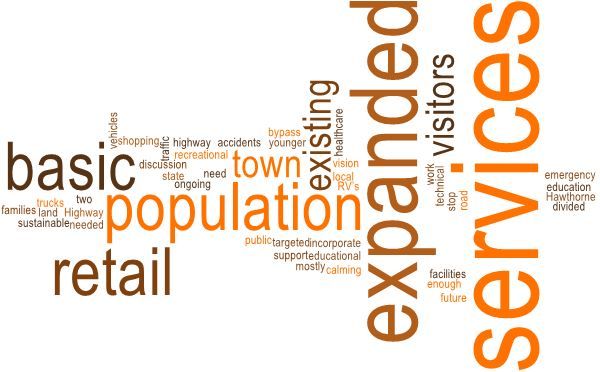
2.3.d Threats                                                                    47

3.0 Evaluation of the Vision, Goals, and Objectives                                              53

        3.1 Evaluation of the Strategic Economic Development Vision                              53

        3.2 Evaluation of the Strategic Economic Development Goals                               58
               3.2.a Personal Hopes and Aspirations                                              59
               3.2.b Evaluation of the Current Strategic Goals and Objectives for Elko           62
                     County and for the City of Elko
               3.2.c Evaluation of the Current Strategic Goals and Objectives for the            65
                     Communities of Jackpot and Spring Creek
               3.2.d Reprioritizing the Existing Strategic Economic Development Goals            68
                     and Objectives for Elko County and for the City of Elko for the
                     Coming Year
               3.2.e Reprioritizing the Existing Strategic Economic Development Goals            70
                     and Objectives for Elko County and for the Community of Jackpot
                     for the Coming Year
               3.2.f Reprioritizing the Existing Strategic Economic Development Goals            72
                     and Objectives for Elko County and for the Community of Spring
                     Creek for the Coming Year

        3.3 Developing Economic Recovery and Resiliency Efforts as part of the                   74
            Current Five-Year Comprehensive Economic Development Strategy
               3.3.a Responsive Initiatives                                                      75
               3.3.b Steady-State Initiatives                                                    77

The 2021 Annual Update to the Comprehensive Economic Development Strategy for Elko County, Nevada and   v
       the Individual Communities of the City of Elko, Jackpot, and Spring Creek, 2020 through 2025
                                                12/19/2021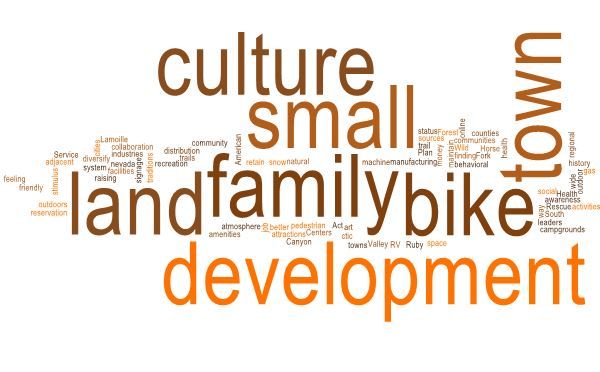
LIST OF TABLES

2.1     Total Population; Communities within the Northeastern Nevada Regional                    9
        Development Authority

2.2     Median Age; Communities within the Northeastern Nevada Regional                          10
        Development Authority

2.3     Total Number of Households; Communities within the Northeastern Nevada                   12
        Regional Development Authority

2.4     Average Household Size; Communities within the Northeastern Nevada                       13
        Regional Development Authority

2.5     Median Household Income (2019 Inflation-Adjusted Dollars); Communities                   15
        within the Northeastern Nevada Regional Development Authority

2.6     Median Family Income (2019 Inflation-Adjusted Dollars); Communities within               16
        the Northeastern Nevada Regional Development Authority

2.7     Per Capita (Mean) Income, Individuals (2019 Inflation-Adjusted Dollars);  18
        Communities within the Northeastern Nevada Regional Development Authority

2.8     Percent of Total Population Living Below the Poverty Line; Communities                   19
        within the Northeastern Nevada Regional Development Authority

2.9     Civilian Workforce (Individuals 16 Years or Older); Communities within the               20
        Northeastern Nevada Regional Development Authority

2.10    Civilian Unemployment Rate (Individuals 16 Years or Older); Communities                  22
        within the Northeastern Nevada Regional Development Authority

2.11    Civilian Employment (Population 16 Years and Over); Communities within the               24
        Northeastern Nevada Regional Development Authority; 2019

The 2021 Annual Update to the Comprehensive Economic Development Strategy for Elko County, Nevada and   vi
       the Individual Communities of the City of Elko, Jackpot, and Spring Creek, 2020 through 2025
                                                12/19/2021
LIST OF FIGURES
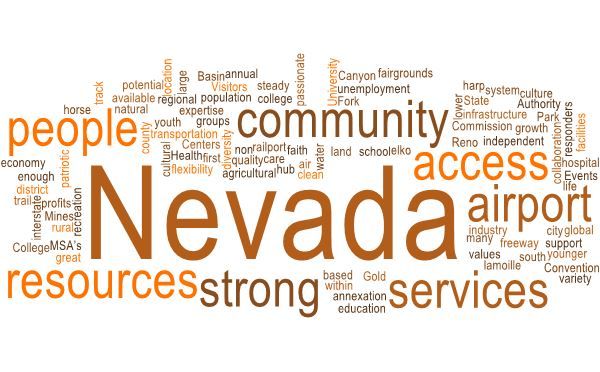
2.1 Economic Development Strengths; Elko County and the City of Elko 33
2.2 Economic Development Strengths; Jackpot 35
2.3 Economic Development Strengths; Spring Creek 36
2.4 Economic Development Weaknesses; Elko County and the City of Elko 38
2.5 Economic Development Weaknesses; Jackpot 39
2.6 Economic Development Weaknesses; Spring Creek 41
2.7 Economic Development Opportunities; Elko County and the City of Elko 42
2.8 Economic Development Opportunities; Jackpot 44
2.9 Economic Development Opportunities; Spring Creek 46
2.10 Economic Development Threats; Elko County and the City of Elko 48
2.11 Economic Development Threats; Jackpot 49
2.12 Economic Development Threats; Spring Creek 51
The 2021 Annual Update to the Comprehensive Economic Development Strategy for Elko County, Nevada and vii
the Individual Communities of the City of Elko, Jackpot, and Spring Creek, 2020 through 2025
12/19/2021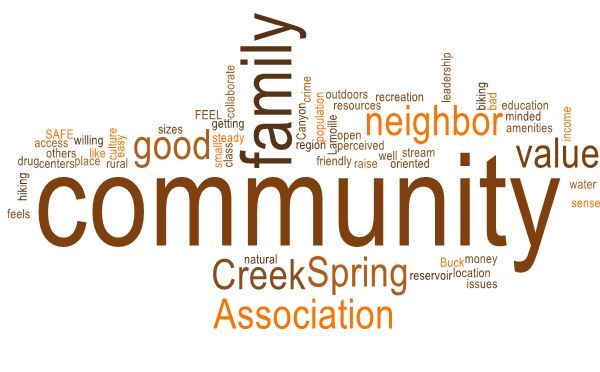
The Comprehensive Economic Development
    Strategy 2020 through 2025 for Elko County,
      Nevada and for the City of Elko and the
     Communities of Jackpot and Spring Creek

   Economic Development Vision for Elko County and for the City of Elko

Elko will be a magnet for economic activity in the intermountain west, attracting a
diverse and professional workforce. Residents will enjoy a lifestyle that embraces
                   the future while honoring our rich heritage.

 Through regional collaboration, Elko will aggressively pursue implementation of
 technology and investment to drive economic diversification and enhance quality
                        of life for all who call Elko home.

  Economic Development Vision for the Communities of Jackpot and Spring
                                 Creek

 The foothills of the Ruby Mountains will cultivate and integrate new businesses
creating a diverse economy through education and fostering health and wellness of
    our residents while embracing the natural beauty of our rural surroundings.

The 2021 Annual Update to the Comprehensive Economic Development Strategy Page 1 of 80
for Elko County, Nevada and the Individual Communities of the City of Elko, December 2021
Jackpot, and Spring Creek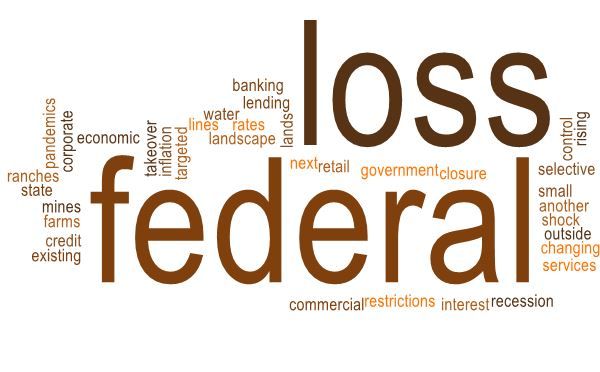
The Comprehensive Economic Development
    Strategy 2020 through 2025 for Elko County,
      Nevada and for the City of Elko and the
     Communities of Jackpot and Spring Creek

Reprioritized Strategic Economic Development Goals for Elko County and for
                    the City of Elko for 2021 through 2022

    Priority Goal No. 1: Existing Goal No. 1, Increase access to reliable Internet (at least 15
   BPS consistently) through the recruitment of an additional provider to serve the City of Elko.
                  To bring fiber supported Internet to Elko by December 2020.

   Priority Goal No. 2: Existing Goal No. 4, Formalize and establish a process of collaboration
     between Spring Creek Association, City of Elko, and Elko County and convene the first
                                 meeting by January 30, 2020.

   Priority Goal No. 3: Existing Goal No. 2, Reduce the percentage of population living below
               the poverty line by 20 percent in the City of Elko by July 1, 2024.

    Priority Goal No. 4: Existing Goal No. 3, Increase commercial air service to and from Salt
     Lake City and Reno by 2025. To have two additional airlines servicing the Elko area with
                     direct flights from and to Reno, Nevada by July 1, 2024.

The 2021 Annual Update to the Comprehensive Economic Development Strategy Page 2 of 80
for Elko County, Nevada and the Individual Communities of the City of Elko, December 2021
Jackpot, and Spring Creek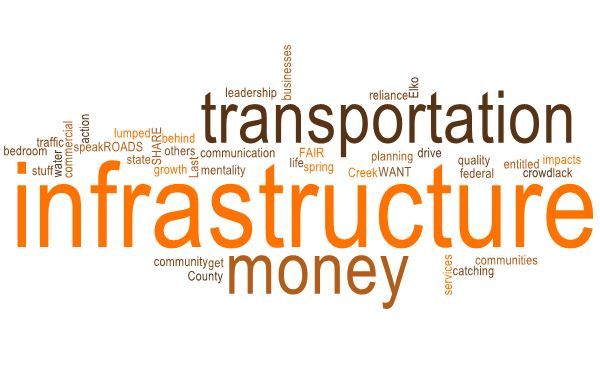
The Comprehensive Economic Development
    Strategy 2020 through 2025 for Elko County,
      Nevada and for the City of Elko and the
     Communities of Jackpot and Spring Creek

 Reprioritized Strategic Economic Development Goals for the Community of
                        Jackpot for 2021 through 2022

       Priority Goal No. 1: NEW GOAL, Identify, prioritize, develop and complete needed
   infrastructure to support selected community and economic development efforts and provide
     for the necessary financial resources in order to complete selected infrastructure projects.

    Priority Goal No. 2a: Reworked Existing Goal No. 2, Increase access to capital for small
                          business development by 3 percent by 2022.

     Priority Goal No. 2b: Increase affordable housing for middle to low income buyers by 5
                   percent through the use of assistance organization by 2024.

    Priority Goal No. 3: Combined and Reworked Existing Goal No. 4 and Existing Goal No.
       5, Increase overall access to expanded basic and more advanced physical and mental
       healthcare services for community members within the next four years through active
   recruitment of potential healthcare providers and by promoting area outdoor and recreational
                                     activities and opportunities.

The 2021 Annual Update to the Comprehensive Economic Development Strategy Page 3 of 80
for Elko County, Nevada and the Individual Communities of the City of Elko, December 2021
Jackpot, and Spring Creek
The Comprehensive Economic Development
Strategy 2020 through 2025 for Elko County,
Nevada and for the City of Elko and the
Communities of Jackpot and Spring Creek
Reprioritized Strategic Economic Development Goals for the Community of
Spring Creek and the Spring Creek Association for 2021 through 2022
Priority Goal No. 1: NEW GOAL, Identify, prioritize, develop and complete needed
infrastructure to support selected community and economic development efforts and provide
for the necessary financial resources in order to complete selected infrastructure projects.
Priority Goal No. 2: Existing Goal No. 2, Increase access to capital for small business
development by 3 percent by 2022.
Priority Goal No. 3: Existing Goal No. 4, The Northeastern Nevada Regional Development
Authority will provide population and demographic statistical information to potential
healthcare provider to establish a business within four years in Spring Creek.
Priority Goal No. 4: Existing Goal No. 5, Promote a healthy lifestyle. Spring Creek will
produce a Facebook page which will provide outdoor and recreational activities within six
months.
Priority Goal No. 5: Existing Goal No. 3, Increase affordable housing for middle to low
income buyers by 5 percent through the use of assistance organization by 2024.
Priority Goal No. 6: Existing Goal No. 1, Grow technical educational programs for current
and potential industries by 2024. Identify the technical needs and capacity required to create
an educational program with three new industry sectors within one year of adoption of the
strategic plan.
The 2021 Annual Update to the Comprehensive Economic Development Strategy Page 4 of 80
for Elko County, Nevada and the Individual Communities of the City of Elko, December 2021
Jackpot, and Spring Creek1.0 Introduction
Overview
What is strategy? According to John E. Gamble, Margaret A. Peteraf, and Arthur A. Thompson,
in their 2015 book, Essentials of Strategic Management: The Quest for Competitive Advantage,
“A strategy is a way of describing how you are going to get things done. It is less specific than
an action plan (which tells the who-what-when); instead, it tries to broadly answer the question,
‘How do we get there from here?’ Do we want to take the train? Fly? Walk?” In short, a
strategic plan provides an organization or community with a fundamental affirmation of the
organization’s or community’s core values, strategic mission, and strategic vision while outlining
the goals, objectives, and implementation measures the organization or community will attempt
to achieve and implement over the strategic planning horizon.
Typically, a strategic plan includes three basic elements. First, the strategic plan is a recognition
of the existing barriers an organization or community faces and the resources the organization or
community has at its disposal to achieve strategic objectives. Second, the strategic plan is
generally tied to an overall vision, mission, and a set of clearly defined objectives. And, third,
the strategic plan provides direction to the organization or community for the organization’s or
community’s future planned initiatives focusing on providing information, enhancing support,
removing barriers, and providing resources to different parts of the organization or community
and key stakeholders who have an interest in the achievement of the strategic plan.
When evaluating and developing a strategic plan, five basic questions must be answered,
including:
• Does the strategic plan give overall direction to the organization? The strategic plan
should point out the overall path without dictating a particular narrow approach.
• Does the strategic plan realistically fit available resources with identified opportunities?
The strategic plan should take advantage of current resources and assets while embracing
new opportunities for growth and success.
• Does the strategic plan minimize existing and future resistance and barriers the
organization currently confronts and may have to address in the future? The strategic
plan should keep in mind that opposition and resistance to implementation of the strategic
plan is inevitable. Good strategic plans should attract allies and deter opponents.
• Does the strategic plan reach those that may be affected, positively and negatively, by
implementing the strategic plan? The strategic plan should connect the intervention with
The 2021 Annual Update to the Comprehensive Economic Development Strategy Page 5 of 80
for Elko County, Nevada and the Individual Communities of the City of Elko, December 2021
Jackpot, and Spring Creekthose who it should benefit while minimizing potential negative impacts to those
impacted by the plan.
• Does the strategic plan advance the strategic mission of the organization? The strategy
should make a difference on the mission of the organization while enabling the
organization to achieve stated goals and objectives.
Unlike strategic plans for private sector firms, a Comprehensive Economic Development
Strategy, as outlined in Title 13 Part 303 of the U.S. Code of Federal Regulations, must focus on
how a public sector economic development organization and authority will bring together the
public and private sectors through the creation of an economic roadmap designed to diversify
and strengthen regional and local economies. The inherent public sector nature of the
Comprehensive Economic Development Strategy requires consideration of both economic and
community development goals and objectives in order to support and facilitate an environment
of growth, investment, and job creation.
Between July 2019 and September 2019, public sector, private sector, and non-profit
organization representatives participated in a series of community strategic economic
development planning workshops for the purpose of developing a series of community-level
Comprehensive Economic Development Strategies aimed at guiding community-level and
regional economic development efforts for the five-year 2020 through 2025 period. Individual
Comprehensive Economic Development Strategy documents were developed for Elko County,
Eureka County, Lander County, and White Pine County and for the individual communities of
the City of Carlin, the City of Wells, and the City of West Wendover. As required by the U.S.
Economic Development Administration, faculty and staff from the University Center for
Economic Development, part of the College of Business at the University of Nevada, Reno,
facilitated a series of annual update and evaluation workshops held on the following dates and in
the following communities for the associated exiting Comprehensive Economic Development
Strategy documents:
• City of Carlin Comprehensive Economic Development Strategy 2020 through 2025
Annual Update and Evaluation: April 26, 2021 in Carlin, Nevada
• City of Wells Comprehensive Economic Development Strategy 2020 through 2025
Annual Update and Evaluation: March 4, 2021 in Wells, Nevada
• City of West Wendover Comprehensive Economic Development Strategy 2020 through
2025 Annual Update and Evaluation: May 5, 2021 in West Wendover, Nevada
• Elko County, City of Elko, Jackpot and Spring Creek Comprehensive Economic
Development Strategy 2020 through 2025: July 13, 2021 in Elko, Nevada (Elko County
and City of Elko); July 14, 2021 in Spring Creek, Nevada (Spring Creek); July 15, 2021
in Jackpot, Nevada (Jackpot)
The 2021 Annual Update to the Comprehensive Economic Development Strategy Page 6 of 80
for Elko County, Nevada and the Individual Communities of the City of Elko, December 2021
Jackpot, and Spring Creek• Lander County Comprehensive Economic Development Strategy 2020 through 2025
Annual Update and Evaluation: April 28, 2021 in Battle Mountain, Nevada
• White Pine County Comprehensive Economic Development Strategy 2020 through 2025
Annual Update and Evaluation: May 3, 2021 in Ely, Nevada
Each of these individual annual update and evaluation strategic economic development planning
workshops consisted of an overview of the Comprehensive Economic Development Strategy and
of resiliency and contingency planning along with a series of facilitated small group and large
group participant exercises designed to evaluate and, if necessary, to revise the strategic
economic development vision statement and individual goals and objectives identified in each
individual community-level Comprehensive Economic Development Strategy developed in 2019
through 2020. Workshop participants were also asked to identify a series of priority projects for
the coming year and participated in a series of facilitated small group and large group exercises
designed to develop a set of economic resiliency and contingency elements.
This University Center for Economic Development technical report presents the results from the
local community and county-level Comprehensive Economic Development Strategy annual
update and evaluation workshop held in Elko, Nevada on Tuesday, July 13, 2021, in Spring
Creek, Nevada on Wednesday, July 14, 2021, and in Jackpot, Nevada on Thursday, July 15,
2021. The results of each one of these three strategic planning workshops were used to update
the current five-year Comprehensive Economic Development Strategy for Elko County, for the
City of Elko, and for the individual communities of Jackpot and Spring Creek. Section 2.0 of
this University Center for Economic Development technical report presents an updated socio-
demographic and economic data profile of each county and community within the northeastern
Nevada region. It should be noted that, while the University Center for Economic Development
utilizes data primarily from the U.S. Census Bureau and the U.S. Census Bureau’s American
Community Survey five-year estimates, a brief comparison between the data presented in
Section 2.0 of this technical report and data certified by the Nevada State Demographer’s Office
often results in significant differences, especially in the estimation of total population and other
demographic statistics. For example, according to the Nevada State Demographer’s Office,
communities within the northeastern Nevada region recorded a total population of approximately
16.2 percent greater than what was estimated by the U.S. Census Bureau’s American Community
Survey for 2019. U.S. Census Bureau data is primarily used in this technical report in
compliance with U.S. Economic Development Administration requirements. Section 3.0 of this
University Center for Economic Development technical report presents an overview of potential
revisions to the existing economic vision statement, goals and actionable items, and specific
resiliency and recovery actions developed by community leaders and representatives.
The 2021 Annual Update to the Comprehensive Economic Development Strategy Page 7 of 80
for Elko County, Nevada and the Individual Communities of the City of Elko, December 2021
Jackpot, and Spring Creek2.0 Analysis: Existing Community and Regional Conditions This section presents a comprehensive overview of updated socio-demographic, economic, and industry and occupation sector data for individual communities and counties within the northeastern Nevada region. The results of this socio-demographic, economic, and industry and occupation sector data analysis were presented to participants of the annual update and review workshops held for individual communities within the northeastern Nevada region between March 2021 and July 2021. 2.1 Socio-Demographic and Economic Trends for the Northeastern Nevada Regional Development Authority Region Eleven separate socio-demographic, economic, and industry and occupation sector data categories were examined by participants of the individual community annual update and review strategic economic development planning workshops held between March 2021 and July 2021. These categories include total population, median age, total number of households and average household size, median household income, median family income, and per capita income, the percentage of total population living below the poverty line, civilian workforce and the civilian unemployment rate, and total civilian employment by major industry sector. Whenever possible, comparison of local and countywide trends to statewide and national trends are provided for the 2013 to 2019 period. 2.1.a Total Population Table 2.1 presents the change in total population for each county within the Northeastern Nevada Regional Development Authority region, for the state of Nevada, and for the United States between 2013 and 2019. Elko County and the City of Elko are highlighted. Between 2013 and 2019, the total population for all of Elko County increased from an estimated 50,023 total individuals in 2013 to an estimated 52,297 total individuals in 2019, a net increase of 2,274 total individuals or by 4.5 percent. For the City of Carlin, total population decreased between 2013 and 2019, decreasing from an estimated 2,634 total individuals in 2013 to an estimated 2,025 total individuals in 2019, a net decrease of 609 total individuals or by -23.1 percent. Total population for the City of Elko increased from an estimated 18,888 total individuals in 2013 to an estimated 20,304 total individuals in 2019, a net increase of 1,416 total individuals or by 7.5 percent while total population for the City of Wells decreased from an estimated 1,374 total individuals in 2013 to an estimated 1,022 total individuals in 2019, a net decrease of 352 total individuals or by -25.6 percent. The total population for the City of West Wendover decreased from an estimated 4,442 total individuals in 2013 to an estimated 4,285 total individuals in 2019, a net decrease of 157 total individuals or by -3.5 percent. The 2021 Annual Update to the Comprehensive Economic Development Strategy Page 8 of 80 for Elko County, Nevada and the Individual Communities of the City of Elko, December 2021 Jackpot, and Spring Creek
For all of Eureka County, the total population countywide increased from an estimated 1,804
total individuals in 2013 to an estimated 1,859 total individuals in 2019, a net increase of 55 total
individuals or by 2.7 percent and the total population for just the town of Eureka increased from
an estimated 450 total individuals in 2013 to an estimated 462 total individuals in 2019, a net
increase of 12 total individuals or by 2.7 percent. The total population for all of Lander County
decreased from an estimated 5,844 total individuals in 2013 to an estimated 5,643 total
individuals in 2019, a net decrease of 201 total individuals or by a percentage decrease of -3.4
percent. For the town of Austin, located in southern Lander County, the total population has
decreased significantly between 2013 and 2019, decreasing from an estimated 580 total
individuals in 2013 to an estimated 113 total individuals in 2019, a net decrease of 467 total
individuals or by a percentage decrease of -80.5 percent while the total population for the town
of Battle Mountain, located in northern Lander County, increased from an estimated 3,241 total
individuals in 2013 to an estimated 3,698 total individuals in 2019, a net increase of 457 total
individuals or by 14.1 percent.

                              Table 2.1 – Total Population
      Communities within the Northeastern Nevada Regional Development Authority
    Community               2013                2019              2013-2019          2013-2019
                                                                Actual Change      Percent Change
    Elko County            50,023              52,297               2,274               4.5%
       Carlin              2,634               2,025                -609               -23.1%
        Elko               18,888              20,304               1,416               7.5%
       Wells               1,374               1,022                -352               -25.6%
   West Wendover           4,442               4,285                -157                -3.5%

   Eureka County            1,804               1,859                55                 3.0%
      Eureka                 450                 462                 12                 2.7%

   Lander County            5,844               5,643               -201                 -3.4%
        Austin               580                 113                -467                -80.5%
   Battle Mountain          3,241               3,698                457                 14.1%

 White Pine County         10,023               9,679               -344                -3.4%
        Ely                4,246                4,035               -211                -5.0%

  State of Nevada         2,730,066           2,972,382            242,316              8.9%
   United States         311,536,594         324,697,795          13,161,201            4.2%
Source: U.S. Census Bureau; American Community Survey, 5-Year Estimates; 2013 and 2019

For White Pine County, the countywide population decreased from an estimated 10,023 total
individuals in 2013 to an estimated 9,679 total individuals in 2019, a net decrease of 344 total
individuals or by a percentage decrease of -3.4 percent. The total population of the City of Ely,
located in White Pine County, also decreased between 2013 and 2019, decreasing from an
estimated 4,246 total individuals in 2013 to an estimated 4,035 total individuals in 2019, a net
decrease of 211 total individuals or by a percentage decrease of -5.0 percent.

The 2021 Annual Update to the Comprehensive Economic Development Strategy Page 9 of 80
for Elko County, Nevada and the Individual Communities of the City of Elko, December 2021
Jackpot, and Spring Creek
Comparatively, the total population for the entire state of Nevada increased between 2013 and
2019, increasing from an estimated 2.73 million total individuals in 2013 to an estimated 2.97
million total individuals in 2019, a net increase of 242,316 total individuals or by 8.9 percent.
Nationwide, the total population for the entire United States increased from an estimated 311.54
million total individuals in 2013 to an estimated 324.70 million total individuals in 2019, a net
increase of approximately 13.16 million total individuals or by 4.2 percent.
2.1.b Median Age
Table 2.2 presents the change in median age for each county within the Northeastern Nevada
Regional Development Authority region, the state of Nevada, and for the United States between
2013 and 2019. Elko County and the City of Elko are highlighted.
Table 2.2 – Median Age
Communities within the Northeastern Nevada Regional Development Authority
Community 2013 2019 2013-2019 2013-2019
Actual Change Percent Change
Elko County 33.3 34.1 0.8 2.4%
Carlin 34.8 44.1 9.3 26.7%
Elko 30.3 32.6 2.3 7.6%
Wells 34.6 50.5 15.9 46.0%
West Wendover 26.1 32.0 5.9 22.6%
Eureka County 38.3 47.7 9.4 24.5%
Eureka 46.5 56.0 9.5 20.4%
Lander County 37.3 37.4 0.1 0.3%
Austin 43.3 51.6 8.3 19.2%
Battle Mountain 37.7 38.7 1.0 2.7%
White Pine County 40.9 39.8 -1.1 -2.7%
Ely 44.0 39.0 -5.0 -11.4%
State of Nevada 36.6 38.0 1.4 3.8%
United States 37.3 38.1 0.8 2.1%
Source: U.S. Census Bureau; American Community Survey, 5-Year Estimates; 2013 and 2019
The estimated median age for all of Elko County increased between 2013 and 2019, increasing
from an estimated median age of 33.3 years of age in 2013 to an estimated 34.1 years of age in
2019, a net increase of 0.8 years of age or by 2.4 percent. For the City of Carlin, the estimated
median age increased significantly between 2013 and 2019, increasing from an estimated 34.8
years of age in 2013 to an estimated 44.1 years of age in 2019, a net increase of 9.3 years of age
or by 26.7 percent. The median age for the City of Elko increased from an estimated 30.3 years
of age in 2013 to an estimated 32.6 years of age in 2019, a net increase of 2.3 years of age or by
7.6 percent while the median age for the City of Wells increased significantly between 2013 and
2019, increasing from an estimated 34.6 years of age in 2013 to an estimated 50.5 years of age in
2019, a net increase of 15.9 years of age or by 46.0 percent. For the City of West Wendover, the
The 2021 Annual Update to the Comprehensive Economic Development Strategy Page 10 of 80
for Elko County, Nevada and the Individual Communities of the City of Elko, December 2021
Jackpot, and Spring Creekestimated median age increased significantly, increasing from an estimated 26.1 years of age in 2013 to an estimated 32.0 years of age in 2019, a net increase of 5.9 years of age or by 22.6 percent. For all of Eureka County, the estimated median age increased significantly between 2013 and 2019, increasing from an estimated 38.3 years of age in 2013 to an estimated 47.7 years of age in 2019, a net increase of 9.4 years of age or by 24.5 percent. The estimated median age for just the town of Eureka also increased significantly between 2013 and 2019, increasing from an estimated 46.5 years of age in 2013 to an estimated 56.0 years of age in 2019, a net increase of 9.5 years of age or by 20.4 percent. For all Lander County, the estimated median age increased only slightly between 2013 and 2019, increasing from an estimated 37.3 years of age in 2013 to an estimated 37.4 years of age in 2019, a net increase of 0.1 years of age or by 0.3 percent. For just the town of Austin, the estimated median age increased significantly between 2013 and 2019, increasing from an estimated 43.3 years of age in 2013 to an estimated 51.6 years of age in 2019, a net increase of 8.3 years of age or by 19.2 percent while the estimated median age for just the town of Battle Mountain increased from an estimated 37.7 years of age in 2013 to an estimated 38.7 years of age in 2019, a net increase of 1.0 years of age or by 2.7 percent. The estimated median age for all of White Pine County decreased from an estimated 40.9 years of age in 2013 to an estimated 39.8 years of age in 2019, a net decrease of 1.1 years of age or by a percentage decrease of -2.7 percent. White Pine County was the only county within the northeastern Nevada region with a decrease in the countywide median age between 2013 and 2019. For just the City of Ely, the estimated median age also decreased between 2013 and 2019, decreasing from an estimated 44.0 years of age in 2013 to an estimated 39.0 years of age in 2019, a net decrease of 5.0 years of age or by a percentage decrease of -11.4 percent. Comparatively, the estimated median age for the entire state of Nevada increased between 2013 and 2019, increasing from an estimated 36.6 years of age in 2013 to an estimated 38.0 years of age in 2019, a net increase of 1.4 years of age or by 3.8 percent. Nationwide, the estimated median age for the entire United States increased from an estimated 37.3 years of age in 2013 to an estimated 38.1 years of age in 2019, a net increase of 0.8 years of age or by 2.1 percent. 2.1.c Total Number of Households Table 2.3 presents the change in the total number of households for each county within the Northeastern Nevada Regional Development Authority region, the state of Nevada, and for the United States between 2013 and 2019. Elko County and the City of Elko are highlighted. Between 2013 and 2019, the total number of households in all of Elko County increased from an estimated 17,599 total households in 2013 to an estimated 18,065 total households in 2019, a net increase of 466 total households or by 2.6 percent. For just the City of Carlin, the total number of households decreased significantly between 2013 and 2019, decreasing from an estimated 895 total households in 2013 to an estimated 700 total households in 2019, a net decrease of 195 total households or by a percentage decrease of -21.8 percent. For just the City of Elko, the total number of households increased from an estimated 6,662 total households in 2013 to an The 2021 Annual Update to the Comprehensive Economic Development Strategy Page 11 of 80 for Elko County, Nevada and the Individual Communities of the City of Elko, December 2021 Jackpot, and Spring Creek
estimated 7,232 total households in 2019, a net increase of 570 total households or by 8.6 percent
while the total number of households for just the City of Wells decreased significantly,
decreasing from an estimated 800 total households in 2013 to an estimated 463 total households
in 2019, a net decrease of 337 total households or by a percentage decrease of -42.1 percent. For
just the City of West Wendover, the total number of households also decreased between 2013
and 2019, decreasing from an estimated 1,362 total households in 2013 to an estimated 1,232
total households in 2019, a net decrease of 130 total households or by -9.5 percent.

                       Table 2.3 – Total Number of Households
      Communities within the Northeastern Nevada Regional Development Authority
    Community              2013               2019             2013-2019           2013-2019
                                                             Actual Change       Percent Change
    Elko County           17,599              18,065              466                 2.6%
       Carlin              895                 700               -195                -21.8%
        Elko              6,662               7,232               570                 8.6%
       Wells               800                 463               -337                -42.1%
   West Wendover          1,362               1,232              -130                 -9.5%

  Eureka County            733                 774                 41                 5.6%
     Eureka                504                 249                -255               -50.6%

  Lander County            2,010              2,198                188                9.4%
       Austin               207                 65                -142               -68.6%
  Battle Mountain          1,126              1,465                339                30.1%

 White Pine County         3,357              3,516                159               4.7%
        Ely                1,605              1,703                 98               6.1%

  State of Nevada         999,016           1,098,602            99,586              10.0%
   United States        115,610,216        120,756,048          5,145,832            4.5%
Source: U.S. Census Bureau; American Community Survey, 5-Year Estimates; 2013 and 2019

For all of Eureka County, the total number of households increased between 2013 and 2019,
increasing from 733 total households in 2013 to 774 total households in 2019, a net increase of
41 total households or by 5.6 percent while the total number of households for just the town of
Eureka decreased significantly from 504 total households in 2013 to 249 total households in
2019, a net decrease of 255 total households or by -50.6 percent. For all Lander County, the total
number of households increased between 2013 and 2019, increasing from an estimated 2,010
total households in 2013 to an estimated 2,198 total households in 2019, a net increase of 188
total households or by 9.4 percent. For just the town of Austin, the total number of households
decreased significantly from an estimated 207 total households in 2013 to an estimated 65 total
households in 2019, a net decrease of 142 total households or by -68.6 percent while the total
number of households for just the town of Battle Mountain increased from an estimated 1,126
total households in 2013 to an estimated 1,465 total households in 2019, a net increase of 339
total households or by 30.1 percent.

The 2021 Annual Update to the Comprehensive Economic Development Strategy Page 12 of 80
for Elko County, Nevada and the Individual Communities of the City of Elko, December 2021
Jackpot, and Spring Creek
Between 2013 and 2019, the total number of households for all of White Pine County increased
from an estimated 3,357 total households in 2013 to an estimated 3,516 total households in 2019,
a net increase of 159 total households or by 4.7 percent. For just the City of Ely, the total
number of households also increased between 2013 and 2019, increasing from an estimated
1,605 total households in 2013 to an estimated 1,703 total households in 2019, a net increase of
98 total households or by 6.1 percent.
Statewide, the total number of households for the entire state of Nevada increased from an
estimated 999,016 total households in 2013 to an estimated 1.10 million total households in
2019, a net increase of 99,586 total households or by 10.0 percent. Nationwide, the total number
of households for the entire United States increased from an estimated 115.61 million total
households in 2013 to an estimated 120.76 million total households in 2019, a net increase of
5.15 million total households or by a percentage increase of 4.5 percent.
2.1.d Average Household Size
Table 2.4 presents the change in average household size for each county within the Northeastern
Nevada Regional Development Authority region, the state of Nevada, and for the United States
between 2013 and 2019. Elko County and the City of Elko are highlighted.
Table 2.4 – Average Household Size
Communities within the Northeastern Nevada Regional Development Authority
Community 2013 2019 2013-2019 2013-2019
Actual Change Percent Change
Elko County 2.80 2.85 0.05 1.8%
Carlin 2.75 2.66 -0.09 -3.3%
Elko 2.78 2.74 -0.04 -1.4%
Wells 2.34 2.21 -0.13 -5.6%
West Wendover 3.26 3.48 0.22 6.7%
Eureka County 2.43 2.40 -0.03 -1.2%
Eureka 2.61 1.84 -0.77 -29.5%
Lander County 2.87 2.54 -0.33 -11.5%
Austin 2.78 1.74 -1.04 -37.4%
Battle Mountain 2.85 2.49 -0.36 -12.6%
White Pine County 2.74 2.33 -0.41 -15.0%
Ely 2.60 2.33 -0.27 -10.4%
State of Nevada 2.70 2.67 -0.03 -1.1%
United States 2.63 2.62 -0.01 -0.4%
Source: U.S. Census Bureau; American Community Survey, 5-Year Estimates; 2013 and 2019
Between 2013 and 2019, Elko County was the only county within the northeastern Nevada
region that experienced an increase in the estimated average household size. For all of Elko
County, the estimated average household size increased from an estimated 2.80 people per
The 2021 Annual Update to the Comprehensive Economic Development Strategy Page 13 of 80
for Elko County, Nevada and the Individual Communities of the City of Elko, December 2021
Jackpot, and Spring Creekhousehold in 2013 to an estimated 2.85 people per household in 2019, a net increase of 0.05 people per household or by 1.8 percent. For just the City of Carlin, the estimated average household size decreased from an estimated 2.75 people per household in 2013 to an estimated 2.66 people per household in 2019, a net decrease of 0.09 people per household or by -3.3 percent while the estimated average household size for the City of Elko decreased from an estimated 2.78 people per household in 2013 to an estimated 2.74 people per household in 2019, a net decrease of 0.04 people per household or by -1.4 percent. For the City of Wells, the estimated average household size decreased from an estimated 2.34 people per household in 2013 to an estimated 2.21 people per household in 2019, a net decrease of 0.13 people per household or by -5.6 percent while the average household size for the City of West Wendover actually increased, increasing from an estimated 3.26 people per household in 2013 to an estimated 3.48 people per household in 2019, a net increase of 0.22 people per household or by 6.7 percent. For all of Eureka County, the estimated average household size decreased from an estimated 2.43 people per household in 2013 to an estimated 2.40 people per household in 2019, a net decrease of 0.03 people per household or by -1.2 percent while the average household size for just the town of Eureka decreased significantly, decreasing from an estimated 2.61 people per household in 2013 to an estimated 1.84 people per household in 2019, a net decrease of 0.77 people per household or by -29.5 percent. For all of Lander County, the estimated average household size decreased from an estimated 2.87 people per household in 2013 to an estimated 2.54 people per household in 2019, a net decrease of 0.33 people per household or by -11.5 percent. The average household size for just the town of Austin decreased significantly from an estimated 2.78 people per household in 2013 to an estimated 1.74 people per household in 2019, a net decrease of 1.04 people per household or by -37.4 percent. For just the town of Battle Mountain, the estimated average household size decreased from an estimated 2.85 people per household in 2013 to an estimated 2.49 people per household in 2019, a net decrease of 0.36 people per household or by a percentage decrease of -12.6 percent. Between 2013 and 2019, the estimated average household size for all of White Pine County decreased from an estimated 2.74 people per household in 2013 to an estimated 2.33 people per household in 2019, a net decrease of 0.41 people per household or by -15.0 percent. For just the City of Ely, the estimated average household size decreased from an estimated 2.60 people per household in 2013 to an estimated 2.33 people per household in 2019, a net decrease of 0.27 people per household or by a percentage decrease of -10.4 percent. Statewide, the estimated average household size for the entire state of Nevada decreased slightly, decreasing from an estimated 2.70 people per household in 2013 to an estimated 2.67 people per household in 2019, a net decrease of just 0.03 people per household or by -1.1 percent. Nationwide, the estimated average household size for the entire United States also decreased only slightly, decreasing from an estimated 2.63 people per household in 2013 to an estimated 2.62 people per household in 2019, a net decrease of just 0.01 people per household or by a percentage decrease of -0.4 percent. The 2021 Annual Update to the Comprehensive Economic Development Strategy Page 14 of 80 for Elko County, Nevada and the Individual Communities of the City of Elko, December 2021 Jackpot, and Spring Creek
2.1.e Median Household Income

Table 2.5 presents the change in median household income (in 2019 inflation-adjusted dollars)
for each county within the Northeastern Nevada Regional Development Authority region, the
state of Nevada, and for the United States between 2013 and 2019. Elko County and the City of
Elko are highlighted.

Between 2013 and 2019, the estimated median household income for all Elko County increased
from an estimated $70,238 in 2013 to an estimated $78,929 in 2019, a net increase of $10,994 or
by 15.7 percent. Over the same 2013 to 2019 period, the estimated median household income
for the City of Carlin, the City of Elko, the City of Wells, and the City of West Wendover all
increased. For the City of Carlin, the estimated median household income increased by a total of
$9,822 or by 14.2 percent between 2013 and 2019, increased by an estimated $2,337 or by a
percentage increase of 2.8 percent for the City of Elko, increased by an estimated $8,058 or by a
percentage increase of 14.5 percent for the City of Wells, and increased significantly by an
estimated $26,534 or by 70.3 percent for the City of West Wendover.

        Table 2.5 – Median Household Income (2019 Inflation-Adjusted Dollars)
      Communities within the Northeastern Nevada Regional Development Authority
    Community              2013               2019             2013-2019          2013-2019
                                                             Actual Change      Percent Change
    Elko County          $70,238             $81,232            $10,994             15.7%
       Carlin            $69,107             $78,929             $9,822             14.2%
        Elko             $75,989             $79,205             $3,216              4.2%
       Wells             $46,875             $48,958             $2,083              4.4%
   West Wendover         $37,740             $64,274            $26,534             70.3%

  Eureka County          $64,632             $67,105             $2,473             3.8%
     Eureka              $50,268             $63,560            $13,292             26.4%

  Lander County          $72,742             $88,030            $15,288             21.0%
       Austin            $43,809                -                  -                   -
  Battle Mountain        $76,090             $73,536            -$2,554             -3.4%

 White Pine County       $48,586             $60,827            $12,241             25.2%
        Ely              $49,316             $60,048            $10,732             21.8%

  State of Nevada        $52,800             $60,365             $7,565             14.3%
   United States         $53,046             $62,843             $9,797             18.5%
Source: U.S. Census Bureau; American Community Survey, 5-Year Estimates; 2013 and 2019

For all of Eureka County, the estimated median household income increased from an estimated
$64,632 in 2013 to an estimated $67,105 in 2019, a net increase of $2,473 or by a percentage
increase of 3.8 percent while the estimated median household income for just the town of Eureka
increased significantly between 2013 and 2019, increasing by an estimated $13,292 or by a
percentage increase of 26.4 percent. For all of Lander County, the estimated median household
income increased significantly from an estimated $72,742 in 2013 to an estimated $88,030 in

The 2021 Annual Update to the Comprehensive Economic Development Strategy Page 15 of 80
for Elko County, Nevada and the Individual Communities of the City of Elko, December 2021
Jackpot, and Spring Creek
2019, a net increase of $15,288 or by 21.0 percent. While data for median household income for
the town of Austin was not available for 2019, the estimated median household income for the
town of Austin in 2013 was an estimated $43,809. The estimated median household income for
just the town of Battle Mountain decreased between 2013 and 2019, decreasing by an estimated
$2,554 or by a percentage decrease of -3.4 percent. Between 2013 and 2019, the estimated
median household income for all of White Pine County increased from an estimated $48,586 in
2013 to an estimated $60,827 in 2019, a significant net increase of $12,241 or by an estimated
25.2 percent. For just the City of Ely, the estimated median household income also increased
significantly between 2013 and 2019, increasing by an estimated $10,732 or by a percentage
increase of 21.8 percent.
Statewide, the estimated median household income for the entire state of Nevada increased from
an estimated $52,800 in 2013 to an estimated $60,365 in 2019, a net increase of $7,565 or by a
percentage increase of 14.3 percent. Nationwide, the estimated median household income for the
entire United States increased from an estimated $53,046 in 2013 to an estimated $62,843 in
2019, a net increase of $9,797 or by a percentage increase of 18.5 percent.
2.1.f Median Family Income
Table 2.6 presents the change in median family income (in 2019 inflation-adjusted dollars) for
each county within the Northeastern Nevada Regional Development Authority region, the state
of Nevada, and for the United States between 2013 and 2019. Elko County and the City of Elko
are highlighted.
Table 2.6 – Median Family Income (2019 Inflation-Adjusted Dollars)
Communities within the Northeastern Nevada Regional Development Authority
Community 2013 2019 2013-2019 2013-2019
Actual Change Percent Change
Elko County $75,231 $91,288 $16,057 21.3%
Carlin $75,046 $82,679 $7,633 10.2%
Elko $84,458 $86,795 $2,337 2.8%
Wells $55,500 $63,558 $8,058 14.5%
West Wendover $41,208 $68,289 $27,081 65.7%
Eureka County $94,648 $85,096 -$9,552 -10.1%
Eureka $64,853 $66,447 $1,594 2.5%
Lander County $75,857 $98,516 $22,659 29.9%
Austin $60,278 - - -
Battle Mountain $80,313 $88,890 $8,577 10.7%
White Pine County $63,982 $72,238 $8,256 12.9%
Ely $63,459 $63,102 -$357 -0.6%
State of Nevada $61,359 $71,916 $10,557 17.2%
United States $64,719 $77,263 $12,544 19.4%
Source: U.S. Census Bureau; American Community Survey, 5-Year Estimates; 2013 and 2019
The 2021 Annual Update to the Comprehensive Economic Development Strategy Page 16 of 80
for Elko County, Nevada and the Individual Communities of the City of Elko, December 2021
Jackpot, and Spring CreekBetween 2013 and 2019, median family income for all of Elko County increased significantly from an estimated $75,231 in 2013 to an estimated $91,288 in 2019, a net increase of $16,057 or by 21.3 percent. Median family income for just the City of Carlin increased by an estimated $7,633 or by 10.2 percent between 2013 and 2019, increased by an estimated $2,337 or by 2.8 percent for the City of Elko, increased by an estimated $8,058 or by 14.5 percent for the City of Wells, and increased significantly by an estimated $27,081 or by 65.7 percent for the City of West Wendover. For just Eureka County, median family income decreased between 2013 and 2019, decreasing from an estimated $94,648 in 2013 to an estimated $85,096 in 2019 a net decrease of $9,552 or by a percentage decrease of -10.1 percent. For just the town of Eureka, median family income increased from an estimated $64,853 in 2013 to an estimated $66,447 in 2019, a net increase of $1,594 or by 2.5 percent. For all of Lander County, median family income increased significantly between 2013 and 2019, increasing from an estimated $75,857 in 2013 to an estimated $98,516 in 2019, a net increase of $22,659 or by 29.9 percent. While median family income was unavailable for the town of Austin in 2019, the estimated median family income for the town of Austin in 2013 was an estimated $60,278 and increased for the town of Battle Mountain by an estimated $8,577 or by 10.7 percent between 2013 and 2019. For all of White Pine County, median family income increased from an estimated $63,982 in 2013 to an estimated $72,238 in 2019, a net increase of $8,256 or by 12.9 percent and, for the City of Ely, median family income declined only slightly, decreasing from an estimated $63,459 in 2013 to an estimated $63,102 in 2019, a net decrease of just $357 or by -0.6 percent. Comparatively, median family income for the entire state of Nevada increased from an estimated $61,359 in 2013 to an estimated $71,916 in 2019, a net increase of $10,557 or by 17.2 percent. Nationwide, median family income for the entire United States increased from an estimated $64,719 in 2013 to an estimated $77,263 in 2019, a net increase of $12,544 or by 19.4 percent. 2.1.g Per Capita (Mean) Income Table 2.7 presents the change in per capita income (in 2019 inflation-adjusted dollars) for each county within the Northeastern Nevada Regional Development Authority region, the state of Nevada, and for the United States between 2013 and 2019. Elko County and the City of Elko are highlighted. Between 2013 and 2019, per capita income for all of Elko County increased significantly from an estimated $28,358 in 2013 to an estimated $33,875 in 2019, a net increase of $5,517 or by 19.5 percent. For just the City of Carlin, per capita income increased by an estimated $4,098 or by 14.0 percent between 2013 and 2019, increased by an estimated $4,228 or by 13.6 percent for the City of Elko, increased by an estimated $4,253 or by 18.2 percent for the City of Wells, and increased dramatically by an estimated $10,658 or by 71.1 percent for the City of West Wendover. For all of Eureka County, per capita income increased from an estimated $28,056 in 2013 to an estimated $34,249 in 2019, a net increase of $6,193 or by 22.1 percent and, for just The 2021 Annual Update to the Comprehensive Economic Development Strategy Page 17 of 80 for Elko County, Nevada and the Individual Communities of the City of Elko, December 2021 Jackpot, and Spring Creek
the town of Eureka, per capita income increased from an estimated $24,700 in 2013 to an
estimated $29,504 in 2019, a net increase of $4,804 or by 19.4 percent.

For all of Lander County, per capita income increased from an estimated $29,800 in 2013 to an
estimated $34,000 in 2019, a net increase of $4,200 or by 14.1 percent. While per capita income
was unavailable for the town of Austin in 2019, the estimated per capita income for the town of
Austin in 2013 was an estimated $17,523 and increased for the town of Battle Mountain by an
estimated $1,002 or by 3.2 percent between 2013 and 2019. For all of White Pine County, per
capita income increased from an estimated $24,435 in 2013 to an estimated $25,675 in 2019, a
net increase of $1,240 or by 5.1 percent but decreased for the City of Ely, decreasing from an
estimated $28,226 in 2013 to an estimated $27,774 in 2019, a net decrease of $452 or by a
percentage decrease of -1.6 percent.

   Table 2.7 – Per Capita (Mean) Income, Individuals (2019 Inflation-Adjusted Dollars)
     Communities within the Northeastern Nevada Regional Development Authority
    Community              2013                2019             2013-2019          2013-2019
                                                              Actual Change      Percent Change
    Elko County           $28,358            $33,875              $5,517             19.5%
       Carlin             $29,339            $33,437              $4,098             14.0%
        Elko              $31,042            $35,270              $4,228             13.6%
       Wells              $23,401            $27,654              $4,253             18.2%
   West Wendover          $14,982            $25,640             $10,658             71.1%

  Eureka County           $28,056            $34,249              $6,193             22.1%
     Eureka               $24,700            $29,504              $4,804             19.4%

  Lander County           $29,800            $34,000              $4,200             14.1%
       Austin             $17,523               -                    -                  -
  Battle Mountain         $31,153            $32,155              $1,002              3.2%

 White Pine County        $24,435            $25,675              $1,240              5.1%
        Ely               $28,226            $27,774              -$452               -1.6%

  State of Nevada         $26,589            $31,557              $4,968             18.7%
   United States          $28,155            $34,103              $5,948             21.1%
Source: U.S. Census Bureau; American Community Survey, 5-Year Estimates; 2013 and 2019

Statewide, per capita income for the entire state of Nevada increased from an estimated $26,589
in 2013 to an estimated $31,557 in 2019, a net increase of $4,968 or by an estimated 18.7
percent. Nationwide, per capita income for the entire United States increased from an estimated
$28,155 in 2013 to an estimated $34,103 in 2019, a net increase of $5,948 or by an estimated
21.1 percent.

2.1.h Percent of Total Population Living Below the Poverty Line

Table 2.8 presents the change in the percentage of total population living below the poverty line
for each county within the Northeastern Nevada Regional Development Authority region, the

The 2021 Annual Update to the Comprehensive Economic Development Strategy Page 18 of 80
for Elko County, Nevada and the Individual Communities of the City of Elko, December 2021
Jackpot, and Spring Creek
state of Nevada, and for the United States between 2013 and 2019. Elko County and the City of
Elko are highlighted.
Between 2013 and 2019, the percentage of total population living below the poverty line
throughout all of Elko County increased from an estimated 8.8 percent in 2013 to an estimated
11.7 percent in 2019, a net increase of 2.9 percent or by a percentage increase of 33.0 percent.
For just the City of Carlin, the percentage of total population living below the poverty line
decreased significantly between 2013 and 2019, decreasing by a net 4.8 percent or by a
percentage decrease of -81.4 percent, increased significantly for the City of Elko by a net 8.1
percent or by a percentage increase of 128.6 percent, increased significantly for the City of Wells
by a net 3.7 percent or by a percentage increase of 46.8 percent, and decreased significantly for
the City of West Wendover by a net 11.2 percent or by a percentage decrease of -45.2 percent.
The percentage of total population living below the poverty line for all of Eureka County
decreased significantly between 2013 and 2019, decreasing from an estimated 13.9 percent in
2013 to an estimated 8.0 percent in 2019, a net decrease of 5.9 percent or by a percentage
decrease of -42.4 percent, and decreased by an estimated 0.3 percent or by a percentage decrease
of -1.8 percent for just the town of Eureka between 2013 and 2019.
Table 2.8 – Percent of Total Population Living Below the Poverty Line
Communities within the Northeastern Nevada Regional Development Authority
Community 2013 2019 2013-2019 2013-2019
Actual Change Percent Change
Elko County 8.8% 11.7% 2.9% 33.0%
Carlin 5.9% 1.1% -4.8% -81.4%
Elko 6.3% 14.4% 8.1% 128.6%
Wells 7.9% 11.6% 3.7% 46.8%
West Wendover 24.8% 13.6% -11.2% -45.2%
Eureka County 13.9% 8.0% -5.9% -42.4%
Eureka 16.9% 16.6% -0.3% -1.8%
Lander County 9.3% 9.7% 0.4% 4.3%
Austin 15.2% - - -
Battle Mountain 8.7% 10.0% 1.3% 14.9%
White Pine County 12.9% 13.6% 0.7% 5.4%
Ely 11.2% 18.2% 7.0% 62.5%
State of Nevada 15.0% 13.1% -1.9% -12.7%
United States 15.4% 13.4% -2.0% -13.0%
Source: U.S. Census Bureau; American Community Survey, 5-Year Estimates; 2013 and 2019
For all Lander County, the percentage of total population living below the poverty line increased
from an estimated 9.3 percent in 2013 to an estimated 9.7 percent in 2019, a net increase of 0.4
percent or by a percentage increase of 4.3 percent. While the percentage of total population
living below the poverty line was unavailable for the town of Austin in 2019, the estimated
percentage of total population living below the poverty line for just the town of Austin in 2013
The 2021 Annual Update to the Comprehensive Economic Development Strategy Page 19 of 80
for Elko County, Nevada and the Individual Communities of the City of Elko, December 2021
Jackpot, and Spring CreekYou can also read